

Abstract
Background
Although functional brain imaging has established that individuals with unipolar major depressive disorder (MDD) are characterized by frontostriatal dysfunction during reward processing, no research to date has examined the chronometry of neural responses to rewards in euthymic individuals with a history of MDD.
Method
A monetary incentive delay task was used during fMRI scanning to assess neural responses in frontostriatal reward regions during reward anticipation and outcomes in 19 participants with remitted major depressive disorder (rMDD) and in 19 matched control participants.
Results
During the anticipation phase of the task, the rMDD group was characterized by relatively greater activation in bilateral anterior cingulate gyrus, in right midfrontal gyrus, and in the right cerebellum. During the outcome phase of the task, the rMDD group was characterized by relatively decreased activation in bilateral orbital frontal cortex, right frontal pole, left insular cortex, and left thalamus. Exploratory analyses indicated that activation within a right frontal pole cluster that differentiated groups during reward anticipation predicted the number of lifetime depressive episodes within the rMDD group.
Limitations
Replication with larger samples is needed.
Conclusions
Results suggest a double dissociation between reward network reactivity and temporal phase of the reward response in rMDD, such that rMDD is generally characterized by reward network hyperactivation during reward anticipation and reward network hypoactivation during reward outcomes. More broadly, these data suggest that aberrant frontostriatal response to rewards may potentially represent a trait marker for MDD, though future research is needed to evaluate the prospective utility of this functional neural endophenype as a marker of MDD risk.
Keywords: Major Depressive Disorder, Remission, Reward, Anhedonia, Anticipation, Magnetic Resonance Imaging
Introduction
Major Depressive Disorder (MDD) is characterized by anhedonia, the loss of interest or pleasure in normally rewarding activities (American Psychiatric Association, 1994). A growing body of literature has linked frontostriatal dysfunction during reward processing to anhedonia in MDD (Forbes, Christopher May, Siegle, Ladouceur, Ryan et al., 2006a; Forbes, Hariri, Martin, Silk, Moyles et al., 2009; Smoski, Felder, Bizzell, Green, Ernst et al., 2009; Smoski, Rittenberg, & Dichter, in press; Mitterschiffthaler, Kumari, Malhi, Brown, Giampietro et al., 2003; Keedwell, Andrew, Williams, Brammer, & Phillips, 2005b; Schaefer, Putnam, Benca, & Davidson, 2006; Kumari, Mitterschiffthaler, Teasdale, Malhi, Brown et al., 2003; Keedwell, Andrew, Williams, Brammer, & Phillips, 2005a; Knutson, Bhanji, Cooney, Atlas, & Gotlib, 2008). This literature has established not only the general hyporesponsivity of frontostriatal regions with dense dopaminergic projections to rewards in MDD, but also that the topography of frontostriatal dysfunction to rewards in MDD is critically dependent on both the temporal phase of the reward response and on the type of reward processed.
A critical next step to evaluate whether this marker of MDD status is potentially a trait marker of MDD vulnerability is the evaluation of individuals with a history of MDD but who do not currently meet criteria for the disorder (Mednick & McNeil, 1968; Alloy, Ambramson, Raniere, & Dyller, 1999). Although such a design is not sufficient to establish a trait marker, given that the sequelae of past illness and treatments on brain function may not be conclusively ruled out, it is nevertheless a necessary initial step to identify a disease trait. This approach allows for an examination of relations between heightened risk for MDD and patterns of brain function while mitigating the potential confounding effects of current mood state1, illness severity, the nonspecific effects of chronic illness and stress, the effects of psychotropic medication usage (McCabe, Mishor, Cowen, & Harmer, 2010; Kerestes, Ladouceur, Meda, Nathan, Blumberg et al., 2011). Thus, examining linkages between brain function and a history of MDD holds the ultimate promise of aiding in the identification of trait-like endophenotypic vulnerability markers predictive of disease onset prior to the manifestation of clinically impairing symptoms. Furthermore, functional brain imaging in a powerful tool to evaluate a potential marker of disease vulnerability given that brain-based endophenotypes may hold relatively greater promise as predictors of disease manifestation and progression given the closer association between such measures and the genetic and environmental causes of psychiatric illness than observable behavior (Peterson & Weissman, 2011).
Euthymic individuals with a history of MDD show a range of altered neurocognitive and neurobiological profiles, including deficits in measures of attention and executive functions (Paelecke-Habermann, Pohl, & Leplow, 2005), larger event-related potential feedback-related negativities (Santesso, Steele, Bogdan, Holmes, Deveney et al., 2008), increased ventral striatal-cortical connectivity (Pail, Scharinger, Kalcher, Huf, Boubela et al., 2011), and decreased resting regional homogeneity in frontal, temporal and parietal lobes and increased regional homogeneity in the putamen, frontal and parietal lobes (Yuan, Zhang, Bai, Yu, Shi et al., 2008).
Most relevant in the present context are task-based functional brain imaging studies in rMDD. The clear majority of such studies indicate that rMDD is characterized by brain hypoactivation relative to individuals with MDD or controls, including reduced DLPFC activation to maternal critical remarks (Hooley, Gruber, Scott, Hiller, & Yurgelun-Todd, 2005), reduced right DLPFC and left VLPFC activity to positive emotional distracters during a working memory task (Kerestes et al., 2011), decreased medial prefrontal activity to sad film clips (Farb, Anderson, Bloch, & Segal, 2011), decreased pregenual anterior cingulate cortex activation to sad autobiographical memories (Liotti, Mayberg, McGinnis, Brannan, & Jerabek, 2002), decreased activation in right middle frontal gyrus during an emotional oddball task (Wang, Krishnan, Steffens, Potter, Dolcos et al., 2008), and reduced left middle frontal gyrus activation during a verbal fluency task (Okada, Okamoto, Yamashita, Ueda, Takami et al., 2009). However, a small subset of studies has reported brain hyperactivation in MDD. Schoning and collegues (2009) reported increased cingulate cortex activation during a working-memory task in rMDD, Kerestes and colleagues (2011) reported greater left DLPFC activity to negative emotional distracters during a working memory task, and Farb and colleagues (2011) reported higher calcarine cortex activity to sad film clips. These findings have been interpreted to reflect possible compensatory activation to maintain adequate task performance in the rMDD samples. Finally, we are aware of one published study of reward processing in rMDD: McCabe and colleagues (2009) found decreased activation in the ventral striatum in response to the sight and flavor of chocolate. However, no study to date has examined response to rewards during both anticipation and outcome phases of the reward response.
The purpose of the present study was to extend research on reward processing deficits in MDD to individuals with a history of MDD using a functional magnetic resonance imaging (fMRI) task that has been shown to differentiate MDD and nondepressed control samples. Hypotheses were informed by data from our laboratory (Smoski et al., 2009; Dichter, Felder, Petty, Bizzell, Ernst et al., 2009; Smoski et al., in press) and other research groups (Forbes, Christopher May, Siegle, Ladouceur, Ryan et al., 2006b; Forbes, Hariri, Martin, Silk, Moyles et al., 2008; Mitterschiffthaler et al., 2003; Schaefer et al., 2006; Kumari et al., 2003; Keedwell et al., 2005a, 2005b; McCabe et al., 2009) demonstrating frontostriatal hypoactivation to rewards in MDD, and more specifically, hyporesponsivity in ventral striatal regions during reward anticipation and in ventromedial prefrontal cortex during reward outcomes. However, given that treatments for MDD may increase or decrease brain function (Kennedy, Konarski, Segal, Lau, Bieling et al., 2007; Goldapple, Segal, Garson, Lau, Bieling et al., 2004; Kennedy, Evans, Kruger, Mayberg, Meyer et al., 2001) and given that the extant fMRI ligature reviewed above has documented both brain hypo- and hyper-activation in rMDD, hypotheses about the specific direction of group differences were tentative in nature. Exploratory follow-up analyses examined relations between clinical correlates in the rMDD sample and neural response to rewards during the fMRI task.
Method
1.1. Participants
Nineteen affectively healthy right-handed adult control participants (7 male; 15 Caucasian; 27.9 ± 6.3 years old; all right-handed) were recruited from lists of potential participants maintained by the Duke-UNC Brain Imaging and Analysis Center (BIAC). Nineteen adults with rMDD (4 male; 13 Caucasian; 24.5 ± 5.4 years old; 17 right-handed) were recruited via the Cognitive Behavioral Research and Treatment Program at Duke University Medical Center. Exclusion criteria for both groups included age < 19 or > 55 years, current Axis I psychopathology, psychiatric medication use within the past month, estimated verbal IQ scores < 80, BDI > 8, or MRI contraindications. None of the control participants and two rMDD participants were receiving psychotherapy at the time of participation. Five rMDD participants had previously used psychotropic medications. Inclusion in the rMDD group was contingent on a prior diagnosis of MDD based on SCID I semi-structured interview (First, Spitzer, Gibbon, & Williams, 1996). Control participants were lifetime-free of MDD. All participants consented to a protocol approved by the local Human Investigations Committees at both UNC-Chapel Hill and Duke University Medical Centers and were paid at least $35 for completing the imaging portion of the study. All participants had normal or corrected-to-normal vision and completed a mock scan session prior to imaging. Information about demographics and prior MDD episodes are presented in Table 1.
Table 1.
Demographic and symptom severity information for control and rMDD participants.
| Remitted MDD (n=19; 4 ♂) | Controls (n=19; 7 ♂) | t (p) (two-tailed) | |
|---|---|---|---|
| Age | 23.6 (4.09) | 27.9 (6.3) | 1.89 (0.072) |
| RRS | 1.42 (0.303) | 1.25 (0.19) | 2.079 (0.045) |
| NAART: Verbal IQ | 110.36 (5.01) | 110.7 (3.30) | 0.24 (0.81) |
| BDI | 2.63 (4.91) | 1.37 (2.29) | 1.016 (0.32) |
| Number with prior hospitalization for MDD | 3 | 0 | |
| Average number of MDD episodes | 1.56 (0.86) | 0 | |
| Average duration of most recent MDD episode in months | 6.84 (5.20) | 0 | |
| Average number of months since most recent MDD episode | 40.8 (44.9) | 0 |
Note: RRS: Ruminative Responses Scale (Nolen-Hoeksema et al., 1993); NAART: North American Adult Reading Test (Blair & Spreen, 1989); BDI: Beck Depression Inventory (Beck, Steer, & Brown, 1996).
1.2. fMRI task
The fMRI task was a modified from the Monetary Incentive Delay (MID) task as implemented in Knutson, Westdorp, Kaiser, & Hommer (2000) and used previously by our research group (Smoski et al., in press). Participants practiced the task outside the scanner prior to the scan session. Participants completed four functional imaging runs. On two runs, money could be won or not won, but money could not be lost; on the other two runs, money could be lost or not lost, but money could not be won. Only results from runs with potential monetary wins are presented here. Each run began with a 10-sec instructional screen indicating whether the forthcoming run would be a “win” or a “loss” run. Run types (i.e., win or loss runs) were presented in alternating order, and the run type presented first was counter-balanced across participants.
Task conditions and trial timings are summarized in Figure 1. Each trial consisted of: (1) a 2000 ms cue that indicated whether adequately quick responses to the forthcoming target bulls-eye could result in a “win” (a triangle) or could not (a circle); (2) a delay period during which a crosshair was presented for 2000–2500 msec; (3) a target bulls-eye that required a speeded button press presented for up to 500 msec; (4) 3000 ms of feedback that indicated whether that trial was a “win” or not; and (5) a variable length ITI crosshair presented such that the total duration of each trial was 12 sec. Trial types (i.e., potential win or not potential win) were aperiodic and pseudorandomly ordered.
Figure 1.

The MID task. Each trial consisted of a cue (i.e., a triangle indicated an incentive trial, a circle indicated a non-incentive trial), an anticipatory delay, a target, and outcome feedback.
Participants could win $1 per trial, and feedback was a text display of the amount of money won (“+$1”). Coincident with this feedback, a cumulative count of the number of dollars won within the run was presented. Participants were instructed to respond to all target bulls-eyes as quickly as possible, and outcomes on win trials were contingent on reaction times. The task was adaptive such that participants were successful on two-thirds of trials, regardless of individual differences in reaction times. Each 8-minute run contained 40 trials: 20 were potential win trials, 20 were non-win control trials. Prior to entering the scanner, participants were shown the money they could win based on scanner task performance. Stimuli were presented using E-Prime presentation software v. 1.1 (Psychology Software Tools Inc., Pittsburgh, PA) and displayed in the scanner through magnet-compatible goggles (Resonance Technology, Inc., Northridge CA).
1.3. Imaging methods
Scanning was performed on a General Electric (Waukesha, Wisconsin, USA) MR750 3.0 Tesla scanner. This scanner is equipped with high-power high-duty-cycle 50-mT/m gradients at 200 T/m/s slew rate and a 32-channel head coil for parallel imaging. A quadrature birdcage radio frequency head coil was used for transmit and receive. A high resolution T1-weighted image with 166 slices was acquired using a 3D FSPGR pulse sequence (TR = 7.484 ms; TE = 2.984 ms; FOV = 256 mm; image matrix = 256 × 256; voxel size = 1 mm3) and used for coregistration with the functional data. This structural image was aligned in a near axial plane defined by the anterior and posterior commissures. Whole brain functional images were acquired using a spiral pulse sequence with SENSE reconstruction sensitive to blood oxygenation level dependent contrast (TR, 2000 ms; TE, 30 ms; FOV, 256 mm; image matrix, 64 × 64; α= 60°; voxel size = 4 mm3; 32 axial slices). Functional images were aligned similarly to the T1-weighted structural image. A semiautomated high-order shimming program ensured global field homogeneity.
1.4. Imaging data analysis
Functional data were preprocessed using FSL version 4.1.8 (Oxford Centre for Functional Magnetic Resonance Imaging of the Brain (FMRIB), Oxford University, U.K.). Timing files were converted to FSL-compatible format and NIFTI image data files were generated. Preprocessing was applied in the following steps: (i) brain extraction for non-brain removal (Smith, Jenkinson, Woolrich, Beckmann, Behrens et al., 2004), (ii) motion correction using MCFLIRT (Smith, 2002), (iii) spatial smoothing using a Gaussian kernel of FWHM 5 mm, (iv) mean-based intensity normalization of all volumes by the same factor, and (v) high-pass filtering (Jenkinson, Bannister, Brady, & Smith, 2002), as implemented by the FSL FEAT preprocessing utility. Functional images of each participant were co-registered to structural images in native space, and structural images were normalized into a standard stereotaxic space (Montreal Neurological Institute) for intersubject comparison. The same transformation matrices used for structural-to-standard transformations were then used for functional-to-standard space transformations of co-registered functional images. All registrations were carried out using an intermodal registration tool (Jenkinson et al., 2002; Smith et al., 2004). Voxel-wise temporal autocorrelation was estimated and corrected using FMRIB’s Improved Linear Model (FILM; Jenkinson & Smith, 2001).
Onset times of events were used to model a signal response containing a regressor for each response type, which was convolved with a double-γ function to model the hemodynamic response. Model fitting generated whole brain images of parameter estimates and variances representing average signal change from baseline. Group-wise activation images were calculated by a mixed effects higher level analysis using Bayesian estimation techniques, FMRIB Local Analysis of Mixed Effects (FLAME, Woolrich, Ripley, Brady, & Smith, 2001; Smith et al., 2004). Following the guidelines of Lieberman and Cunningham (2009), clusters of ten or more voxels with minimum values of z > 2.58 (p < .005) were classified as significant activations.
The anticipation and outcome phases of the task were analyzed separately. For both phases, the primary method of analysis was to identify clusters that showed significant interactions of group (control vs rMDD) and trial type (potential win versus non-potential win during the anticipatory phase, and wins versus non-wins during the outcome phase). This whole-brain analytic approach identified clusters that differentiated groups on the basis of potential responses to reward (during the anticipation phase) and on the basis of reward outcomes (during the outcome phase). To constrain activation maps to brain areas responsive to the task, planned analyses included masking group-difference activation maps by activations maps of responses averaged for all participants regardless of group membership thresholded by the same criteria.
Activation localizations were based on Harvard-Oxford cortical and subcortical structural probabilistic atlases, with Brodmann area identification via Talairach Daemon, as implemented in FSLView v3.1.8.
Results
Imaging data: Anticipatory Responses
Group (control vs rMDD) × trial type (potential win versus non-potential win) interaction mixed effect analyses were performed on anticipatory phase data. Activation maps were masked by anticipatory responses averaged for all participants regardless of group membership. Results revealed no brain areas with significantly decreased activation in the rMDD group, relative to the control group2. However, there were a number of frontostriatal clusters reflecting relatively greater activation in the rMDD group, including bilateral pregenual anterior cingulate gyrus (ACG), the right midfrontal gyrus (MFG), and a large cluster in the right cerebellum (see Figure 2 and Table 2).
Figure 2.
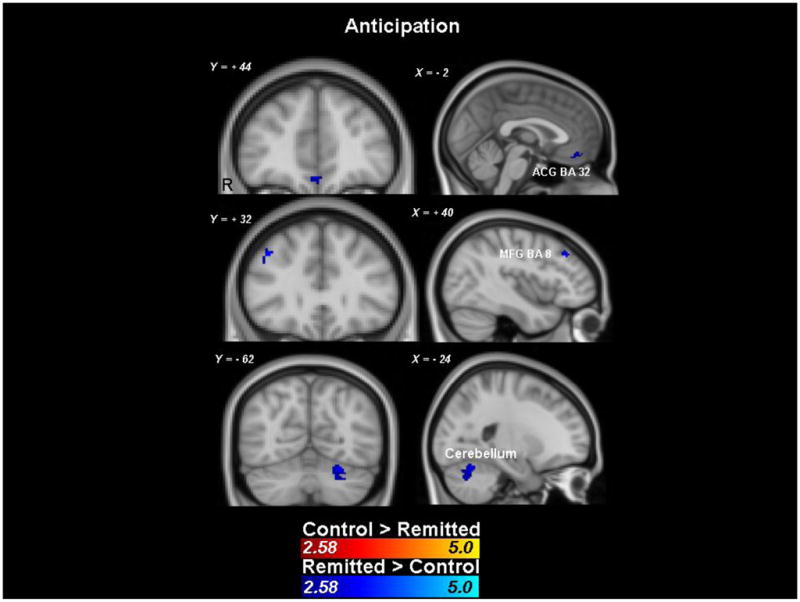
Clusters showing significant group differences during reward anticipation (z > 2.58, with a minimum of 10 voxels/cluster). Responses are masked by the responses of both groups combined thresholded by the same criteria.
Table 2.
Clusters showing significantly greater activation in the rMDD group relative to the control group during reward anticipation (there were no regions showing decreased activation in the rMDD group relative to the control group). All voxels within these clusters are z > 2.58, with a minimum of 10 voxels/cluster. Responses are masked by the responses of both groups combined thresholded by the same criteria.
| Region | Side | Brodmann Area | Size (mm3) | Z Max | MNI coordinates | ||
|---|---|---|---|---|---|---|---|
| X | Y | Z | |||||
| Caudate | Left | 304 | 3.26 | −14 | −4 | +22 | |
| Cerebellum (Anterior)* | Right | 168 | 3.12 | +6 | −54 | −16 | |
| Cingulate Gyrus (Anterior) | |||||||
| Right | 48 | 2.78 | +4 | −10 | +26 | ||
| Left | 32 | 224 | 3.01 | −2 | 36 | 22 | |
| Frontal Gyrus (Middle) | Right | 8 | 176 | 3.46 | +40 | +30 | +38 |
| Frontal Orbital Cortex | Right | 72 | 2.97 | +22 | +34 | −12 | |
| Occipital Fusiform Gyrus | |||||||
| Left* | 1008 | 3.86 | −16 | −86 | −24 | ||
| Right | 240 | 4.28 | +10 | −90 | −18 | ||
| Paracingulate Gyrus** (Anterior) | Right | 32 | 344 | 3.06 | +2 | +42 | −14 |
| Parahippocampal Gyrus (Anterior) | Left | 200 | 3.61 | −10 | −6 | −22 | |
| Parietal Lobule (superior) | Left | 40 | 168 | 3.37 | −40 | −50 | +58 |
| Precuneous Cortex, Lingual Gyrus | Right | 64 | 2.96 | 28 | −54 | +8 | |
| Supplementary Motor Cortex | Right | 64 | 3.36 | +2 | +4 | +74 | |
| Supramarginal Gyrus (posterior) | |||||||
| Right | 384 | 3.76 | +36 | −48 | +38 | ||
| Left | 40 | 176 | 3.04 | −40 | −44 | +42 | |
Two clusters within same region, coordinates and peak activation reported for highest peak activation
Three clusters within same region, coordinates and peak activation reported for highest peak activation
Imaging data: Outcome Response
Group (control vs rMDD) × trial type (wins versus non-wins) interaction mixed effect analyses were performed on outcome phase data. Activation maps masked by responses averaged for all participants regardless of group membership revealed no group differences in any brain regions. Exploratory analyses of unmasked group differences were conducted, which yielded two clusters outside of the reward network with significantly increased activation in the rMDD group, relative to the control group. There also were a number of unmasked frontostriatal clusters reflecting relatively decreased activation in the rMDD group, including bilateral orbital frontal cortex (OFC), right frontal pole, left insular cortex, and left thalamus (see Figure 3 and Table 3).
Figure 3.
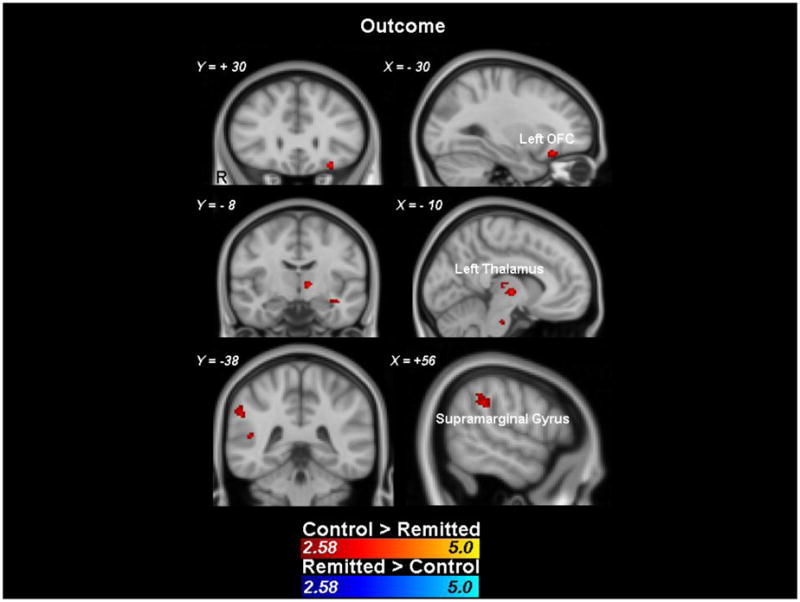
Clusters showing significant group differences during reward outcomes (z > 2.58, with a minimum of 10 voxels/cluster). Responses are unmasked.
Table 3.
Clusters showing significantly less activation in the rMDD group relative to the control group during reward outcomes (unmasked). All voxels within these cluster are z > 2.58, with a minimum of 10 voxels/cluster.
| rMDD<Control
| |||||||
|---|---|---|---|---|---|---|---|
| Region | Side | Brodmann Area | Size (mm3) | Z Max | MNI coordinates | ||
| X | Y | Z | |||||
| Angular Gyrus | Right | 608 | 2.98 | +54 | −46 | ||
| Central Opercular Cortex | |||||||
| Left* | 328 | 3.10 | −58 | −20 | |||
| Right | 64 | 2.80 | +46 | +4 | +20 | ||
| Cingulate Gyrus (posterior) | Left | 72 | 2.92 | −4 | −46 | +4 | |
| Frontal Orbital Cortex | 0 | ||||||
| Left* | 47 | 400 | 3.52 | −28 | +28 | ||
| Right | 48 | 2.78 | +38 | +32 | −18 | ||
| Frontal Pole | Right | 144 | 3.06 | +38 | +46 | −8 | |
| Insular Cortex* | Left | 200 | 2.91 | −36 | +16 | +24 | |
| Intracalcarine Cortex | Right | 200 | 2.94 | +16 | −62 | −2 | |
| Planum Polare | Left | 136 | 3.05 | −46 | +2 | +10 | |
| Precentral Gyrus, | Left | 80 | 2.93 | −58 | −4 | −22 | |
| Superior Lateral Occipital Cortex | Right | 424 | 3.45 | +44 | −68 | +14 | |
| Supramarginal Gyrus (anterior) | Left | 40 | 136 | 2.80 | −56 | −28 | +16 |
| Supramarginal Gyrus (posterior)* | Right | 1864 | 3.71 | +48 | −38 | +24 | |
| Temporal Fusiform Cortex (posterior) | Left | 120 | 2.95 | −32 | −36 | +12 | |
| Temporal Gyrus (posterior, superior) | Left | 22 | 88 | 3.03 | −70 | −34 | −28 |
| Temporal Pole | Right | 48 | 2.89 | +48 | +18 | +4 | |
| Thalamus | Right | 64 | 2.76 | +16 | −8 | −10 | |
| Thalamus | Left | 1448 | 3.67 | −10 | −12 | +4 | |
| Control < rMDD
| |||||||
|---|---|---|---|---|---|---|---|
| Region | Side | Brodmann Area | Size (mm3) | Z Max | MNI coordinates | ||
| X | Y | Z | |||||
| Precuneous Cortex | Left | 56 | 2.82 | −4 | −70 | +48 | |
| Supramarginal Gyrus (posterior) | Left | 176 | 3.31 | −48 | −46 | +56 | |
Two clusters within same region, coordinates and peak activation reported for highest peak activation
Three clusters within same region, coordinates and peak activation reported for highest peak activation
In-scanner Reaction times
In-scanner reaction times to target bulls-eyes were analyzed via a Group (Control, rMDD) × Condition (Gain, Non-gain) repeated measures MANOVA. The Group × Condition interaction effect was not significant, multivariate F(1,36)=1.98, p>.15, there was no main effect of Condition, multivariate F(1,36)=0.93, p>.30, and there was no main effect of Group, F(1,36)=2.19, p>.10. Within-condition comparisons revealed that groups did not differ in reaction times during unrewarded trials, t(36)=0.24, p>.81, but there was a trend towards differences on rewarded trials, t(36)=1.96, p<.06, with slower responses in the rMDD group (mean(SE)= 145 (4.87) than the control group (mean(SE)=133 (3.81) (see the left side of Figure 4).
Figure 4.

Left: Average reaction times to targets. Error bars reflect standard errors of the mean. Right: Significant relation between frontal pole activation during monetary anticipation and the number of lifetime MDD episodes in the rMDD group. The frontal pole cluster was defined on the basis of group difference in activation during this phase of the task.
Clinical Correlations
To test for relations between brain activation magnitudes and clinical features of the rMDD group, correlations between brain activation clusters that predicted group differences (see Tables 2 and 3), clinical measures, and in-scanner reaction times within the rMDD sample were evaluated. These analyses were exploratory in nature and thus not corrected for multiple comparisons to minimize statistical Type II errors. The only significant relation that emerged was a significant positive correlation between the number of lifetime MDD episodes and the magnitude of frontal pole activation during anticipation, r=0.61, p<.006. This relation indicates that greater frontal pole activation during gain anticipation predicted a greater number of lifetime MDD episodes (see the right side of Figure 4).
Discussion
The purpose of this study was to extend the sizeable literature documenting reward system dysfunction in MDD to individuals with rMDD (i.e., a history of MDD but without current MDD). This approach has the potential to inform whether aberrant frontostriatal responses to rewards may represent a trait-like marker of vulnerability to MDD, given that individuals with a history of MDD are at increased risk of developing subsequent episodes of MDD (Hollon, DeRubeis, Shelton, Amsterdam, Salomon et al., 2005). This approach may also aid in elucidating potential neurobiological mechanisms of MDD while mitigating the possible confounding effects of current mood state, illness severity, nonspecific effects of chronic illness and stress, and of psychotropic medication usage (McCabe et al., 2010; Kerestes et al., 2011; Peterson & Weissman, 2011).
Based on data from our own research group (Smoski et al., 2009; Dichter et al., 2009; Smoski et al., in press) and others (Forbes et al., 2006b; Forbes et al., 2008; Mitterschiffthaler et al., 2003; Schaefer et al., 2006; Kumari et al., 2003; Keedwell et al., 2005a, 2005b; McCabe et al., 2009) demonstrating frontostriatal hypoactivation to rewards in MDD, we hypothesized that the rMDD group would be characterized by frontostriatal hypoactivation during both temporal phases of reward responding. Results from the anticipatory phase of the task were contrary to this prediction: there were no brain regions with significantly decreased activation in the rMDD group, relative to the control group, during reward anticipation. However, there were a number of frontostriatal regions known to be responsive to rewards with relatively greater activation in the rMDD group, including the pregenual aspect of the ACG, the right MFG, and the right cerebellum.
The pregenual anterior cingulate has a central role in processing emotion (Etkin, Egner, & Kalisch, 2011) and rewards (Liu, Hairston, Schrier, & Fan, 2011). This region in particular codes for deriving the specific value of an expected reward and for value representations of forthcoming rewards (Wallis & Kennerley, 2010). The midfrontal gyrus plays a critical role in monitoring incentive-based behavioral responses (Haber & Knutson, 2010), and activation of this region has been found to be decreased in MDD during reward-based decision making and to predict depression severity in MDD (Smoski et al., 2009). Finally, although the cerebellum is not typically considered part of the reward network, it has been shown to be involved in aspects of emotion regulation and cognition (Fusar-Poli, Placentino, Carletti, Landi, Allen et al., 2009) and to be functionally impaired in a range of psychiatric disorders (Baldacara, Borgio, Lacerda, & Jackowski, 2008). Our finding of increased activation in this region in rMDD requires replication, but may be linked to the extensive projections from this region to aspects of the reward network (Schmahmann, 2010).
Although the overall direction of effects during the anticipatory phase of the task (i.e., greater activation in the rMDD group relative to the control group) was not predicted, it should be noted that there is evidence of ACG hyperactivation during reward anticipation in individuals with frank MDD, though in the dorsal rather than pregenual aspect of the ACG (Knutson et al., 2008), a finding interpreted to reflect possibly increased uncertainty and conflict during anticipation of attainable gains. Given the localization of the present finding to the pregenual ACC, it may be that case that rMDD is characterized by relatively greater neural resources recruited to represent the value of anticipated rewards. Further, given that rewards were uncertain during the anticipation phase of the task, greater responses in this region in the rMDD group may reflect greater on-line monitoring of speeded button responses to obtain the forthcoming reward (Knutson et al., 2008).
Analyses of outcome phase responses were consistent with hypotheses of reward network hypoactivation in rMDD and revealed a number of frontostriatal brain regions with relatively decreased activation in the rMDD group, including the OFC, right frontal pole, left insular cortex, and left thalamus. The OFC codes the magnitude and affective value of positive and negative rewards and primary reinforcers (Bechara, Damasio, & Damasio, 2000), tracks the subjective utility of delayed rewards (Kable & Glimcher, 2007), and facilitates decision-making based on cost-benefit gradients (de Lafuente & Romo, 2006), particularly in ambiguous contexts (Hsu, Bhatt, Adolphs, Tranel, & Camerer, 2005). As such, the OFC codes hedonic value and abstract representations of positive and negative outcomes and responds similarly to obtained rewards and avoided losses (Rolls, 1996; Kim, Shimojo, & O’Doherty, 2006). Thus, decreased OFC activation in the rMDD group may reflect diminished tagging of this reward stimulus with affective value. Because a major function of the OFC in incentive contexts is to influence future decision making (Deco & Rolls, 2006), this has implications for the downstream effects of decreased OFC activation on goal-oriented behaviors. We note that this results requires replication given the possibility of susceptibility artifact above the sinus cavities.
In reward contexts, the frontal pole in believed to code not for incentive motivation or reward-based decision making, but rather for monitoring and evaluating decisions after the presentation of reward or punishment (Tsujimoto, Genovesio, & Wise, 2010). As such, this region is believed to promote learning associations between behaviors to attain goals as well as costs to attain them (Tsujimoto, Genovesio, & Wise, 2011).
The insular cortex mediates coding both the anticipation and experience of negative outcomes (Knutson, Rick, Wimmer, Prelec, & Loewenstein, 2007; Samanez-Larkin, Hollon, Carstensen, & Knutson, 2008) and insula activity in reward contexts has been linked to anxiety and avoidance learning (Paulus & Stein, 2006; Samanez-Larkin et al., 2008). The thalamus is an integral component of the cortico-basal ganglia system and holds a large glutamatergic projection to the ventral striatum, medial prefrontal cortex, and amygdala (Akert & Hartmann-von Monakow, 1980) and that mediates motivation and emotional drive, planning and cognition for the development and expression of goal-directed behaviors (Haber & Calzavara, 2009; Krebs, Boehler, Roberts, Song, & Woldorff, 2011). Thus, outcome phase data revealed hypoactivation in multiple nodes of the reward network, although we note that outcome phase results were evident only when between-group activations were not masked by grand average task-based activations, and thus we consider these findings exploratory in nature.
Analysis of in-scanner task-related behavior revealed a trend towards relatively slower responses in the rMDD group during only potential reward trials, suggesting a possible behavioral component to altered reward circuitry brain function in rMDD. Exploratory analyses indicated that greater frontal pole activation during monetary anticipation was associated with a greater number of lifetime depressive episodes within the rMDD sample. Given the role of this brain region for monitoring and evaluating decisions after the presentation of rewards (Tsujimoto et al., 2010), it may be the case that greater decision monitoring predicts greater vulnerability for MDD, perhaps due to linkages with rumination during reward outcomes (Koster, De Lissnyder, Derakshan, & De Raedt, 2011). It should be noted that there were no significant correlations between brain activation and profiles on the Ruminative Responses Scale (Nolen-Hoeksema, Morrow, & Fredrickson, 1993) in this rMDD sample, such effects may be evident only during active task conditions, though this interpretation is highly speculative.
Study limitations include a small sample size, the fact that two rMDD participants were receiving psychotherapy at the time of participation, and the fact that five rMDD participants had previously used psychotropic medications. Additionally, we recently reported that reward network dysfunction in MDD may be more pronounced in response to pleasant images rather than monetary rewards, and thus future studies should examine the effects of positive image reward in individuals with rMDD.
In summary, results are suggestive of reward network dysfunction in currently euthymic individuals with a history of MDD. Specifically, results indicate reward network hyperactivation during the anticipation of rewards and reward network hypoactivation during reward network outcomes. These results imply a double dissociation between reward network activity and the temporal phase of the reward response in rMDD, highlighting the importance of considering the chronometry of the reward response when evaluating reward network function related to MDD. More broadly, these findings suggest that aberrant frontostriatal response to rewards may represent a trait endophenotype for MDD, although future studies in other high risk groups, particularly first-degree relatives of MDD patients with no history of MDD, will be critical to establish this potential marker of MDD vulnerability.
Acknowledgments
Role of Funding
Assistance for this study was provided by the Neuroimaging Core of the Carolina Institute for Developmental Disabilities (P30 HD03110). This research was supported by grants from the NARSAD Young Investigator Program. Investigator effort was supported by NIMH K23 MH087754 to M. Smoski and NIMH K23 MH081285 to G. Dichter.
The authors thank Dr. Brian Knutson for kindly sharing the MID task, Josh Bizzell, Chris Petty, Allison Rittenberg, Stephanie Miller, John Anthony Richey, Anthony Devito, and Todd Harshbarger for assistance with image analysis, and MRI technologists Susan Music, Natalie Goutkin, and Luke Poole for assistance with data acquisition.
Footnotes
Though clearly the goal of neurobiologic research into the pathophysiology of MDD is to identify the causes of clinically depressed mood, the presence of sad mood states may actually impede the identification of linkages between brain endophenotypes and depression vulnerability because the neural correlates of sad mood and of MDD are not completely concordant.
This result (no brain areas with significantly decreased activation in the rMDD group, relative to the control group) remained even when unmasked results were examined.
Conflict of Interest
All authors declare that they have no conflicts of interest.
Contributors
GSD and MJS designed the study and wrote the protocol
GSD managed the literature searches and analyses
All authors undertook the statistical analysis
GSD wrote the first draft of the manuscript.
All authors contributed to and have approved the final manuscript.
Publisher's Disclaimer: This is a PDF file of an unedited manuscript that has been accepted for publication. As a service to our customers we are providing this early version of the manuscript. The manuscript will undergo copyediting, typesetting, and review of the resulting proof before it is published in its final citable form. Please note that during the production process errors may be discovered which could affect the content, and all legal disclaimers that apply to the journal pertain.
References
- Akert K, Hartmann-von Monakow K. Relationships of precentral premotor and prefrontal cortex to the mediodorsal and intralaminar nuclei of the monkey thalamus. Acta Neurobiol Exp (Wars) 1980;40(1):7–25. [PubMed] [Google Scholar]
- Alloy LB, Ambramson LY, Raniere D, Dyller IM. Research methods in adult psychopathology. In: Kendall PC, Butcher JN, Holmbeck GN, editors. Handbook of research methods in clinical psychology. 2. New York: Wiley; 1999. pp. 466–498. [Google Scholar]
- American Psychiatric Association. Diagnostic and statistical manual of mental disorders. 4. Washington, DC: 1994. DSM-IV. [Google Scholar]
- Baldacara L, Borgio JG, Lacerda AL, Jackowski AP. Cerebellum and psychiatric disorders. Rev Bras Psiquiatr. 2008;30(3):281–289. doi: 10.1590/s1516-44462008000300016. [DOI] [PubMed] [Google Scholar]
- Bechara A, Damasio H, Damasio AR. Emotion, decision making and the orbitofrontal cortex. Cereb Cortex. 2000;10(3):295–307. doi: 10.1093/cercor/10.3.295. [DOI] [PubMed] [Google Scholar]
- Beck AT, Steer RA, Brown GK. Manual for Beck Depression Inventory-II. San Antonio, TX: Psychological Corporation; 1996. [Google Scholar]
- Blair JR, Spreen O. Predicting premorbid IQ: A revision of the national adult reading test. The Clinical Neuropsychologist. 1989;3:129–136. [Google Scholar]
- de Lafuente V, Romo R. Neural correlate of subjective sensory experience gradually builds up across cortical areas. Proc Natl Acad Sci U S A. 2006;103(39):14266–14271. doi: 10.1073/pnas.0605826103. [DOI] [PMC free article] [PubMed] [Google Scholar]
- Deco G, Rolls ET. Decision-making and Weber’s law: a neurophysiological model. Eur J Neurosci. 2006;24(3):901–916. doi: 10.1111/j.1460-9568.2006.04940.x. [DOI] [PubMed] [Google Scholar]
- Dichter GS, Felder JN, Petty C, Bizzell J, Ernst M, Smoski MJ. The effects of psychotherapy on neural responses to rewards in major depression. Biol Psychiatry. 2009;66(9):886–897. doi: 10.1016/j.biopsych.2009.06.021. [DOI] [PMC free article] [PubMed] [Google Scholar]
- Etkin A, Egner T, Kalisch R. Emotional processing in anterior cingulate and medial prefrontal cortex. Trends Cogn Sci. 2011;15(2):85–93. doi: 10.1016/j.tics.2010.11.004. [DOI] [PMC free article] [PubMed] [Google Scholar]
- Farb NA, Anderson AK, Bloch RT, Segal ZV. Mood-Linked Responses in Medial Prefrontal Cortex Predict Relapse in Patients with Recurrent Unipolar Depression. Biol Psychiatry. 2011 doi: 10.1016/j.biopsych.2011.03.009. [DOI] [PMC free article] [PubMed] [Google Scholar]
- First MB, Spitzer RL, Gibbon M, Williams JBW. Structured Clinical Interview for DSM-IV Axis I Disorders (SCID), Clinician Version; Administration Booklet. American Psychiatric Press; Washington, D.C: 1996. [Google Scholar]
- Forbes EE, Christopher May J, Siegle GJ, Ladouceur CD, Ryan ND, Carter CS, Birmaher B, Axelson DA, Dahl RE. Reward-related decision-making in pediatric major depressive disorder: an fMRI study. Journal of Child Psychology and Psychiatry. 2006a;47(10):1031–1040. doi: 10.1111/j.1469-7610.2006.01673.x. [DOI] [PMC free article] [PubMed] [Google Scholar]
- Forbes EE, Christopher May J, Siegle GJ, Ladouceur CD, Ryan ND, Carter CS, Birmaher B, Axelson DA, Dahl RE. Reward-related decision-making in pediatric major depressive disorder: an fMRI study. J Child Psychol Psychiatry. 2006b;47(10):1031–1040. doi: 10.1111/j.1469-7610.2006.01673.x. [DOI] [PMC free article] [PubMed] [Google Scholar]
- Forbes EE, Hariri AR, Martin SL, Silk JS, Moyles DL, Fisher PM, Brown SM, Ryan ND, Birmaher B, Axelson DA, Dahl RE. Altered Striatal Activation Predicting Real-World Positive Affect in Adolescent Major Depressive Disorder. Am J Psychiatry. 2008 doi: 10.1176/appi.ajp.2008.07081336. [DOI] [PMC free article] [PubMed] [Google Scholar]
- Forbes EE, Hariri AR, Martin SL, Silk JS, Moyles DL, Fisher PM, Brown SM, Ryan ND, Birmaher B, Axelson DA, Dahl RE. Altered striatal activation predicting real-world positive affect in adolescent major depressive disorder. Am J Psychiatry. 2009;166(1):64–73. doi: 10.1176/appi.ajp.2008.07081336. [DOI] [PMC free article] [PubMed] [Google Scholar]
- Fusar-Poli P, Placentino A, Carletti F, Landi P, Allen P, Surguladze S, Benedetti F, Abbamonte M, Gasparotti R, Barale F, Perez J, McGuire P, Politi P. Functional atlas of emotional faces processing: a voxel-based meta-analysis of 105 functional magnetic resonance imaging studies. J Psychiatry Neurosci. 2009;34(6):418–432. [PMC free article] [PubMed] [Google Scholar]
- Goldapple K, Segal Z, Garson C, Lau M, Bieling P, Kennedy S, Mayberg H. Modulation of cortical-limbic pathways in major depression: treatment-specific effects of cognitive behavior therapy. Arch Gen Psychiatry. 2004;61(1):34–41. doi: 10.1001/archpsyc.61.1.34. [DOI] [PubMed] [Google Scholar]
- Haber SN, Calzavara R. The cortico-basal ganglia integrative network: the role of the thalamus. Brain Res Bull. 2009;78(2–3):69–74. doi: 10.1016/j.brainresbull.2008.09.013. [DOI] [PMC free article] [PubMed] [Google Scholar]
- Haber SN, Knutson B. The reward circuit: linking primate anatomy and human imaging. Neuropsychopharmacology. 2010;35(1):4–26. doi: 10.1038/npp.2009.129. [DOI] [PMC free article] [PubMed] [Google Scholar]
- Hollon SD, DeRubeis RJ, Shelton RC, Amsterdam JD, Salomon RM, O’Reardon JP, Lovett ML, Young PR, Haman KL, Freeman BB, Gallop R. Prevention of relapse following cognitive therapy vs medications in moderate to severe depression. Archives of General Psychiatry. 2005;62(4):417–422. doi: 10.1001/archpsyc.62.4.417. [DOI] [PubMed] [Google Scholar]
- Hooley JM, Gruber SA, Scott LA, Hiller JB, Yurgelun-Todd DA. Activation in dorsolateral prefrontal cortex in response to maternal criticism and praise in recovered depressed and healthy control participants. Biol Psychiatry. 2005;57(7):809–812. doi: 10.1016/j.biopsych.2005.01.012. [DOI] [PubMed] [Google Scholar]
- Hsu M, Bhatt M, Adolphs R, Tranel D, Camerer CF. Neural systems responding to degrees of uncertainty in human decision-making. Science. 2005;310(5754):1680–1683. doi: 10.1126/science.1115327. [DOI] [PubMed] [Google Scholar]
- Jenkinson M, Bannister P, Brady M, Smith S. Improved optimization for the robust and accurate linear registration and motion correction of brain images. Neuroimage. 2002;17(2):825–841. doi: 10.1016/s1053-8119(02)91132-8. [DOI] [PubMed] [Google Scholar]
- Jenkinson M, Smith S. A global optimisation method for robust affine registration of brain images. Med Image Anal. 2001;5(2):143–156. doi: 10.1016/s1361-8415(01)00036-6. [DOI] [PubMed] [Google Scholar]
- Kable JW, Glimcher PW. The neural correlates of subjective value during intertemporal choice. Nat Neurosci. 2007;10(12):1625–1633. doi: 10.1038/nn2007. [DOI] [PMC free article] [PubMed] [Google Scholar]
- Keedwell PA, Andrew C, Williams SC, Brammer MJ, Phillips ML. A double dissociation of ventromedial prefrontal cortical responses to sad and happy stimuli in depressed and healthy individuals. Biological Psychiatry. 2005a;58(6):495–503. doi: 10.1016/j.biopsych.2005.04.035. [DOI] [PubMed] [Google Scholar]
- Keedwell PA, Andrew C, Williams SC, Brammer MJ, Phillips ML. The neural correlates of anhedonia in major depressive disorder. Biological Psychiatry. 2005b;58(11):843–853. doi: 10.1016/j.biopsych.2005.05.019. [DOI] [PubMed] [Google Scholar]
- Kennedy SH, Evans KR, Kruger S, Mayberg HS, Meyer JH, McCann S, Arifuzzman AI, Houle S, Vaccarino FJ. Changes in regional brain glucose metabolism measured with positron emission tomography after paroxetine treatment of major depression. Am J Psychiatry. 2001;158(6):899–905. doi: 10.1176/appi.ajp.158.6.899. [DOI] [PubMed] [Google Scholar]
- Kennedy SH, Konarski JZ, Segal ZV, Lau MA, Bieling PJ, McIntyre RS, Mayberg HS. Differences in brain glucose metabolism between responders to CBT and venlafaxine in a 16-week randomized controlled trial. Am J Psychiatry. 2007;164(5):778–788. doi: 10.1176/ajp.2007.164.5.778. [DOI] [PubMed] [Google Scholar]
- Kerestes R, Ladouceur CD, Meda S, Nathan PJ, Blumberg HP, Maloney K, Ruf B, Saricicek A, Pearlson GD, Bhagwagar Z, Phillips ML. Abnormal prefrontal activity subserving attentional control of emotion in remitted depressed patients during a working memory task with emotional distracters. Psychol Med. 2011:1–12. doi: 10.1017/S0033291711001097. [DOI] [PubMed] [Google Scholar]
- Kim H, Shimojo S, O’Doherty JP. Is avoiding an aversive outcome rewarding? Neural substrates of avoidance learning in the human brain. PLoS Biol. 2006;4(8):e233. doi: 10.1371/journal.pbio.0040233. [DOI] [PMC free article] [PubMed] [Google Scholar]
- Knutson B, Bhanji JP, Cooney RE, Atlas LY, Gotlib IH. Neural responses to monetary incentives in major depression. Biol Psychiatry. 2008;63(7):686–692. doi: 10.1016/j.biopsych.2007.07.023. [DOI] [PMC free article] [PubMed] [Google Scholar]
- Knutson B, Rick S, Wimmer GE, Prelec D, Loewenstein G. Neural predictors of purchases. Neuron. 2007;53(1):147–156. doi: 10.1016/j.neuron.2006.11.010. [DOI] [PMC free article] [PubMed] [Google Scholar]
- Knutson B, Westdorp A, Kaiser E, Hommer D. FMRI visualization of brain activity during a monetary incentive delay task. Neuroimage. 2000;12(1):20–27. doi: 10.1006/nimg.2000.0593. [DOI] [PubMed] [Google Scholar]
- Koster EH, De Lissnyder E, Derakshan N, De Raedt R. Understanding depressive rumination from a cognitive science perspective: the impaired disengagement hypothesis. Clin Psychol Rev. 2011;31(1):138–145. doi: 10.1016/j.cpr.2010.08.005. [DOI] [PubMed] [Google Scholar]
- Krebs RM, Boehler CN, Roberts KC, Song AW, Woldorff MG. The Involvement of the Dopaminergic Midbrain and Cortico-Striatal-Thalamic Circuits in the Integration of Reward Prospect and Attentional Task Demands. Cereb Cortex. 2011 doi: 10.1093/cercor/bhr134. [DOI] [PMC free article] [PubMed] [Google Scholar]
- Kumari V, Mitterschiffthaler MT, Teasdale JD, Malhi GS, Brown RG, Giampietro V, Brammer MJ, Poon L, Simmons A, Williams SC, Checkley SA, Sharma T. Neural abnormalities during cognitive generation of affect in treatment-resistant depression. Biological Psychiatry. 2003;54(8):777–791. doi: 10.1016/s0006-3223(02)01785-7. [DOI] [PubMed] [Google Scholar]
- Lieberman MD, Cunningham WA. Type I and Type II error concerns in fMRI research: Re-balancing the scale. SCAN. 2009;4:423–428. doi: 10.1093/scan/nsp052. [DOI] [PMC free article] [PubMed] [Google Scholar]
- Liotti M, Mayberg HS, McGinnis S, Brannan SL, Jerabek P. Unmasking disease-specific cerebral blood flow abnormalities: mood challenge in patients with remitted unipolar depression. Am J Psychiatry. 2002;159(11):1830–1840. doi: 10.1176/appi.ajp.159.11.1830. [DOI] [PubMed] [Google Scholar]
- Liu X, Hairston J, Schrier M, Fan J. Common and distinct networks underlying reward valence and processing stages: a meta-analysis of functional neuroimaging studies. Neurosci Biobehav Rev. 2011;35(5):1219–1236. doi: 10.1016/j.neubiorev.2010.12.012. [DOI] [PMC free article] [PubMed] [Google Scholar]
- McCabe C, Cowen PJ, Harmer CJ. Neural representation of reward in recovered depressed patients. Psychopharmacology (Berl) 2009;205(4):667–677. doi: 10.1007/s00213-009-1573-9. [DOI] [PMC free article] [PubMed] [Google Scholar]
- McCabe C, Mishor Z, Cowen PJ, Harmer CJ. Diminished neural processing of aversive and rewarding stimuli during selective serotonin reuptake inhibitor treatment. Biol Psychiatry. 2010;67(5):439–445. doi: 10.1016/j.biopsych.2009.11.001. [DOI] [PMC free article] [PubMed] [Google Scholar]
- Mednick SA, McNeil TF. Current methodology in research on the etiology of schizophrenia: serious difficulties which suggest the use of the high-risk-group method. Psychol Bull. 1968;70(6):681–693. doi: 10.1037/h0026836. [DOI] [PubMed] [Google Scholar]
- Mitterschiffthaler MT, Kumari V, Malhi GS, Brown RG, Giampietro VP, Brammer MJ, Suckling J, Poon L, Simmons A, Andrew C, Sharma T. Neural response to pleasant stimuli in anhedonia: an fMRI study. Neuroreport. 2003;14(2):177–182. doi: 10.1097/00001756-200302100-00003. [DOI] [PubMed] [Google Scholar]
- Nolen-Hoeksema S, Morrow J, Fredrickson BL. Response styles and the duration of episodes of depressed mood. J Abnorm Psychol. 1993;102(1):20–28. doi: 10.1037//0021-843x.102.1.20. [DOI] [PubMed] [Google Scholar]
- Okada G, Okamoto Y, Yamashita H, Ueda K, Takami H, Yamawaki S. Attenuated prefrontal activation during a verbal fluency task in remitted major depression. Psychiatry Clin Neurosci. 2009;63(3):423–425. doi: 10.1111/j.1440-1819.2009.01952.x. [DOI] [PubMed] [Google Scholar]
- Paelecke-Habermann Y, Pohl J, Leplow B. Attention and executive functions in remitted major depression patients. J Affect Disord. 2005;89(1–3):125–135. doi: 10.1016/j.jad.2005.09.006. [DOI] [PubMed] [Google Scholar]
- Pail G, Scharinger C, Kalcher K, Huf W, Boubela R, Hartinger B, Windischberger C, Filzmoser P, Moser E, Kasper S, Pezawas L. Remitted major depression is related to increased functional coupling between ventral striatum and cortical regions in resting state fMRI. European Psychiatry. 2011;26(P02–352):948. [Google Scholar]
- Paulus MP, Stein MB. An insular view of anxiety. Biol Psychiatry. 2006;60(4):383–387. doi: 10.1016/j.biopsych.2006.03.042. [DOI] [PubMed] [Google Scholar]
- Peterson BS, Weissman MM. A brain-based endophenotype for major depressive disorder. Annu Rev Med. 2011;62:461–474. doi: 10.1146/annurev-med-010510-095632. [DOI] [PMC free article] [PubMed] [Google Scholar]
- Rolls ET. Philosophical Transactions of the Royal Society of London - Series B: Biological Sciences. Vol. 351. 1996. The orbitofrontal cortex; pp. 1433–1443. [DOI] [PubMed] [Google Scholar]
- Samanez-Larkin GR, Hollon NG, Carstensen LL, Knutson B. Individual differences in insular sensitivity during loss anticipation predict avoidance learning. Psychol Sci. 2008;19(4):320–323. doi: 10.1111/j.1467-9280.2008.02087.x. [DOI] [PMC free article] [PubMed] [Google Scholar]
- Santesso DL, Steele KT, Bogdan R, Holmes AJ, Deveney CM, Meites TM, Pizzagalli DA. Enhanced negative feedback responses in remitted depression. Neuroreport. 2008;19(10):1045–1048. doi: 10.1097/WNR.0b013e3283036e73. [DOI] [PMC free article] [PubMed] [Google Scholar]
- Schaefer HS, Putnam KM, Benca RM, Davidson RJ. Event-related functional magnetic resonance imaging measures of neural activity to positive social stimuli in pre- and post-treatment depression. Biological Psychiatry. 2006;60(9):974–986. doi: 10.1016/j.biopsych.2006.03.024. [DOI] [PubMed] [Google Scholar]
- Schmahmann JD. The role of the cerebellum in cognition and emotion: personal reflections since 1982 on the dysmetria of thought hypothesis, and its historical evolution from theory to therapy. Neuropsychol Rev. 2010;20(3):236–260. doi: 10.1007/s11065-010-9142-x. [DOI] [PubMed] [Google Scholar]
- Schoning S, Zwitserlood P, Engelien A, Behnken A, Kugel H, Schiffbauer H, Lipina K, Pachur C, Kersting A, Dannlowski U, Baune BT, Zwanzger P, Reker T, Heindel W, Arolt V, Konrad C. Working-memory fMRI reveals cingulate hyperactivation in euthymic major depression. Hum Brain Mapp. 2009;30(9):2746–2756. doi: 10.1002/hbm.20702. [DOI] [PMC free article] [PubMed] [Google Scholar]
- Smith SM. Fast robust automated brain extraction. Human Brain Mapping. 2002;17(3):143–155. doi: 10.1002/hbm.10062. [DOI] [PMC free article] [PubMed] [Google Scholar]
- Smith SM, Jenkinson M, Woolrich MW, Beckmann CF, Behrens TEJ, Johansen-Berg H, Bannister PR, De Luca M, Drobnjak I, Flitney DE, Niazy RK, Saunders J, Vickers J, Zhang Y, De Stefano N, Brady JM, Matthews PM. Advances in functional and structural MR image analysis and implementation as FSL. Neuroimage. 2004;23(Suppl 1):S208–219. doi: 10.1016/j.neuroimage.2004.07.051. [DOI] [PubMed] [Google Scholar]
- Smoski MJ, Felder J, Bizzell J, Green SR, Ernst M, Lynch TR, Dichter GS. fMRI of alterations in reward selection, anticipation, and feedback in major depressive disorder. J Affect Disord. 2009;118(1–3):69–78. doi: 10.1016/j.jad.2009.01.034. [DOI] [PMC free article] [PubMed] [Google Scholar]
- Smoski MJ, Rittenberg A, Dichter GS. Major depressive disorder is characterized by greater reward network activation to monetary than pleasant image rewards. Psychiatry Research: Neuroimaging. doi: 10.1016/j.pscychresns.2011.06.012. in press. [DOI] [PMC free article] [PubMed] [Google Scholar]
- Tsujimoto S, Genovesio A, Wise SP. Evaluating self-generated decisions in frontal pole cortex of monkeys. Nat Neurosci. 2010;13(1):120–126. doi: 10.1038/nn.2453. [DOI] [PMC free article] [PubMed] [Google Scholar]
- Tsujimoto S, Genovesio A, Wise SP. Frontal pole cortex: encoding ends at the end of the endbrain. Trends Cogn Sci. 2011;15(4):169–176. doi: 10.1016/j.tics.2011.02.001. [DOI] [PubMed] [Google Scholar]
- Wallis JD, Kennerley SW. Heterogeneous reward signals in prefrontal cortex. Curr Opin Neurobiol. 2010;20(2):191–198. doi: 10.1016/j.conb.2010.02.009. [DOI] [PMC free article] [PubMed] [Google Scholar]
- Wang L, Krishnan KR, Steffens DC, Potter GG, Dolcos F, McCarthy G. Depressive state- and disease-related alterations in neural responses to affective and executive challenges in geriatric depression. Am J Psychiatry. 2008;165(7):863–871. doi: 10.1176/appi.ajp.2008.07101590. [DOI] [PubMed] [Google Scholar]
- Woolrich MW, Ripley BD, Brady M, Smith SM. Temporal autocorrelation in univariate linear modeling of FMRI data. Neuroimage. 2001;14(6):1370–1386. doi: 10.1006/nimg.2001.0931. [DOI] [PubMed] [Google Scholar]
- Yuan Y, Zhang Z, Bai F, Yu H, Shi Y, Qian Y, Liu W, You J, Zhang X, Liu Z. Abnormal neural activity in the patients with remitted geriatric depression: a resting-state functional magnetic resonance imaging study. J Affect Disord. 2008;111(2–3):145–152. doi: 10.1016/j.jad.2008.02.016. [DOI] [PubMed] [Google Scholar]