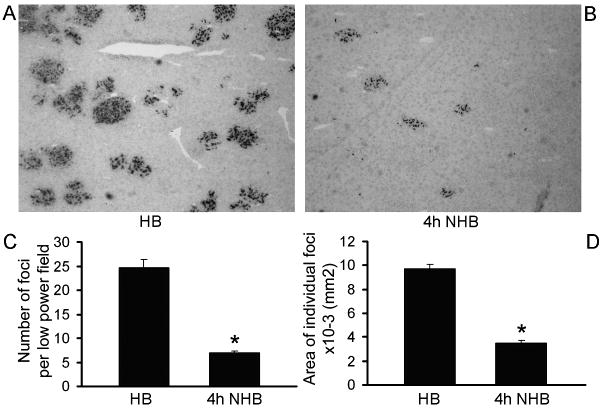
Figure 4. Proliferation of transplanted hepatocytes from HB and NHB donors.
(A and B) DPPIV+ transplanted cells in liver from HB and NHB donors 4h after death. Original magnification ×400; methylgreen counterstain. (C and D) Morphometric quantitation of transplanted cell foci (C), and area occupied by individual transplanted cell foci (n=3-4 recipients from each of 3 donors). NHB hepatocytes produced fewer transplanted cell foci and area occupied by these transplanted cells was smaller. Asterisks, p<0.05 versus HB donor hepatocytes, Mann-Whitney rank sum tests.

