Abstract
Surface-induced biomineralization represents an effective way to immobilize DNA molecules onto biomaterial surfaces for introducing DNA into cells in contact with or in an approximate distance to biomaterial surfaces. Our previous studies have investigated how the composition of mineralizing solutions affects the composition and pH responsiveness of nanocomposites and thus gene transfer efficiency in different cell types. In this study, we investigated how the functional groups of a biomaterial surface would affect the induction and crystallographic properties of nanocomposites and thus the gene transfer efficiency. Self-assembled monolayers (SAMs) with different terminus were used to control the functional groups of a surface. We demonstrated that the induction of DNA-doped nanocomposites depended on the surface functional groups, which is consistent with previous studies. The crystallographic properties did not vary significantly with the functional groups. DNA-doped nanocomposites induced by different surface functional groups resulted in different cellular uptake of DNA and thus gene transfer efficiency. The differential cellular uptake may be attributed to the interactions between nanocomposites and functional groups. The weaker inducer resulted in higher cellular uptake thus higher gene transfer efficiency. Together with others and our previous studies, our current results suggest that surface-mediated gene transfer by DNA-doped nanocomposites can be modulated through both mineralizing solutions and surface chemistries.
Keywords: Tissue engineering, Gene therapy, Surface-mediated gene delivery, Nanocomposites
1. Introduction
Biomineralization is a naturally controlled process that assembles nano- or micro-scale inorganic structures for living organisms. The resulting highly-organized structures resemble hard tissues in the human body and have been adapted to two- or three-dimensional biomaterial matrices for bone tissue engineering[1-4]. Matrices with mineral coatings enhance bone bonding on the implant surfaces, inhibit resorption of the surrounding bone and promote the attachment and proliferation of cells[5-9]. Previously, others and we have shown that DNA can be doped into surface-induced biominerals during the process of biomineralization; we termed these structures DNA-doped nanocomposites. We have demonstrated that these nanocomposites can deliver DNA into a wide range of cells[10, 11], and the efficiency of gene transfer can be tuned by manipulating the composition of mineralizing solutions. This approach has great potential in building DNA delivery into tissue engineering constructs for further mediating cellular functions[12, 13].
In order for mineralization to occur, the solution must be supersaturated with respect to the precipitating mineral phases[14]. Extensive studies have demonstrated that the nucleation and growth of mineral phases can be precisely controlled not only by the composition of supersaturated aqueous solutions but also by various biological macromolecules[15, 16]. These macromolecules are acidic in nature and usually consist of specific functional groups, such as SO -3[17], COO-[18], H2PO -4[19] and OH[20]. All of these anionic groups initiate crystal nucleation and growth. The relative ability to induce apatite formation by anionic groups is in the order of: H2PO4-SO3->COO->OH[21-24]. However, the induction of DNA-doped nanocomposites has been mainly studied on poorly controlled surfaces with OH- and/or COO- functional groups. Three key questions remain to be addressed: first, how surface functional groups affect the induction of DNA-doped nanocomposites? Second, how surface functional groups affect the crystallographic properties of DNA-doped nanocomposites? Last, how surface functional groups affect the detachment of minerals from the surface and the gene transfer efficiency mediated by DNA-doped nanocomposites?
Self-assembled monolayers (SAM) formed from long-chain alkanethiols [HS(CH2)nX, n > 10, X = a functional group] are well-packed and oriented. They are tethered to the surface through the sulfur atom, which forms a covalent bond with the gold surface. The polyethylene chains are all-trans and tilted 20° to 30° from the normal to the surface; and the terminal group, X, is the predominant group exposed to the monolayer-liquid interface [25]. SAMs have been utilized to modify the surface of materials [14, 26-28]. For surface-induced biomineralization, they provide structural and molecular control over nucleation and crystal growth. The density of nucleation, size and orientation of crystals depend on the terminal groups[15, 19, 21, 22, 29].
In this study, SAMs with different terminal groups were used to induce DNA-doped nanocomposites to address the aforementioned questions. We demonstrate that the induction of DNA-doped nanocomposites were dependent on the terminal groups. As a result, both cellular DNA uptake and trans-gene expression were influenced by terminal groups of SAMs.
2. Materials and methods
2.1. Preparation of gold substrates
15-mm glass cover slips were cleaned sequentially in toluene, acetone, and ethanol for 5 min each in a water bath sonicator. The cover slips were then immersed in Piranha solution (H2SO4 (95 ~98%):H2O2 (30%)=7:3 (v:v)) at 85°C for another 5 min. The cover slips were rinsed with Milli-Q water and dried under a stream of air. The cleaned glass cover slips were coated with 2 nm of chromium and then with 50 nm of gold using an electron beam evaporator (Center for Nanotechnology, University of Washington).
2.2. Preparation of SAMs of alkanethiols on gold substrates
1-hexadecanethiol, 16-mercaptohexadecanoic acid, 11-mercapto-1-undecanol and sodium 3-mercapto-1-propanesulfonate were purchased from Sigma. SAMs were formed by immersing gold substrates to 1 mM ethanol solution of alkanethiols for 24 h. Then the substrates were washed with 100% ethanol and dried under a stream of argon gas. Gold substrates with SAMs were immediately used for the mineralization.
2.3. Static contact angle measurement of water on SAMs on gold substrates
The wetting behaviors of the SAMs with various terminal alkanethiol groups were quantified using static contact angle measurement. 4 μl Milli-Q water was placed on the gold substrates modified with SAMs of alkanethiols. The static contact angle was measured using a Rame Hart Contact Angle Goniometer Model 190 (Rame Hart; Netcong, NJ). The measurement was carried out at room temperature. Three to five regions were measured.
2.4. Surface-Enhanced Raman Spectroscopy (SERS) analysis of SAMs on gold substrates
SERS was used to confirm the presence of SAMs on gold substrates. The enhanced Raman signals of SAMs were acquired by forming a sandwich structure of gold substrate-SAMs-gold nanoshells. The SAMs were formed on gold substrates as described above. Then, home-made gold nanoshells (120 nm silica core and 25 nm gold shell) were deposited on top of the SAMs at the concentration of 9×10⁸ nanoshells/cm2. SERS spectra were acquired on a Renishaw InVia Raman spectroscope attached to a Leica DMLM upright microscope (Center for Nanotechnology, University of Washington). The samples were excited with a 785 nm laser. Back scattered Raman signals were collected through a 50 × objective (N.A.=0.75, Leica). The acquisition time of each SERS spectrum was 10 s. All of the spectra were obtained at room temperature.
2.5. Preparation of surface-induced DNA-doped nanocomposites
Gold substrates with SAMs of alkanethiols were placed in a well of 24-well tissue culture plate (BD Biosciences; San Jose, CA). One milliliter of mineralizing solution (CaCl2: 2.5 mM, KH2PO4: 1 mM, NaCl: 141 mM, KCl: 4 mM, NaHCO3: 4.2 mM) was mixed with 10 μl DNA (100 μg/ml gWIZ Beta-gal (Aldevron; Fargo, ND) encoding β-galactosidase (β-gal) in 10 mM Tris-EDTA solution. The pH of the resulting mixture was at 7.4. The mixtures were added to each well of a 24-well tissue culture plate. The mineralization was conducted at 37 °C in an incubator with controlled humidity for an indicated period of time. When gold substrates were present, few nanocomposites were formed directly on tissue culture plates.
2.6. X-Ray diffraction (XRD) of surface-induced nanocomposites
The crystallographic properties of the DNA-doped nanocomposites were examined with a Bruker D8 Discover XRD with General Area Detector Diffraction Systems (GADDS) using Cu-Kα radiation (λ=1.54Å) (Center for Nanotechnology, University of Washington). The diffractometer was operated at 40 kV and 120 mA. The focal distance between the lenses and sample surface was 15 mm, and the sample oscillation amplitude was 1 mm. The acquisition time was 120 s per GADDS frame.
An empirical equation was used to determine the crystallinity XC:
| (1) |
where KA is a constant set at 0.24, and B1/2 is is the full width of the peak at half intensity of (002) reflection in (degree-2θ). The size of crystals was calculated by using Scherrer's equation:
| (2) |
where d is the crystal size, λ is the wavelength of Cu-Kα radiation (λ=1.54Å), and k is the broadening constant set at 0.9.
2.7. Morphology and density of surface-induced DNA-doped nanocomposites
Scanning electron microscope (SEM) was used to examine the morphology of surface-induced DNA-doped nanocomposites. The samples were sputter-coated with 12 nm of platinum using a SPI Sputter™ Sputter Coater (Structure Probe, Inc.; West Chester, PA) and were analyzed with a JEOL 7000 SEM with a beam voltage of 10 kV (Electron Microscopy Center, University of Washington). The density of nanocomposites was determined by counting the number of nanocomposites in an area of 10, 000 nm2. Three regions were randomly chosen and counted. The density of nanocomposites was expressed as the mean of the number of nanocomposites/10, 000 nm2 ± s. e.
2.8. Cell culture
Human embryonic kidney cells, HEK-293, were cultured in Dulbecco's Modified Eagle Media (DMEM), supplemented with 10% fetal bovine serum (FBS), 2 mM L-glutamine, 100 units-100 μg/ml Peninicilin-Streptomycin and 25 μM blasticidin. The cells were maintained in an incubator at 37 °C and 5% CO2.
2.9. Gene transfer of cells cultured on DNA-doped nanocomposites
1 × 10⁵ cells in 500 μl tissue culture medium were directly plated on surfaces coated with DNA-doped nanocomposites grown on SAMs. Cells were incubated at 37 °C and 5% CO2. A commercial transfection reagent, Lipofectamine 2000™ (Invitrogen; Carlsbad, CA), was used as a positive control. Briefly, 50 μl DMEM containing 1 μg of DNA and pre-incubated (5 min, room temperature) 50 μl DMEM containing 2 μl of Lipofectamine™ 2000 were mixed together. The mixture was incubated at room temperature for 20 min. Then the lipoplexes mixtures were added to the cells in 500 μl serum-free DMEM. 6 h later, the medium was replaced with 500 μl of complete tissue culture medium and the cells were incubated at 37 °C and 5% CO2.
2.10. Determination of gene transfer efficiency
36 h post transfection, the media was removed and samples were then lysed with 150 μl of a solution containing 10 μM 2-mercaptonethanol, 9 mM MgCl2 and 0.1% triton X-100 in Dulbecco's Phosphate-Buffered Saline (DPBS) for 15 min. Then, three freeze-thaw cycles between -80 °C and 37 °C were performed to ensure complete release of proteins from cells. 50 μl of the lysed cell solution was mixed with 50 μl solution containing 0.15 mM chlorophenol red-β-d-galactoside (CPRG), 10 μM 2-mercaptonethanol, 9 mM MgCl2 and 0.1% triton X-100 in D-PBS and incubated at 37 °C and 5% CO2 for 30 min. The absorption was measured at 570 nm using a SpectraMax M5 microplate reader (Molecular Devices; Sunnyvale, CA). The quantity of β-gal produced by the cells was determined by using a standard curve constructed with known concentrations of β-gal. Gene transfer efficiency was expressed as ng of β-gal per mg of total protein. Total protein was measured using the Coomassie protein assay (Biorad; Hercules, CA). Briefly, 5 μl of the lysed cell solution was diluted with 5 μl DPBS and then mixed with 200 μl of Coomassie solution. The absorption at 595 nm was determined with a microplate reader. The quantity of protein was determined by using a standard curve with known concentration of bovine serum albumin protein.
2.11. Quantification of DNA uptake by flow cytometry
0.5 μg FITC-labeled DNA (2.7 kb) (Mirus Bio; Madison, WI) was immobilized in surface-induced nanocomposites as described above. Cells were cultured on surfaces deposited with DNA-doped nanocomposite. 24 h later, cells were washed with 0.25 ml Hank's Balanced Salt Solutions (HBSS). Cells were detached using 250 μl of trypsin-EDTA (0.1% Trypsin, 0.4% EDTA·4Na) at 37 °C for 5 min. Cells were then washed twice with FACS (1% FBS in DPBS) buffer and analyzed by flow cytometry immediately using a BD FACScan2 (Cell Analysis Facility, Department of Immunology, University of Washington). Trypan blue was used to quench the fluorescence associated with the cell surface. The data was analyzed with FlowJo (Treestar; Ashland, OR). Cells were gated based on FITC-labeled DNA. The geometric mean and percentage of fluorescence intensity (GMFI) of cells containing FITC-labeled DNA was determined. Since the gene transfer efficiency (mg β-gal/mg total protein) was contributed by DNA taken up per cell, the uptake of DNA by cells was quantified by the GMFI of cells containing FITC-labeled DNA.
2.12. Statistical analysis
Triplicate samples were included in all the experiments. The values shown are the mean of triplicates. All the experiments were repeated two to three times. The standard deviation is within 5% if not mentioned. Two-tailed Student's t-test was used to compare the difference between experimental groups. p < 0.05 was considered as statistically different.
3. Results and discussion
3.1. Characterization of SAMs
SAMs on gold substrates were formed from alkanethiols with OH, SO3Na, COOH, or CH3 terminal groups or a mixture of given ratios of alkanethiols with COOH and CH3 terminal groups. The wettability of SAMs with various terminal alkanethiol groups on gold surfaces was quantified using static contact angle measurement (Table 1). The CH3-terminated SAMs yielded hydrophobic surfaces, with the static contact angle of θ=99.43±0.64°. The COOH-, OH-, and SO3Na-terminated SAMs resulted in hydrophilic surfaces with contact angles of θ=31.6±3.2°, θ=33.8±1.9° and θ=46.2±2.8°, respectively. Our results were consistent with previous studies[28, 30-33]. However, the contact angles of COOH- and OH-terminated SAMs reported by Laibinis, et al were less than 15°[25]. The inconsistency between different studies may be originated from the gold substrates used for each study. The contact angle of the mixed COOH-/CH3-terminated SAMs decreased from 72.3±1.8° (COOH-/ CH3-=1:1) to 41.8±2.7° (COOH-/ CH3-=5:1) and further to 35.8±1.4° (COOH-/ CH3-=10:1) as the fraction of COOH-terminated alkanethiol increased.
Table 1.
Static contact angle of water on SAMs on gold substrates with various terminal groups
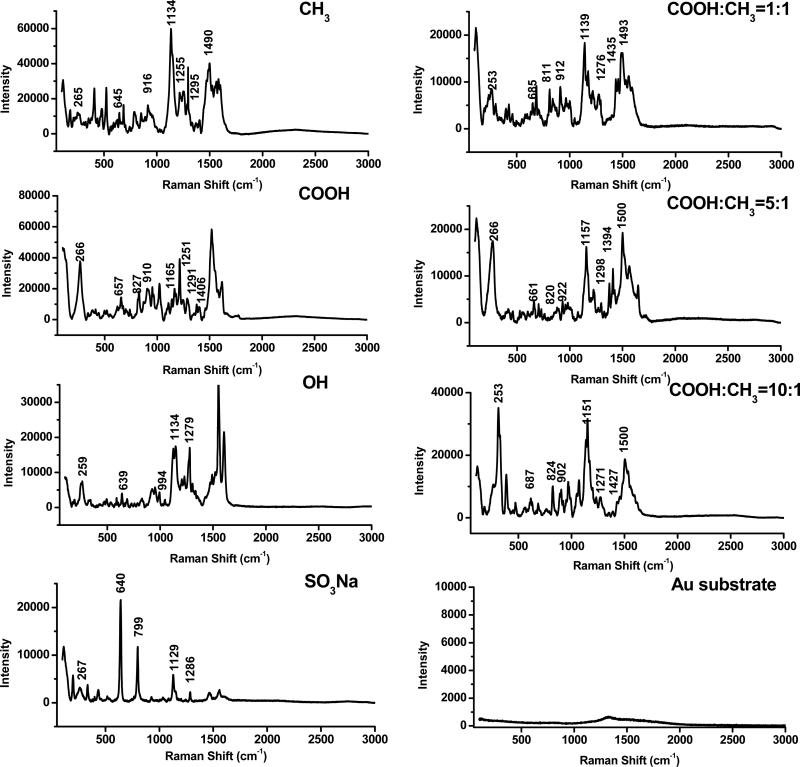
SERS was used to confirm the presence of SAMs on gold surfaces. The enhanced Raman signals of SAMs were acquired by forming a sandwich structure consisting of the gold substrate, SAMs, and gold nanoshells. As shown in Figure 1 and Table 2, all of spectra contained the Au-S stretching (253-267 cm-1)[34], C2-S1 vibration (639-687 cm-1)[35], C-H bending (1134-1165 cm-1)[36] and CH2 wagging (1291-1298 cm-1)[34] bands, which confirmed the presence of alkanethiols on the gold substrates. Different SAMs exhibited respective characteristic Raman shifts. For CH3-terminated alkanethiol, the characteristic bands were the CH2 rocking at 916 cm-1 [34] and C-C stretching at 1490 cm-1[36]. The characteristic bands for COOH-terminated alkanethiol were observed at 827 and 1406 cm-1, which were assigned to the C-COOH stretching vibration and COO- bending[37], respectively. For OH-terminated alkanethiol, the characteristic band was the C-C-O stretching at 994 cm-1,[38]. For SO3Na-terminated alkanethiol, the characteristic band was at 799 cm-1, which was the C-S bond in -CH2SO3Na[35]. For the SAMs with mixed alkanethiols, the characteristic bands for both COOH- and OH- groups were detected, including the C-COOH stretching vibration at 811-824 cm-1 and the C-C stretching at 1493-1500 cm-1. We did observe that both bands of the 1:1 ratio were shifted compared to other two ratios. The characterizations of SAMs with various terminal groups by static contact angle and SERS demonstrated that SAMs were successfully grafted on the gold surfaces.
Figure 1.
SERS spectra of SAMs with various terminal groups on gold substrates. The spectrum of bare gold substrates was used as a control.
Table 2.
Peak assignments (cm-1) for the SERS spectra of SAMs on gold substrates with various terminal groups
| Raman Shift (cm-1) |
Peak assignments | ||||||
|---|---|---|---|---|---|---|---|
| CH3 | COOH | OH | SO3Na | COOH:CH3 (1:1) | COOH:CH3 (5:1) | COOH:CH3 (10:1) | |
| 265 | 266 | 259 | 267 | 253 | 266 | 253 | Au-S stretching[34] |
| 645 | 657 | 639 | 640 | 685 | 661 | 687 | (C2-S1) vibration[35] |
| 799 | C-S bond in -CH2SO3Na[35] | ||||||
| 827 | 811 | 820 | 824 | C-COOH stretching vibration[37] | |||
| 916 | 910 | 912 | 922 | 902 | CH2 rocking[34] | ||
| 994 | C-C-O stretching[38] | ||||||
| 1134 | 1165 | 1134 | 1129 | 1139 | 1157 | 1151 | C-H bending [36] |
| 1255 | 1251 | C-C stretching[36] | |||||
| 1295 | 1292 | 1279 | 1286 | 1276 | 1298 | 1271 | CH2 wagging[34] |
| 1406 | 1435 | 1394 | 1427 | COO-bending[37] | |||
| 1490 | 1493 | 1500 | 1500 | C-C stretching[36] | |||
3.2. Induction of nanocomposites and kinetics of DNA deposition
A library of mineralizing solutions based on the simulated body fluid (SBF) have been developed to induce nanocomposites in our previous studies[10, 11]. We have shown that the nanocomposites induced by mineralizing solution formulation G (CaCl2: 2.5 mM, KH2PO4: 1 mM, NaCl: 141 mM, KCl: 4 mM, NaHCO3: 4.2 mM) result in high gene transfer efficiency in most cell types when they are induced on polystyrene surfaces[11]. Therefore, we initially chose this formulation to induce nanocomposites on SAMs. Compared to SBF, this mineralizing solution does not contain Mg2+.
The ability of inducing mineralization is dependent on the terminal functional groups[21-23]. The growth of nanocomposites on different SAMs was monitored up to 24 h. After 8 h, the surface was coated with dense nanocomposites regardless of functional groups of SAMs. The density of nanocomposites on SAMs was quantified by counting the number of nanocomposites per unit area (Table 3). To be able to distinguish nanocomposites from each other, the mineralization proceeded only for 4 h. The density of nanocomposites on SAMs was in the order of SO3Na-SAM > COOH-SAM > CH3-, OH-, Au-SAMs. The density of nanocomposites on the mixed SAMs of COOH and CH3 alkanethiols decreased as more CH3 alkanethiol was present. The crystal growth is shown to be completely inhibited on CH3-terminated SAMs by using SBF[21]. However, it has also been demonstrated that crystallization of calcium carbonate and hydroxyapatite on CH3-terminated SAMs is reduced but not completely inhibited[22, 23], which agree well with our observations. The mineralizing solution used in this study lacked magnesium compared to SBF. The presence of magnesium in SBF could potentially further inhibit mineralization, which may explain that crystal growth was completely inhibited on CH3-terminated SAMs by using SBF but not by mineralizing solutions without magnesium as in this study.
Table 3.
Density of the DNA-doped nanocomposites induced on SAMs with various terminal groups after 4 h mineralization.
| Terminal group | Particles/10000nm2 |
|---|---|
| CH3 | 2± 1 |
| COOH | 39± 6 |
| OH | 1± 1 |
| SO3Na | 50± 5 |
| COOH:CH3 = 10:1 | 40± 3 |
| COOH:CH3 = 5:1 | 33± 1 |
| COOH:CH3 = 1:1 | 28± 2 |
| Au | 2± 1 |
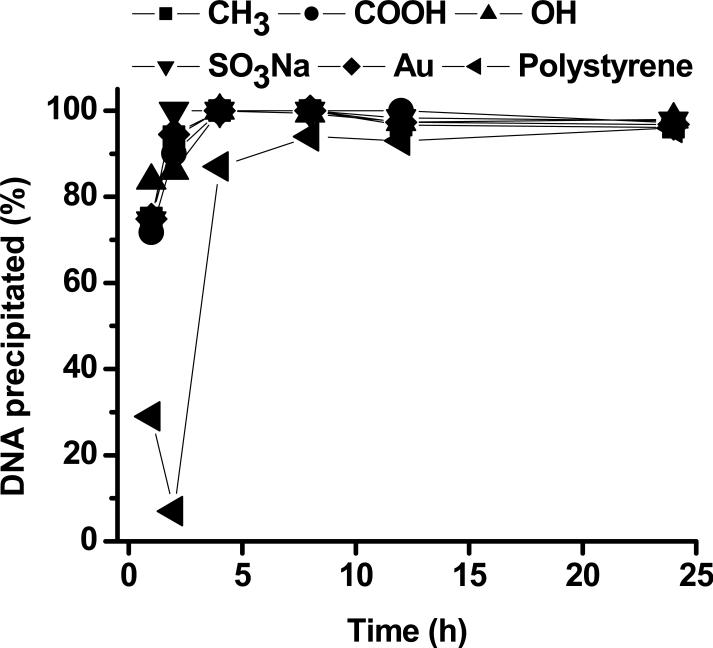
The kinetics of DNA deposition was examined for up to 24 h (Figure 2). Compared to cell culture-treated polystyrene surface, DNA was precipitated at a higher rate on SAMs. There was no significant difference in the kinetics of DNA deposition between SAMs with different terminal groups. 100% of DNA was incorporated into minerals grown on the SAMs after 4 h mineralization.
Figure 2.
The kinetics of DNA precipitation.
3.3. Morphology of surface-induced nanocomposites
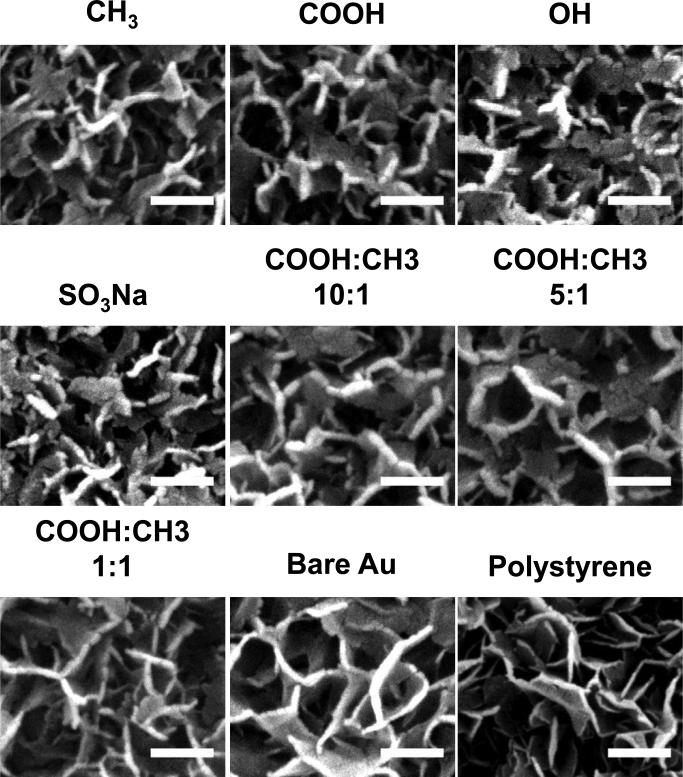
The morphology of the surface-induced nanocomposites formed on SAMs was examined by SEM. As shown in Figure 3, nanocomposites with “plate-like” morphology were induced. The nanocomposites formed on SAMs exhibited thicker “plate-like” structures compared to the ones formed on polystyrene surfaces. The morphological difference between nanocomposites formed on all the SAMs was not distinct from each other based on micrographs of SEM.
Figure 3.
SEM images of surface-induced nanocomposites formed on SAMs with various terminal groups. The mineralization was conducted for 24 h. The nanocomposites formed on unmodified gold surface (Au) and polystyrene surface (PS) were used for comparison. The scale bar is 200 nm.
3.4. Crystal structure and crystallinity of surface-induced nanocomposites
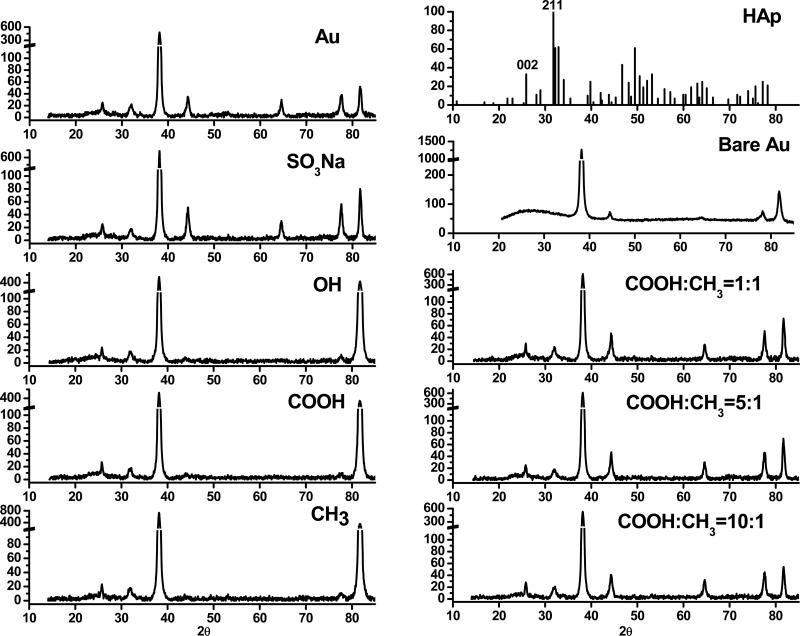
The crystal structure of the surface-induced nanocomposites was examined by X-ray diffraction (XRD) (Figure 4). All nanocomposites consisted of hydroxyapatite (HAp), which is the most stable phase of calcium phosphate minerals. Compared to the standard XRD spectrum of HAp, the predominant crystallographic orientations were at 25.9° (002) and 31.8° (211) regardless of the type of SAMs where nanocomposites were derived from. The diffraction of gold substrate at 38.3° (111), 44.5° (200), 78.2° (311) and 81.8° (222) were detected. No diffractions were detected from SAMs. The crystallinity (xc) and crystallite size were similar for nanocomposites grown on different SAMs. The crystallinity was 38 ± 5% and the crystallite size was 24 ± 2 nm.
Figure 4.
XRD patterns of surface-induced nanocomposites formed on SAMs with various terminal groups. The mineralization was conducted for 7 d. The standard XRD pattern of hydroxyapatite (HAp) and bare gold substrate used for comparison. The mineralization was conducted for 7 d so that the film of surface-induced nanocomposites can be sufficiently thick for XRD analysis.
3.5. Cellular uptake of DNA mediated by surface-induced nanocomposites
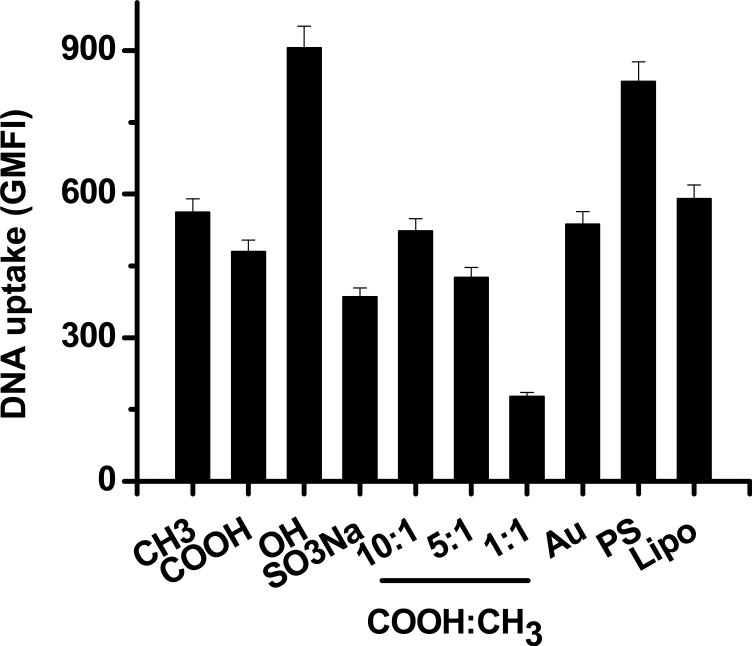
Nanocomposites induced on SAMs of the four single alkanethiols resulted in different intracellular DNA level, in the order of OH > CH3 > COOH > SO3Na (Figure 5, Figure S1) in HEK-293 cells. This order inversely corresponded with the ability of each terminal group to induce the nucleation and the rate of mineral growth on SAMs with different terminal groups[22] (Table 3). This implies that nanocomposites on the poor inducers such as SAMs with OH terminus may be easily detached and internalized by cells due to the weak interactions between Ca2+ and terminal anions of SAMs[22]. Nanocomposites formed on the SAMs with the mixture of COOH- and CH3-terminated alkanethiols resulted in increasing intracellular DNA level as the fraction of COOH-terminated alkanethiol increased (Figure 5, Figure S1). This correlation cannot be completely extrapolated through the mineral growth on SAMs with a single alkanethiol. It is possible that both terminal chemistry and topography play a role in the mineral growth. More detailed studies are needed to understand the induction of nucleation and the rate of mineral growth on the SAMs with a mixture of alkanethiols.
Figure 5.
The cellular uptake of DNA in HEK-293 cells mediated by the DNA-doped nanocomposites. The mineralization was conducted for 24 h. The geometric mean fluorescence intensity (GMFI) was used to quantify the intracellular level of DNA.
3.6. Gene transfer mediated by surface-induced nanocomposites
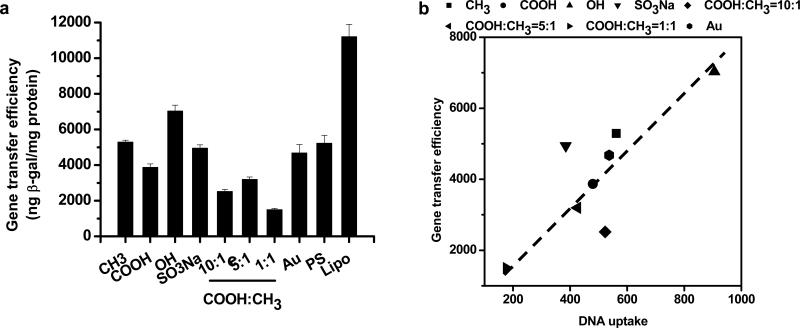
The ability of surface-induced nanocomposites formed on SAMs with various alkanethiols to mediate gene transfer was examined in HEK-293 cells. As shown in Figure 6a, the gene transfer efficiency was dependent on the terminal groups of SAMs on which nanocomposites were induced. Within all four alkanethiols examined, the relative gene transfer efficiency decreased in the order of OH-, CH3-, SO3Na-, COOH-terminated alkanethiols. When the combinations of COOH- and CH3-terminated thiols were used, the gene transfer efficiency mediated by nanocomposites was dependent on the ratio of COOH/CH3-terminated thiols. It appeared that intermediate ratio (5:1) resulted in higher gene transfer efficiency than either lower (1:1) or higher ratio (10:1) ratios.
Figure 6.
(a) Gene transfer efficiency of HEK-293 cells mediated by the DNA-doped nanocomposites. The gene transfer efficiency of cells was expressed as the amount of the reporter enzyme β-gal normalized by total protein. Nanocomposites formed on unmodified gold surface (Au), polystyrene surface (PS) and Lipofectamine™ 2000 (Lipo) were used as controls. The mineralization was conducted for 24 h. (b) The correlation of gene transfer efficiency with the intracellular DNA level in HEK-293 cells mediated by the DNA-doped nanocomposites.
Both the intracellular DNA level and the ease of DNA release from nanocomposites inside cells can contribute to differences in gene transfer efficiency. Upon their internalization by cells, DNA-doped nanocomposites experience pH changes as the endosomal compartments are gradually acidified. We measured the calcium release from nanocomposites as an indicator of the stability of nanocomposites. The release of calcium from nanocomposites induced on different SAMs was similar as the pH decreased from 7.7 to 3.5 (data not shown). In addition, the crystallinity and structure of nanocomposites induced on different SAMs were similar and thus the dissolution of nanocomposites in response to pH was expected to be similar. Therefore, we expect that the ease with which DNA is released from nanocomposites inside cells is not the major contributing factor to the different gene transfer efficiency mediated by nanocomposites formed on different SAMs.
We then examined the effect of intracellular DNA level on the efficiency of gene transfer. As shown in Figure 6b, the gene transfer efficiency nearly linearly increased with the increase of intracellular DNA level for the majority of surfaces except SO3Na- and COOH/CH3 (10:1)-terminated SAMs. This suggests that the differences in the gene transfer efficiency mediated by these nanocomposites mainly originated from the availability of DNA molecules to cells. As we discussed previously, the intracellular DNA level was inversely correlated with the interaction of SAMs with Ca2+ or preformed nuclei and the ability of inducing nanocomposites.
Taken together, our results suggest that SAMs with different terminal groups mediate gene transfer through tuning the interaction of minerals with biomaterial surfaces. Potentially, SAMs with different terminal groups can be patterned to spatially control the gene transfer mediated by surface-induced mineral nanocomposites. Within the alkanethiols examined, nanocomposites on OH-terminated SAMs were superior to others in mediating gene transfer. We recognize that we only examined one cell type in this study. It is likely that the optimal surface chemistry differs for each cell type. Thorough mechanistic understandings of the interactions between nanocomposites, biomaterial surfaces and cells can provide a design principle for choosing an optimal surface with respect to individual cell types. An additional question to be addressed is how the surface chemistry of biomaterials affects the cytotoxicity of surface-induced DNA-doped nanocomposites. Based on our previous studies [11], we do not expect that nanocomposites induced on different SAMs will exhibit significant differences in cytotoxicity for a given cell type and mineralizing solution. In our previous studies, we only examined the change of metabolic activities by using 3-(4,5-Dimethylthiazol-2-yl)-2,5-diphenyltetrazolium bromide (MTT). We urge researchers to examine the cytotoxicity more thoroughly by using DNA and protein arrays and monitoring the target functions and growth of cells when they take our approach to clinical applications.
4. Conclusions
In this study, we examined the effect of functional groups of material surface on the induction and crystallographic properties of surface-induced nanocomposites and thus their ability to mediate DNA transfer into cells directly cultured on the surface. Different functional groups exhibited different ability of inducing the growth of nanocomposites though the morphology and crystallographic orientation of resulting nanocomposites were similar. Weaker inducers resulted in a higher level of intracellular DNA and thus a higher level of transgene expression. This study suggests that the transgene expression mediated by surface-induced nanocomposites and thus cellular functions can be potentially tuned through controlling the surface chemistry of tissue engineering scaffolds.
Supplementary Material
Acknowledgements
This work was supported by the grant R21EB007494 from the National Institutes of Health and by the National Science Foundation CAREER Award awarded to H. Shen. The authors gratefully acknowledge Prof. John C. Berg for the use of Goniometer for contact angle measurement.
Footnotes
Publisher's Disclaimer: This is a PDF file of an unedited manuscript that has been accepted for publication. As a service to our customers we are providing this early version of the manuscript. The manuscript will undergo copyediting, typesetting, and review of the resulting proof before it is published in its final citable form. Please note that during the production process errors may be discovered which could affect the content, and all legal disclaimers that apply to the journal pertain.
References
- 1.Murphy WL, Simmons CA, Kaigler D, Mooney DJ. Bone regeneration via a mineral substrate and induced angiogenesis. Journal of Dental Research. 2004;83:204–10. doi: 10.1177/154405910408300304. [DOI] [PubMed] [Google Scholar]
- 2.Yan WQ, Nakamura T, Kawanabe K, Nishigochi S, Oka M, Kokubo T. Apatite layer-coated titanium for use as bone bonding implants. Biomaterials. 1997;18:1185–90. doi: 10.1016/s0142-9612(97)00057-4. [DOI] [PubMed] [Google Scholar]
- 3.Blaker JJ, Gough JE, Maquet V, Notingher I, Boccaccini AR. In vitro evaluation of novel bioactive composites based on Bioglass (R)-filled polylactide foams for bone tissue engineering scaffolds. Journal of Biomedical Materials Research Part A. 2003;67A:1401–11. doi: 10.1002/jbm.a.20055. [DOI] [PubMed] [Google Scholar]
- 4.Liu X, Smith LA, Hu J, Ma PX. Biomimetic nanofibrous gelatin/apatite composite scaffolds for bone tissue engineering. Biomaterials. 2009;30:2252–8. doi: 10.1016/j.biomaterials.2008.12.068. [DOI] [PMC free article] [PubMed] [Google Scholar]
- 5.Suarez-Gonzalez D, Barnhart K, Saito E, Vanderby R, Hollister SJ, Murphy WL. Controlled nucleation of hydroxyapatite on alginate scaffolds for stem cell-based bone tissue engineering. Journal of Biomedical Materials Research Part A. 95A:222–34. doi: 10.1002/jbm.a.32833. [DOI] [PMC free article] [PubMed] [Google Scholar]
- 6.Fu Q, Rahaman MN, Bal BS, Brown RF, Day DE. Mechanical and in vitro performance of 13-93 bioactive glass scaffolds prepared by a polymer foam replication technique. Acta Biomaterialia. 2008;4:1854–64. doi: 10.1016/j.actbio.2008.04.019. [DOI] [PubMed] [Google Scholar]
- 7.Vitale-Brovarone C, Verne E, Robiglio L, Appendino P, Bassi F, Martinasso G, et al. Development of glass-ceramic scaffolds for bone tissue engineering: Characterisation, proliferation of human osteoblasts and nodule formation. Acta Biomaterialia. 2007;3:199–208. doi: 10.1016/j.actbio.2006.07.012. [DOI] [PubMed] [Google Scholar]
- 8.Dumbleton J, Manley MT. Hydroxyapatite-coated prostheses in total hip and knee arthroplasty. J Bone Joint Surg Am. 2004;86-A:2526–40. doi: 10.2106/00004623-200411000-00029. [DOI] [PubMed] [Google Scholar]
- 9.Geesink RG. Hydroxyapatite-coated total hip prostheses. Two-year clinical and roentgenographic results of 100 cases. Clin Orthop Relat Res. 1990:39–58. [PubMed] [Google Scholar]
- 10.Shen H, Tan J, Saltzman WM. Surface-mediated gene transfer from nanocomposites of controlled texture. Nature Materials. 2004;3:569–74. doi: 10.1038/nmat1179. [DOI] [PubMed] [Google Scholar]
- 11.Sun B, Tran KK, Shen H. Enabling customization of non-viral gene delivery systems for individual cell types by surface-induced mineralization. Biomaterials. 2009;30:6386–93. doi: 10.1016/j.biomaterials.2009.08.006. [DOI] [PMC free article] [PubMed] [Google Scholar]
- 12.De Laporte L, Shea LD. Matrices and scaffolds for DNA delivery in tissue engineering. Advanced Drug Delivery Reviews. 2007;59:292–307. doi: 10.1016/j.addr.2007.03.017. [DOI] [PMC free article] [PubMed] [Google Scholar]
- 13.Partridge KA, Oreffo ROC. Gene delivery in bone tissue engineering: Progress and prospects using viral and nonviral strategies. Tissue Engineering. 2004;10:295–307. doi: 10.1089/107632704322791934. [DOI] [PubMed] [Google Scholar]
- 14.Campbell AA, Fryxell GE, Linehan JC, Graff GL. Surface-induced mineralization: A new method for producing calcium phosphate coatings. Journal of Biomedical Materials Research. 1996;32:111–8. doi: 10.1002/(SICI)1097-4636(199609)32:1<111::AID-JBM13>3.0.CO;2-P. [DOI] [PubMed] [Google Scholar]
- 15.Aizenberg J. Crystallization in patterns: A bio-inspired approach. Advanced Materials. 2004;16:1295–302. [Google Scholar]
- 16.Addadi L, Moradian J, Shay E, Maroudas NG, Weiner S. A Chemical-Model for the Cooperation of Sulfates and Carboxylates in Calcite Crystal Nucleation - Relevance to Biomineralization. Proceedings of the National Academy of Sciences of the United States of America. 1987;84:2732–6. doi: 10.1073/pnas.84.9.2732. [DOI] [PMC free article] [PubMed] [Google Scholar]
- 17.Greenfield EM, Wilson DC, Crenshaw MA. Ionotropic Nucleation of Calcium-Carbonate by Molluscan Matrix. American Zoologist. 1984;24:925–32. [Google Scholar]
- 18.Bennick A, Wong R, Schlesinger DH. Calcium Binding Proteins and Calcium Function. North-Holland; New York: 1977. [Google Scholar]
- 19.Lacefield WR. Bioceramics: Materials Characteristics Versus in Vivo Behavior. Annals of the New York Academy of Sciences; New York: 1988. “Hydroxyapatite coatings”. [Google Scholar]
- 20.Stephen M. Biomineralization: Principles and Concepts in Bioinorganic Materials Chemistry. Oxford University Press; 2001. [Google Scholar]
- 21.Tanahashi M, Matsuda T. Surface functional group dependence on apatite formation on self-assembled monolayers in a simulated body fluid. Journal of Biomedical Materials Research. 1997;34:305–15. doi: 10.1002/(sici)1097-4636(19970305)34:3<305::aid-jbm5>3.0.co;2-o. [DOI] [PubMed] [Google Scholar]
- 22.Aizenberg J, Black AJ, Whitesides GH. Oriented growth of calcite controlled by self-assembled monolayers of functionalized alkanethiols supported on gold and silver. Journal of the American Chemical Society. 1999;121:4500–9. [Google Scholar]
- 23.Hirata I, Akamatsu M, Fujii E, Poolthong S, Okazaki M. Chemical analyses of hydroxyapatite formation on SAM surfaces modified with COOH, NH(2), CH(3), and OH functions. Dent Mater J. 2010;29:438–45. doi: 10.4012/dmj.2010-017. [DOI] [PubMed] [Google Scholar]
- 24.Toworfe GK, Composto RJ, Shapiro IM, Ducheyne P. Nucleation and growth of calcium phosphate on amine-, carboxyl- and hydroxyl-silane self-assembled monolayers. Biomaterials. 2006;27:631–42. doi: 10.1016/j.biomaterials.2005.06.017. [DOI] [PubMed] [Google Scholar]
- 25.Laibinis PE, Whitesides GM. Omega-Terminated Alkanethiolate Monolayers on Surfaces of Copper, Silver, and Gold Have Similar Wettabilities. Journal of the American Chemical Society. 1992;114:1990–5. [Google Scholar]
- 26.Campbell AA, Song L, Li XS, Nelson BJ, Bottoni C, Brooks DE, et al. Development, characterization, and anti-microbial efficacy of hydroxyapatite-chlorhexidine coatings produced by surface-induced mineralization. J Biomed Mater Res. 2000;53:400–7. doi: 10.1002/1097-4636(2000)53:4<400::aid-jbm14>3.0.co;2-z. [DOI] [PubMed] [Google Scholar]
- 27.Liu Q, Ding J, Mante FK, Wunder SL, Baran GR. The role of surface functional groups in calcium phosphate nucleation on titanium foil: a self-assembled monolayer technique. Biomaterials. 2002;23:3103–11. doi: 10.1016/s0142-9612(02)00050-9. [DOI] [PubMed] [Google Scholar]
- 28.Liu DP, Majewski P, O'Neill BK, Ngothai Y, Colby CB. The optimal SAM surface functional group for producing a biomimetic HA coating on Ti. Journal of Biomedical Materials Research Part A. 2006;77A:763–72. doi: 10.1002/jbm.a.30641. [DOI] [PubMed] [Google Scholar]
- 29.Frostman LM, Bader MM, Ward MD. Nucleation and Growth of Molecular-Crystals on Self-Assembled Monolayers. Langmuir. 1994;10:576–82. [Google Scholar]
- 30.Mendoza SM, Arfaoui I, Zanarini S, Paolucci F, Rudolf P. Improvements in the characterization of the crystalline structure of acid-terminated alkanethiol self-assembled monolayers on Au(111). Langmuir. 2007;23:582–8. doi: 10.1021/la0605539. [DOI] [PubMed] [Google Scholar]
- 31.Wang H, Chen SF, Li LY, Jiang SY. Improved method for the preparation of carboxylic acid and amine terminated self-assembled monolayers of alkanethiolates. Langmuir. 2005;21:2633–6. doi: 10.1021/la046810w. [DOI] [PubMed] [Google Scholar]
- 32.Israelachvili J. Intermolecular and Surface Forces. Academic Press; San Diego: 1992. [Google Scholar]
- 33.Balkenende AR, van de Boogaard H, Scholten M, Willard NP. Evaluation of different approaches to assess the surface tension of low-energy solids by means of contact angle measurements. Langmuir. 1998;14:5907–12. [Google Scholar]
- 34.Bensebaa F, Zhou Y, Brolo AG, Irish DE, Deslandes Y, Kruus E, et al. Raman characterization of metal-alkanethiolates. Spectrochimica Acta Part a-Molecular and Biomolecular Spectroscopy. 1999;55:1229–36. [Google Scholar]
- 35.Kudelski A. Raman and electrochemical characterization of 2-mercaptoethanesulfonate monolayers on silver: A comparison with monolayers of 3-mercaptopropionic acid. Langmuir. 2002;18:4741–7. [Google Scholar]
- 36.Sandhyarani N, Skanth G, Berchmans S, Yegnaraman V, Pradeep T. A combined surface-enhanced Raman-X-ray photoelectron spectroscopic study of 2-mercaptobenzothiazole monolayers on polycrystalline Au and Ag films. Journal of Colloid and Interface Science. 1999;209:154–61. doi: 10.1006/jcis.1998.5882. [DOI] [PubMed] [Google Scholar]
- 37.Kudelski A. Surface-enhanced Raman scattering study of monolayers formed from mixtures of 4-mercaptobenzoic acid and various aromatic mercapto-derivative bases. Journal of Raman Spectroscopy. 2009;40:2037–43. [Google Scholar]
- 38.Kudelski A. Chemisorption of 2-mercaptoethanol on silver, copper, and gold: Direct Raman evidence of acid-induced changes in adsorption/desorption equilibria. Langmuir. 2003;19:3805–13. [Google Scholar]
Associated Data
This section collects any data citations, data availability statements, or supplementary materials included in this article.


