

Abstract
Background and Objective
Gingival crevicular fluid (GCF) has been of major interest for many decades as valuable body fluid that may serve as a source of biomarkers for both periodontal and systemic diseases. Because of its very small sample size, sub-μl level, identification of its protein composition by classical biochemical methods has been limited. The advent of highly sensitive mass spectrometric technology has permitted large-scale identification of protein components of many biological samples. This technology has been employed to identify protein composition of GCF from inflamed and periodontal sites. In this report we present a proteome dataset of GCF from healthy periodontium sites.
Methods
A combination of periopaper collection method with application of multidimensional protein separation and mass spectrometric (MS) technology led to a large-scale documentation of the proteome of GCF from healthy periodontium sites.
Results
The approaches utilized have culminated in identification of 199 proteins in GCF of periodontally healthy sites. The current GCF proteome from healthy sites was compared and contrasted with those proteomes of GCF from inflamed and periodontal sites as well as serum. The cross-correlation of the GCF and plasma proteomes permitted dissociation of the 199 identified GCF proteins into, 105 proteins (57%) that can be identified in plasma and 94 proteins (43%) which are distinct and unique to GCF microenvironment. Such analysis also revealed distinctions in protein functional categories between serum proteins and those specific to GCF microenvironment.
Conclusion
Firstly, the data presented herein provide the proteome of GCF from periodontally healthy sites through establishment of innovative analytical approaches for effective analysis of GCF from periopapers both at the level of complete elusion and removal of abundant albumin which restricts identification of low abundant proteins. Secondly, it adds significantly to the knowledge of GCF composition and highlights new groups of proteins specific to GCF microenvironment.
Keywords: Gingival crevicular fluid, mass spectrometry, proteomics, saliva, oral, biomarkers, diagnostics
INTRODUCTION
Gingival crevicular fluid (GCF) has been of major interest because of its unique capacity to reflect in its protein composition the alterations that occur during the transition from gingival health to periodontal disease. GCF is an inflammatory transudate or exudate originating from the gingival plexus of blood vessels in the gingival corium, subjacent to the epithelium lining of the dentogingival space. Although various methods for GCF collection have been described, the most commonly used is the collection with paper strips placed in the sulcus [1]. It can be easily and non-invasively collected and its constituents have the capacity to reflect both local and systemically derived factors and macromolecules. Due to these properties and the volume needed for analysis being much less than serum or urine, for several decades GCF was considered as a potential valuable body fluid that may serve as an important source of biomarkers for both periodontal and systemic diseases [1 –11]. In this respect numerous GCF derived inflammatory factors such as cytokines, proteins, proteinases, phosphatases and local tissue degradation products can be found in GCF and have been evaluated as possible diagnostic markers for periodontitis using traditional methods such as enzyme-linked-immunosorbent-assay [2, 9, 10, 12 –14]. It is clear that in-depth and more comprehensive documentation of GCF proteome is of major interest and desired.
The major protein components of body fluids such as urine, serum/plasma [15, 16], whole saliva, parotid secretion, submandibular/sublingual secretions [17 – 21] have been established by classical biochemistry approaches. In more recent times the advent of mass spectrometry (MS) led to a large-scale proteome documentation of these body fluids, plasma [22], urine [23,24], and within the dental field proteome of whole saliva [25, 26], parotid secretion [27, 28, 29], minor gland secretion [25, 28 – 31], acquired enamel pellicle (AEP) [31, 32], and large-scale phosphoproteome of whole saliva [33, 34]. Despite the latter technological advances, the large-scale proteome analysis and extent of data for GCF components still remain significantly limited. One of the major limitations in the establishment of more extensive knowledge of the protein composition of GCF using both classical biochemical methods and MS technology has been the availability of very small quantities ~0.2–0.5 μl/per site for periodontally healthy individuals.
Recently a study has been reported in an attempt to perform MS-based protein composition of GCF from inflamed gingival sites of patients who had history of periodontal disease and were in maintenance phase of treatment. The reasons for using GCF from such patients to carry out that study was suggested to be due to GCF from healthy individuals being too small to carry out proteome analysis even with the sensitive MS technology [13]. This is not strictly true since ~80 μg/μl and 0.2–0.5 μl per site, is not a small amount of protein in particular if one is to use the contemporary highly sensitive MS technology. Therefore, it is not the small volume of GCF from periodontally healthy sites that may be limiting but rather the collection method that becomes a limiting factor. The method of GCF collection in that study utilized micro-capillary glass tubes and perhaps that was one of the limitations for not being able to collect sufficient GCF fluid from healthy individuals. The use of inflamed/periodontal sites even though the disease was at maintenance phase, would provide more material since the pocket size/depth and GCF fluid increases in such patients. It should be noted, however, that the small quantity of GCF material may not be the only limitation for the high sensitivity of the more contemporary MS technology. For instance, there are other limitations such as dynamic protein range and presence of highly abundant proteins. Such limitations are clearly applicable to GCF which contains abundant serum derived proteins. These become very significant when contributions of serum change from 30% serum for GCF from periodontally healthy individuals to 70% serum contributions for those with inflamed sites or periodontal disease [35–37]. In this case the well known dynamic-protein range becomes a hindrance whereby presence of highly abundant serum proteins such as albumin, constituting ~50% of the total serum proteins, and immunoglobulins can and do restrict the identification of lower level proteins of both systemic and local origin [37–39]. This is because the levels of albumin, immunoglobulins and other abundant serum proteins will most likely limit the scope of identified proteins using MS technology. These are well known major issues and difficulties encountered in the establishment of serum/plasma proteome by MS technology [38]. Furthermore, the serum related contributions become accentuated during gingivitis and periodontitis with increased contributions from serum as well as additional proteins from local inflammatory response. A recent study reported use of periopapers for GCF collection from 21-day experimentally induced human gingivitis model to investigate alterations in protein levels as a function of inflammation [40].
To date a large-scale proteome of GCF from healthy periodontium sites still remain undefined despite the fact that this knowledge is fundamentally central in establishing foundations for saliva based diagnostic markers for systemic and periodontal diseases. In the present work we report a large-scale proteome of GCF from “gingivally healthy sites” identifying 199 distinct proteins with high confidence using periopaper collection method and “multi-dimensional” mass spectrometric approach.
MATERIALS AND METHODS
Gingival crevicular fluid (GCF) collection
GCF collection protocols were approved by the institutional review board of Boston University Medical Center, and informed consent was obtained from each subject participating in this study. Inclusion criteria included overall systemic and oral health, no current or recent medications, non-smoking, not pregnant or lactating. GCF samples were collected from healthy gingival sulcus of second and third molar teeth. The patient evaluation and GCF collections were all performed by the same trained and calibrated clinical dentist. In this study the healthy “periodontium site” was defined by the following clinical criteria: gingival index scored as 0, pocket depth ≤ 3 mm, clinical attachment level ≤ 1.5 mm and no bleeding on probing. These criteria were applied to both specific sites from which collections were made as well as the full-mouth. Teeth were first cleaned with water jet, gently air-dried and isolated with cotton rolls placed in the mesio-buccal sulcus. Commercially available collection periopaper strips were inserted into the orifice of the sulcus of periodontally healthy subjects for 30 seconds. While GCF collection with periopaper from periodontally healthy sites very rarely showed signs of blood contamination when occurred those samples were discarded from analysis. The GCF volume collected with the strips was determined after collection using Periotron 8000 (Oraflow, Plainview, NY) which was calibrated and standard curve was constructed using a range of volumes of water. GCF was collected from 9 gingivally healthy subjects and 4 sites from each subject and at least two different quadrants. The 9 subjects were 4 males and 5 females with ages between 22–33 and a mean age of 28.5 ± 3.7. A total of 36 strips, each containing ~0.3–0.6 μl of GCF, were used and processed for MS analysis as described below.
Processing and analysis of GCF proteins by LC-ESI-MS/MS
(a) In one set of experiment the proteins were eluted from 9 combined strips (pool 1) and another set of 8 combined strips (pool 2) with 200 μl of 50 mM NH4HCO3, pH 8.0, followed by centrifugation to collect the eluate. This was repeated 3x and the eluates were combined for each pool separately, trypsin digested followed by nano-flow liquid-chromatography electrospray-ionization-tandem mass spectrometry (LC-ESI-MS/MS) analysis. (b) To increase the number of proteins identified and maximize the identification of the low level proteins in GCF the highly abundant serum albumin was removed by “SwellGel Blue” (Pierce, Co. Rockford, IL 61105) treatment. In this experiment the proteins were eluted from 10 strips with 200 μl of 50 mM NH4HCO3, pH 8.0, followed by centrifugation to collect the eluate. This was repeated 3x and the eluates combined. The effectiveness of the ‘gSwellGel Blue’h albumin removal was checked by SDS-PAGE using aliquot of the eluate which indicated almost complete removal of the albumin as defined by Coomassie blue stain. However, because of the sensitivity of the MS technology there were detectable traces of albumin present or its peptide fragments which can not be removed easily. The eluate after albumin removal, the SwellGel Blue, and the periopaper strips were all subjected individually to trypsin digestion in the presence of 50 mM NH4HCO3, pH ~8.0, and each sample analyzed by LC-ESI-MS/MS analysis. The pooling of GCF samples were used in order to reduce the site specific variability in the constituents of GCF [13].
SDS-PAGE of GCF proteins and LC-ESI-MS/MS
To further characterize the GCF proteome another set of 9 periopaper strips from 9 subjects (one strip from each), were subjected to SDS-PAGE first and different molecular weight sections were separately in-gel trypsin digested followed by LC-ESI-MS/MS sample.
GCF paper strips were placed in the PAGE (NuPage 12% Bis-Tris Gel 1.0mm × 10 well) wells (one per well) and subjected to SDS-PAGE for extraction and separation of proteins by molecular weight. Electrophoresis was carried out at 120 V until the dye front reached to the bottom of the gel. After eletrophoresis the gel was stained with Coomassie blue and destained with a 40% methanol, 10% acetic acid solution. The de-staining gel was sectioned into 5 different molecular weight ranges by excising these regions with a sharp straight edge razor. The sections comprised Cut 1 (above 75 kDa), Cut 2 (75 to 50 kDa), Cut 3 (below 50 to 35 kDa), Cut 4 (below 25 to above 10 kDa), and Cut 5 (10 kDa and below), as shown in Figure 2. Each section was then cut into smaller pieces (1–2 mm) and placed in an eppendorf tube. SDS and Coomassie blue stain were removed by treatment with buffer 1 (50 mM NH4HCO3 pH 8.0) and buffer 2 (25 mM NH4HCO3 pH 8.0 + 50% CH3CN) alternatively. This step was repeated 3 times. After the last buffer treatment the gel pieces were suspended in buffer 1 containing trypsin (0.5 μg of trypsin per 25 μl of buffer) and the samples were incubated in eppendorf tubes for 24 hrs at 37°C. Following in-gel digestion, buffer containing trypsin and the released peptides were removed and placed in an eppendorf tube. The gel pieces were further extracted by addition of buffer 1 and buffer 2 alternatively with brief agitation (5 min) at each stage and the extraction buffers were pooled. This process was repeated 3 times. The pooled extractions from each SDS-PAGE specific molecular weight range were then freeze dried and cleaned using C-18 reverse-phase MacroSpin column (The Nest Group, Inc. 45 Valley Road, Southborough, MA) for removal of SDS and salts from samples prior to LC-ESI-MS/MS analysis.
Figure 2. SDS-PAGE eletroelution of the GCF proteins from periopaper strips.

A picture of SDS-PAGE, comassie stained gel, showing an example of sectioning of the gel according to different molecular weight regions. All GCF samples were from healthy sites. Lane 1, standard molecular weight proteins; Lanes 2–10, nine individual periopapers run separately. On the right hand side under “CUT” are the sections of different molecular weight regions excised acrooss all five lanes and processed for MS analysis, cut 1: Mr range ~100 kDa and above, cut 2: Mr range ~40–80 kDa, cut 3: Mr range ~25–38 kDa, cut 4 ~11–24 kDa and cut 5: Mr range ~2–10 kDa.
Nano-Flow Liquid-Chromatography and Electrospray-Ionization-Tandem Mass Spectrometric (LC-ESI-MS/MS) Analysis
LC-MS/MS analyses were carried out using LTQ-linear ion trap mass spectrometer (Thermo Electron, San Jose, CA). Samples were suspended in 97.4% H2O: 2.5%CH3CN:0.1% formic acid and LC-ESI-MS/MS analyses were carried out using an on-line autosampler (Micro AS, ThermoFinnigan, CA) with auto-injections of 3 μl onto an in-line fused silica microcapillary column, (75 μm × 10 cm), packed in-house with C18 resin (Micron Bioresource, Inc. Auburn, CA) at a flow rate of 250 nl/min. Peptides were separated by a 55 min elution comprising of multi-step-linear gradient using solvent A, H2O/2.5 % CH3CN/0.1 % formic acid, and solvent B, CH3CN/0.1 % formic acid. The gradient steps were from 100 % solvent A to 8% solvent B in 5 min, to 15 % solvent B in 10 min, to 25 % solvent B in 10 min, to 50 % solvent B in 20 min, and to 95 % solvent B in 10 min using a Surveyor MS Pump Plus (ThermoFinnigan, CA). The eluted peptides were directly nano-electrosprayed and the MS/MS data were generated using data-dependent acquisition with a MS survey scan range between 390 and 2000 m/z. This data-dependent acquisition begins with the LC separation which generates a total ion chromatogram in a survey scan followed by selection of specific ions for collision induced dissociation (CID, MS/MS) in descending order of signal intensity. Each survey scan (MS) was followed by automated sequential selection of five most abundant peptides for CID, at 35% normalized collision energy, with dynamic exclusion time of 20 seconds of the previously selected ions. This process was continuously alternated between MS survey scan and five tandem MS throughout the nano-LC chromatography.
Database search and protein/peptide identification
All MS/MS spectra from LC-ESI-MS/MS were searched against the human database, Uniprot (Universal Protein Resource, Version 9.0), which combines the data from Swiss-Prot (Version 51), TreMBL (Version 36) and PIR using Bioworks 3.3.1 software and SEQUEST search engine [41]. The data were searched against 241,242 entries. To determine the “false positive rate” the data were searched against a concatenated human sequence database containing both the forward and the reverse sequence version. The false positive rate was calculated by using the number of matches to the reverse database multiplied by 2 and divided by the total number of matches (forward plus reverse), as described by Peng et al [42]. The DTA generation was with a precursor-ion tolerance of 1.5 amu, a fragment ion tolerance of 1.0 amu, and automated calculated charged states +1, +2, and +3. The searches were carried out using partial trypsin specification and 2 miscleavages. DTA is a mass spectral file produced during SEQUEST analysis, it contains MS data for single or grouped scans. The use of partial trypsin searches was to avoid the exclusion of any peptides generated by the oral proteolytic activity known to occur in GCF [27, 43, 44]. The full tryptic and half tryptic peptides were used to create the GCF proteome list in Table 1. The database search results were filtered using the criteria: ΔCn ≥ 0.1; probability ≤ 0.1; for fully tryptic peptides, XCorr ≥ 1.6, 1.8, 3.5 for Z= +1, +2, +3; and for partial tryptic peptides, XCorr ≥ 1.8, 2.1, 3.75 for Z= +1, +2, +3.
Table 1.
GCF proteome, 199 proteins, documented for healthy periodondium sites.
| Accession number | Protein name | # | § |
|---|---|---|---|
| Apoptosis and signal transduction | |||
| SP31946 | 14-3-3 protein beta/alpha e | 2 | 2 |
| SP31947 | 14-3-3 protein sigmaabcde | 7 | 7 |
| SP63104 | 14-3-3 protein zeta/delta abce | 6 | 7 |
| SP12814 | Alpha-actinin-1 ce | 2 | 2 |
| O43707 | Alpha-actinin-4 ce | 2 | 2 |
| SP02647 | Apolipoprotein A-I abcde | 13 | 8 |
| SP02652 | Apolipoprotein A-II bce | 3 | 4 |
| SP04114 | Apolipoprotein B-100 abd | 3 | 5 |
| SP02649 | Apolipoprotein E bd | 4 | 3 |
| SO14791 | Apolipoprotein-L1bd | 2 | 3 |
| P54259 | Atrophin-1 b | 2 | 1 |
| SP23528 | Cofilin-1be | 3 | 4 |
| P13569 | Cystic fibrosis transmembrane conductance regulator a | 2 | 1 |
| SP47929 | Galectin-7 be | 2 | 3 |
| P07900 | Heat shock protein HSP 90-alphade | 2 | 2 |
| Q5VST9 | Obscurin a | 3 | 2 |
| Q8IV61 | Ras guanyl-releasing protein 3 c | 2 | 1 |
| Q13114 | TNF receptor-associated factor 3d | 2 | 1 |
| Q7Z3T8 | Zinc finger FYVE domain-containing protein 16 bc | 2 | 2 |
| Cytoskeleton structural proteins | |||
| SP60709 | Actin, cytoplasmic 1abcde | 7 | 7 |
| SP61158 | Actin-related protein 3 d | 3 | 1 |
| P17661 | Desmin be | 2 | 4 |
| SP15924 | Desmoplakin e | 2 | 3 |
| SP02751 | Fibronectin d | 2 | 3 |
| SP21333 | Filamin-A a | 2 | 1 |
| SP06396 | Gelsolin bcde | 8 | 7 |
| P78385 | Keratin type II cuticular Hb3 e | 2 | 1 |
| O76013 | Keratin, type I cuticular Ha6 b | 2 | 2 |
| SP02533 | Keratin, type I cytoskeletal 14 b | 7 | 7 |
| SP08779 | Keratin, type I cytoskeletal 16 b | 5 | 6 |
| SP08727 | Keratin, type I cytoskeletal 19 b | 3 | 2 |
| SP35527 | Keratin, type I cytoskeletal 9 c | 3 | 11 |
| P04264 | Keratin, type II cytoskeletal 1acd | 8 | 15 |
| SQ7Z794 | Keratin, type II cytoskeletal 1b be | 2 | 6 |
| SP35908 | Keratin, type II cytoskeletal 2 epidermal ab | 4 | 12 |
| Q01546 | Keratin, type II cytoskeletal 2 orale | 3 | 4 |
| P12035 | Keratin, type II cytoskeletal 3 e | 2 | 3 |
| P19013 | Keratin, type II cytoskeletal 4 b | 2 | 5 |
| SP13647 | Keratin, type II cytoskeletal 5 ab | 17 | 12 |
| SP02538 | Keratin, type II cytoskeletal 6A abc | 22 | 10 |
| SP04259 | Keratin, type II cytoskeletal 6B b | 5 | 5 |
| Q14CN4 | Keratin, type II cytoskeletal 72 d | 2 | 9 |
| Q86Y46 | Keratin, type II cytoskeletal 73 e | 2 | 3 |
| Q9UPN3 | Microtubule-actin cross-linking factor 1, isoforms 1/2/3/5 ce | 3 | 2 |
| P11137 | Microtubule-associated protein 2e | 2 | 10 |
| SP26038 | Moesin bde | 2 | 3 |
| P41219 | Peripherin b | 2 | 3 |
| O15020 | Spectrin beta chain, brain 2 e | 2 | 1 |
| SQ9Y490 | Talin-1 e | 3 | 3 |
| SP08670 | Vimentin be | 3 | 3 |
| Extracellular structural and adhesion proteins | |||
| SP01019 | Angiotensinogen bc | 2 | 2 |
| P02461 | Collagen alpha-1(III) chain ab | 2 | 1 |
| Q02388 | Collagen alpha-1(VII) chain ab | 2 | 2 |
| Q99715 | Collagen alpha-1(XII) chain ab | 4 | 3 |
| SQ14993 | Collagen alpha-1(XIX) chain b | 3 | 1 |
| P08123 | Collagen alpha-2(I) chain ab | 2 | 3 |
| Q8N613 | Cornulin be | 4 | 5 |
| O60469 | Down syndrome cell adhesion moleculea | 2 | 1 |
| SP02671 | Fibrinogen alpha chain bcde | 10 | 4 |
| SP02675 | Fibrinogen beta chain abd | 9 | 6 |
| SP02679 | Fibrinogen gamma chain b | 10 | 4 |
| P13645 | Keratin, type I cytoskeletal 10 a | 4 | 9 |
| SP13646 | Keratin, type I cytoskeletal 13 a | 20 | 10 |
| Q8WXI7 | Mucin-16 e | 4 | 2 |
| Q5BJF6 | Outer dense fiber protein 2 e | 2 | 1 |
| Q9BYM8 | RanBP-type and C3HC4-type zinc finger-containing protein 1 be | 2 | 2 |
| Q8IWN7 | Retinitis pigmentosa 1-like1 proteina | 2 | 1 |
| SP02768 | Serum albumin abcde | 14 | 15 |
| Q9UBC9 | Small proline-rich protein 3 be | 7 | 6 |
| SQ4LDE5 | Sushi, von Willebrand factor type Aa | 3 | 4 |
| Q9P2K2 | Thioredoxin domain-containing protein 16 d | 4 | 9 |
| Q9BQ70 | Transcription factor 25 a | 2 | 1 |
| P13611 | Versican core protein b | 2 | 1 |
| SP04004 | Vitronectin bd | 5 | 3 |
| Hydrolytic enzymes | |||
| P49189 | 4-trimethylaminobutyraldehyde dehydrogenase d | 2 | 2 |
| P52209 | 6-phosphogluconate dehydrogenase, decarboxylating de | 3 | 3 |
| SP06733 | Alpha-enolase bcde | 8 | 7 |
| SQ9NSC7 | Alpha-N-acetylgalactosaminide alpha-2,6-sialyltransferase 1b | 2 | 1 |
| Q6GMR7 | Amidase domain containing proteinc | 3 | 1 |
| P08311 | Cathepsin G b | 3 | 3 |
| SP00450 | Ceruloplasmin abc | 7 | 5 |
| SP04075 | Fructose-bisphosphate aldolase Ade | 4 | 3 |
| SP04406 | Glyceraldehyde-3-phosphate dehydrogenase de | 7 | 8 |
| SP00738 | Haptoglobin bc | 2 | 7 |
| Q6ZRS2 | Helicase SRCAP a | 2 | 3 |
| Q8TEK3 | Histone-lysine N-methyltransferase, H3 lysine-79 specific bd | 4 | 3 |
| P08246 | Leukocyte elastase b | 2 | 5 |
| SP00338 | L-lactate dehydrogenase A e | 2 | 3 |
| P43490 | Nicotinamide phosphoribosyltransferase b | 2 | 2 |
| SP00558 | Phosphoglycerate kinase 1 d | 2 | 1 |
| SP18669 | Phosphoglycerate mutase 1 bcde | 3 | 9 |
| SP14618 | Pyruvate kinase isozyme M1/M2bde | 11 | 6 |
| P55072 | Transitional endoplasmic reticulum ATPase a | 2 | 1 |
| P29401 | Transketolase ce | 4 | 4 |
| Q7Z410 | Transmembrane protease, serine 9d | 2 | 1 |
| SP60174 | Triosephosphate isomerasee | 2 | 1 |
| Inflammatory and immune response | |||
| SP04083 | Annexin A1 abde | 10 | 11 |
| P06727 | Apolipoprotein A-IV b | 2 | 2 |
| P17213 | Bactericidal permeability- increasing protein b | 2 | 1 |
| SP10909 | Clusterin abde | 4 | 6 |
| SP01024 | Complement C3 abcde | 27 | 9 |
| SP0C0L4 | Complement C4-A d | 7 | 2 |
| SP00751 | Complement factor B bd | 4 | 3 |
| SP31146 | Coronin-1A e | 2 | 2 |
| SP01876 | Ig alpha-1 chain C region bcde | 2 | 6 |
| SP01857 | Ig gamma-1 chain C region abcde | 10 | 14 |
| SP01859 | Ig gamma-2 chain C region a | 6 | 7 |
| SP01861 | Ig gamma-4 chain C region e | 2 | 4 |
| SP01742 | Ig heavy chain V-I region EU d | 2 | 1 |
| SP01834 | Ig kappa chain C region abcde | 4 | 11 |
| SP01871 | Ig mu chain C region b | 2 | 2 |
| SP02788 | Lactotransferrin a | 2 | 5 |
| SP61626 | Lysozyme C e | 2 | 7 |
| P05164 | Myeloperoxidase e | 2 | 1 |
| SP05109 | Protein S100-A8 a | 3 | 3 |
| SP06702 | Protein S100-A9 a | 2 | 2 |
| SP52566 | Rho GDP-dissociation inhibitor 2 e | 2 | 2 |
| Intracellular protein/nucleotide binding | |||
| P62736 | Actin, aortic smooth muscle abcde | 15 | 13 |
| Q562R1 | Actin-like protein 2d Alpha-1,6-mannosylglycoprotein 6-beta- | 2 | 5 |
| Q3V5L5 | N-acetylglucosaminyltransferase B b | 2 | 3 |
| Q6S8J3 | ANKRD26-like family C member 1Aa | 11 | 11 |
| Q9P2D7 | Dynein heavy chain 1, axonemal a | 2 | 3 |
| SP68104 | Elongation factor 1-alpha 1be | 5 | 3 |
| P15311 | Ezrin bd | 2 | 2 |
| SP04792 | Heat shock protein beta-1bde | 6 | 9 |
| SP69905 | Hemoglobin subunit alpha abcd | 2 | 8 |
| SP68871 | Hemoglobin subunit beta abcd | 7 | 6 |
| SP02042 | Hemoglobin subunit delta abcd | 2 | 1 |
| SP02790 | Hemopexin abd | 7 | 3 |
| SP16403 | Histone H1.2 e | 2 | 1 |
| P0C0S8 | Histone H2A type 1 be | 3 | 7 |
| Q96A08 | Histone H2B type 1-A e | 2 | 1 |
| P33778 | Histone H2B type 1-B be | 2 | 5 |
| P68431 | Histone H3.1abe | 2 | 7 |
| Q16695 | Histone H3.1t b | 3 | 1 |
| SP62805 | Histone H4 abcde | 6 | 10 |
| Q5JU85 | IQ motif and Sec7 domain-containing protein 2 d | 2 | 1 |
| Q96JM7 | Lethal(3)malignant brain tumor-like 3 protein b | 2 | 2 |
| SP40925 | Malate dehydrogenase d | 2 | 1 |
| Q6P0Q8 | Microtubule-associated serine/threonine-protein kinase 2 b | 2 | 1 |
| O14950 | Myosin regulatory light chain MRLC2 b | 2 | 1 |
| P35580 | Myosin-10 e | 2 | 1 |
| SP35579 | Myosin-9 bde | 6 | 5 |
| Q14686 | Nuclear receptor coactivator 6 b | 2 | 1 |
| P19338 | Nucleolin d | 2 | 1 |
| P12755 | Ski oncogene d | 2 | 1 |
| Q9P2P6 | StAR-related lipid transfer protein 9bc | 2 | 2 |
| Q92922 | SWI/SNF complex subunit SMARCC1 a | 2 | 2 |
| Q86TI0 | TBC1 domain family member 1 e | 2 | 1 |
| Q8TBP0 | TBC1 domain family member 16 d | 2 | 1 |
| Q99973 | Telomerase protein component 1 d | 2 | 1 |
| Q9BVT8 | Transmembrane and ubiquitin- like domain-containing protein 1 a | 2 | 2 |
| Q71U36 | Tubulin alpha-1A chain e | 3 | 6 |
| Q13748 | Tubulin alpha-3C/D chain e | 3 | 2 |
| SP68366 | Tubulin alpha-4A chain bde | 3 | 4 |
| SQ13885 | Tubulin beta- 2A chain e | 3 | 4 |
| O43309 | Zinc finger and SCAN domain- containing protein 12 b | 2 | 1 |
| Protease/enzyme inhibitors | |||
| SP01011 | Alpha-1-antichymotrypsin d | 2 | 1 |
| SP01009 | Alpha-1-antitrypsin a | 4 | 2 |
| SP01023 | Alpha-2-macroglobulin acde | 10 | 5 |
| SP07355 | Annexin A2 bde | 5 | 4 |
| P12429 | Annexin e | 2 | 4 |
| SP04080 | Cystatin-B a | 2 | 4 |
| SP05546 | Heparin cofactor 2 d | 2 | 1 |
| SP04196 | Histidine-rich glycoprotein b | 2 | |
| SP19827 | Inter-alpha-trypsin inhibitor heavy chain H1 d | 6 | 1 |
| SP19823 | Inter-alpha-trypsin inhibitor heavy chain H2 d | 3 | 1 |
| SQ14624 | Inter-alpha-trypsin inhibitor heavy chain H4 e | 2 | 1 |
| SP30740 | Leukocyte elastase inhibitor a | 2 | 1 |
| SP30086 | Phosphatidylethanolamine- binding protein 1 d | 2 | 1 |
| Proteins falling into various other categories | |||
| SP11021 | 78 kDa glucose-regulated protein e | 2 | 1 |
| Q8WWM7 | Ataxin-2-like protein d | 2 | 1 |
| Q9BXY5 | Calcyphosin-2 d | 2 | 1 |
| SP27482 | Calmodulin-like protein 3 be | 2 | 5 |
| Q8IV04 | Carabin d | 2 | 1 |
| Q7Z7A1 | Centriolin b | 3 | 1 |
| P35663 | Cylicin-1 b | 2 | 1 |
| Q08477 | Cytochrome P450 4F3 b | 2 | 1 |
| P06737 | Glycogen phosphorylase de | 2 | 2 |
| SP34931 | Heat shock 70 kDa protein 1L de | 2 | 5 |
| P08238 | Heat shock protein HSP 90-betabde | 2 | 1 |
| Q9UHV7 | Mediator of RNA polymerase II transcription subunit 13 bc | 3 | 2 |
| SP62937 | Peptidyl-prolyl cis-trans isomerase A bde | 3 | 3 |
| SP13796 | Plastin-2 e | 2 | 4 |
| Q12809 | Potassium voltage-gated channel subfamily H member 2 c | 2 | 1 |
| SP07737 | Profilin-1e | 3 | 6 |
| SP07237 | Protein disulfide-isomerase e | 2 | 1 |
| SP06703 | Protein S100-A6 e | 2 | 2 |
| P46940 | Ras GTPase-activating-like protein d | 3 | 1 |
| P21817 | Ryanodine receptor 1 e | 2 | 2 |
| SP02787 | Serotransferrin a | 2 | 6 |
| SP27169 | Serum paraoxonase/arylesterase 1b | 2 | 4 |
| Q99536 | Synaptic vesicle membrane protein VAT-1b | 2 | 1 |
| SQ8WZ42 | Titin abd | 47 | 10 |
| SP02766 | Transthyretin a | 3 | 2 |
| SP02774 | Vitamin D-binding protein c | 2 | 1 |
| Q96KN7 | X-linked retinitis pigmentosa GTPase regulator b | 2 | 1 |
| Q9H2Y7 | Zinc finger protein 106 homolog e | 2 | 1 |
| SQ96DA0 | Zymogen granule protein 16 homolog B b | 3 | 5 |
The proteins have been grouped into seven different categories based on their known biological function(s). The superscript capital “S” on the left of accession numbers denotes proteins that can be also identified in plasma proteome [22] by MS analysis. Blue color highlights group category. The small superscript letters on the right of protein names denotes;
proteins identified by electroelution using SDS-PAGE, dissected sections, in gel digested and analyzed by LC-MS/MS,
proteins remaining on the periopaper after elution with ammonium bicarbonate,
proteins remaining on the SwellGel blue,
GCF sample after albumin removal of proteins eluted from the SwellGel blue,
direct analysis of the proteins eluted with ammonium bicarbonate 50 mM pH 8.0 without any fractionation step or number of times each protein identified albumin removal. Symbols;
refer to number of peptides of each protein identified, and
refer to number of times each protein identified.
In addition to the search parameters and criteria used, the identified peptide sequences were stringently evaluated and assessed manually by examining each of the identified peptide MS/MS data for the quality and the confidence through the b and y ion fragment series.
Protein annotations
The identified proteins were classified and assigned by molecular function, biological process and cellular component using three web-based applications: Babelomics database http://babelomics.bioinfo.cipf.es/index.html, AmiGO database (http://amigo.geneontology.org/cgi-bin/amigo/go.cgiadvanced_query=yes) and Swiss protein database (http://ca.expasy.org/).
Enzyme-linked immunosorbent assay for human albumin
The human albumin ELISA Kit from Bethy Laboratories, Inc, Montgomery, TX was used for identification and quantitation of human albumin in GCF essential as described in the manufacturer’s protocol. 100 μl of each albumin standard or appropriately diluted sample were added to the corresponding wells of the ready-to-use pre-coated plate, followed by incubation for 1 hour at room temperature. The plate was washed four times with wash buffer and buffer was removed. Then 100 μl of detection antibody was added to each well followed by incubation for 1 hour at room temperature. The plate was washed four times with wash buffer and buffer was removed. This step was followed by addition of 100 μl strepavidin-conjugated horseradish peroxidase (HRP) to each well and incubation for 30 minutes at room temperature. The plate was washed four times with wash buffer followed by addition of 100 μl of tetramethylbenzidine (TMB) to each well and incubated in the dark for 30 minutes at room temperature. The reaction was stopped by addition of diluted sulfuric acid and the absorbance was measured at 450 nm. The data were plotted and the human albumin concentrations in the samples were determined from the standard curve.
RESULTS AND DISCUSSION
In recent times the whole saliva and major parotid secretions have gained significant interest towards establishing their global protein composition, namely the proteome. This was predominantly fueled by the advances made in mass spectrometry (MS) and the concept that such information will aid development of non-invasive oral and systemic diagnostic biomarkers [26, 27, 28, 29, 45]. These extensive studies have been carried out using whole saliva or parotid secretions from healthy individuals with no systemic or periodontal disease in order to establish proteome baseline in health which can then be used to compare with diseased states for diagnostic biomarkers discovery. Another oral cavity specific fluid is GCF which represents a special protein composition in that even in healthy periodondium microenvironment GCF constitutes local proteins such as cytokines, extracellular matrix components, degradation products as well as serum derived proteins. To date the proteome of GCF from periodontally healthy individuals by large-scale MS technology remain at its infancy. The in-depth understanding of GCF composition from periodontally healthy sites is a prerequisite as a baseline before one could evaluate disease states.
The present study identified and documented a proteome dataset of GCF from “periodontally healthy sites” by multi-dimensional protein separation and tandem mass spectrometric (MS) technology. Such an approach in combination with use of periopaper for collection led to identification of 199 distinct proteins in GCF none of which were related to salivary secretion proteins, Table 1. This approach overcomes some of the protein “dynamic-range” limitations frequently encountered in large-scale proteome analysis by MS technology [38]. The present study demonstrated that with multiple refined technologies it is possible to identify a proteome dataset of GCF from individuals with healthy periodontium. The GCF proteome reported in Table 1 was constructed using only proteins identified by two or more peptides which is the accepted criteria for general proteomic studies. Using the filtering criteria chosen the results were associated with a false-positive-rate of <2%. Scheme 1 illustrates the multiple sample preparation steps that were undertaken to establish the current GCF proteome dataset. These steps of digesting what remained on the periopaper after elution and what adhered to swellgel blue with albumin provided an interesting set of results which clearly indicated that this approach actually provided specific enrichment and sample simplification. There were 99 proteins identified when the periopapers themselves with residual proteins were subjected to trypsin digestion and the collected peptides analysed by MS. This indicated that some proteins have strong adsorption to these filters and they can be digested on the paper and peptides eluted for analysis. When the swellgel blue itself was subjected to trypsin digestion and MS analysis, 37 proteins were identified indicating that in addition to albumin there were several proteins that were specifically adsorbed strongly to this gel or as complexes with albumin. After albumin removal step the eluate showed 71 proteins identified. Figure 1 shows the distribution of these proteins and their occurrence as common and uncommon identified proteins in each of these samples. Overall, these analyses led to the identification of 142 distinct proteins in this set. These data prompt us to incorporate another additional separation step based on Mr using SDS-PAGE and analyzing individual specific Mr sections containing different molecular weight proteins, Fig. 2. This approach provided identification of 54 proteins of which 30 were common with the direct and after albumin removal methods, with additional 24 new distinct proteins identified. A third set of data was obtained by simple elution of proteins from periopaper with NH4HCO3 and direct MS analysis after trypsin digestion with no further separation step or sample simplification yielded identification of 84 of which 33 were distinct proteins not found in the above two approaches. The data obtained from all three different sample processing and MS analyses are summarized in Table 1 which are arranged and categorized according to their biological groups. In total these multi-dimensional approaches led to identification of 199 distinct proteins in GCF from periodontally healthy individuals. Of interest is the fact that only 14 proteins could be found common to all three methods used in this study, Fig. 3, whereas each of the approaches could give additional new and distinct proteins not found in another as well as always with some overlapping proteins.
Scheme 1.

Schematic representation of the multiple fractionation/separation techniques used and different processing of the GCF periopaper samples for multidimensional mass spectrometric proteome analysis.
Figure 1. Venn diagram summarizing the distinct proteins identified in the GCF of healthy sites during albumin removal steps.
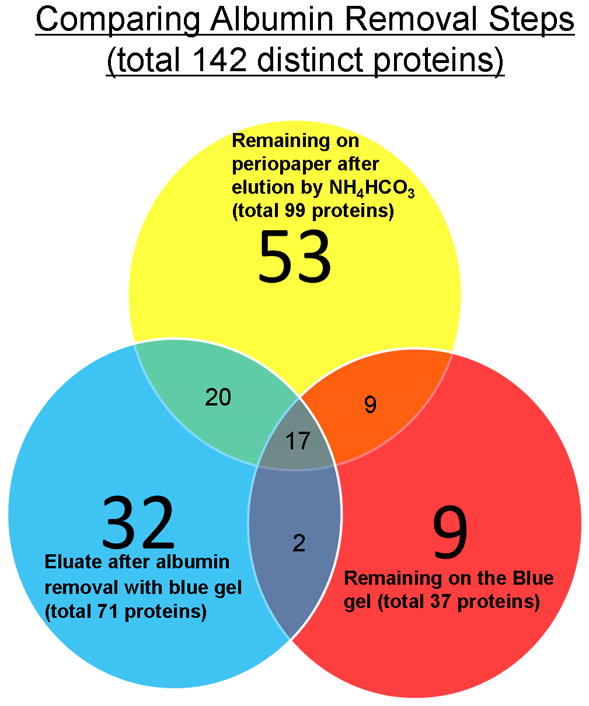
Note the common and uncommon proteins identified in each of the samples which culminated in 142 distinct proteins.
Figure 3. Venn diagram summarizing the total 199 proteins identified in the GCF of healthy sites by multi-dimensional mass spectrometry.
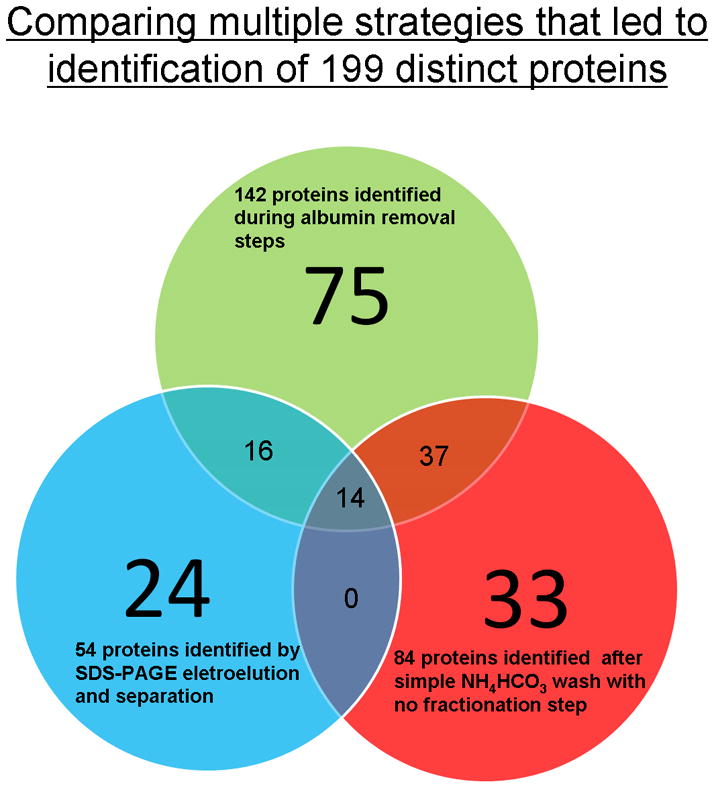
The distinct sets of proteins found only in each of the different experimental approach and analysis (non-overlapped regions) and those that are common (overlapped regions).
We have also established during these studies that GCF from periodontally healthy patients showed an average of 0.49 ± 0.12 μl per site per periopaper strip and they had a protein concentration of 96.38±36.51 μg/μl total protein, as determined by modified micro-Lowry’s protein assay [46], consistent with previous reports [35]. ELISA for serum albumin in GCF samples indicated ~15 μg/μl albumin, and assuming albumin represents ~50% (w/w) of the total serum proteins an estimate of other serum proteins in GCF is ~15 μg/μl of GCF. This provides ~30 μg/μl (w/w) serum proteins in GCF of periodontally healthy sites. Hence, of the total protein composition in GCF from healthy sites, only small portion ~30 μg/μl (~30%) was serum derived and the remaining 66 μg/μl was local GCF microenvironment specific. Clearly, availability of a very small sample volume is compensated by relatively high concentrations of proteins in this biological fluid. Other investigators have also successfully collected GCF from clinically healthy sites for studies using classical biochemical methods since the 70s and 80s [36, 37]. Apart from expected serum derived proteins, the data revealed the presence of sets of macromolecules more specific to local GCF microenvironment and not identified in plasma proteome by MS technology. These ranged from the early inflammation, immune response, innate immune response proteins, enzymes such as proteinases and elestases and their inhibitors, specific bactericidal proteins-defense response to bacteria, proteins that regulate production of cytokines such as IL-6 & 8 and regulate macrophage activity and TNF production, cellular and extracellular matrix components such as collagens, a variety of enzymes including proteinases (cathepsin G, leuckocyte elastase, leukitriene A4 and amidase), and an array of proteinase inhibitors.
The presence of serum derived proteins in GCF from even the healthy sites generates a major interest to compare and define what proportion and which specific proteins found in GCF by this large-scale proteomic approach could be serum related and those specific to GCF microenvironment. This has two fold significance, one is related to establishment of biomarkers for systemic diseases and the other is to reveal local GCF microenvironment specific proteins with potential for the development of periodontal disease biomarkers. This was possible since the plasma proteome has been published using MS analytical methods [22], permitting us to establish comparative correlation with our GCF proteome. This analysis led to 105 proteins (57%) of our GCF proteome that were also identified in plasma by MS and surprisingly about half, 98 proteins (43%), were apparently not plasma related. Hence, we refer to these latter set of proteins as the GCF microenvironment specific proteins. These results are summarized in Table 1 with distinguishing labels for each protein and their possible origin, i.e., found in serum (S) or found only in GCF. The supplemental Table 1 provides the actual sequences of the peptides identified for each protein, their charged states, XC scores, and the molecular function and biological process of each protein. These results reinforce the idea that even though serum contributes to the final GCF fluid composition, GCF from healthy periodontium sites is neither pure serum nor its proteins are all serum derived. It should be noted that the identification of a given protein in both GCF and plasma does not exclude its potential as a diagnostic biomarker for locally based periodontal disease. A good example is S100A8 and S100A9 proteins that can be found in plasma but their levels in GCF may significantly differ during periodontal disease due to local inflammatory response and recruitment of neutrophils and macrophages which are the cells responsible for their production. Interestingly, within the context of the identified proteins in GCF of healthy periodontal sites further evaluation of the data revealed important occurrences. Remarkably the distribution of functional categories of the GCF proteins highlight a shift from almost equal distribution (~11% of each of the categories) for proteins that may be derived from serum to those distinct major categories for proteins specific to GCF microenvironment, Fig. 4. In particular, the dominant two categories highlighted were the intracellular and nucleotide (25%) and hydrolytic enzymes (19%) for proteins specific to GCF microenvironment, Fig. 4C. These observations are of significance since these two functional categories are directly related to periodontal disease and are highly likely to become significantly accentuated during disease progression. Similarly, the distribution of the identified proteins in terms of cellular locality, the serum proteins are predominantly of the extracellular origin (47%) with next dominant being cytoplasmic (33%), Fig.5B. However, proteins specific to GCF microenvironment showed again quite a different distribution with majority being cytoplasmic (39%) and next two major distributions were extracellular (24%) and nuclear origin (22%). Note that the latter was only 9% for serum proteins, Fig. 5B & 5C.
Figure 4. Pie charts of the molecular and functional categories of the GCF proteome from healthy periodontal sites.
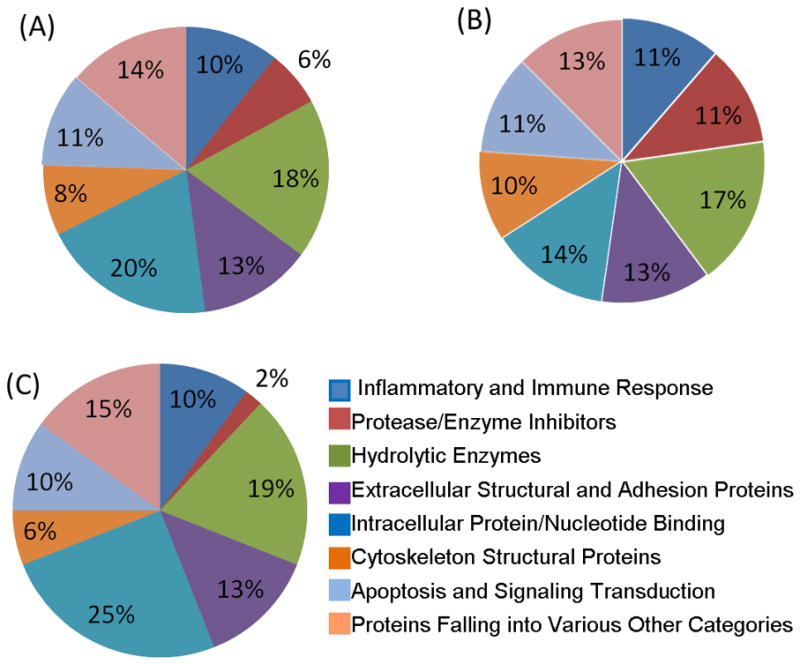
A: Functional categories of the total 199 proteins identified within GCF proteome. B: Functional categories of the 105 GCF proteins which can also be found in the plasma proteome. C: Functional categories of the 94 GCF proteins specific to GCF microenvironment.
Figure 5. Pie charts of distribution and cellular locality of the identified GCF proteins.
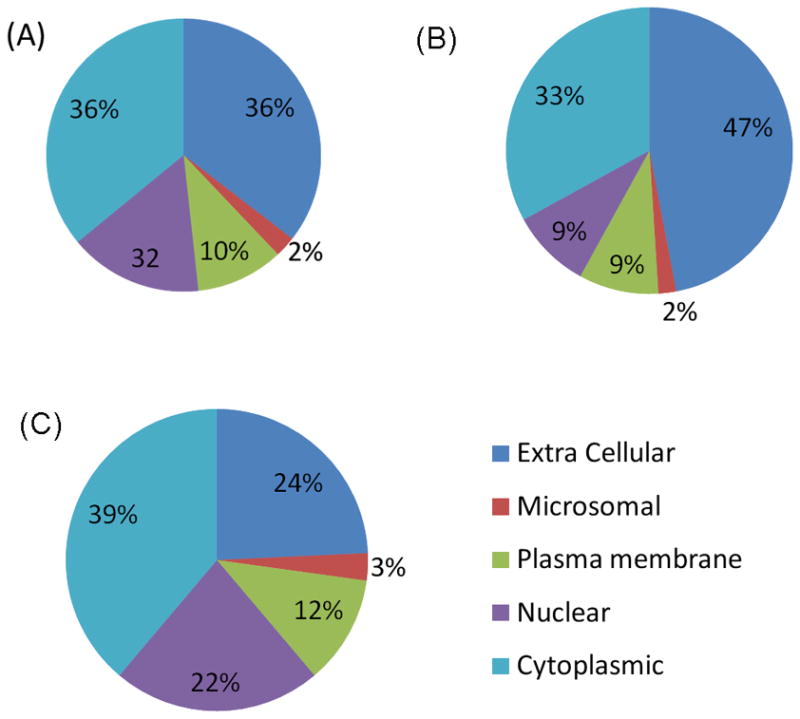
A: Cellular distribution of the total 199 proteins identified within GCF proteome. B: Cellular distribution of the 105 GCF proteins which could be also identified in the plasma proteome. C: Cellular distribution of 94 GCF proteins specific to GCF microenvironment.
The notion to use GCF as a source of diagnostic biomarker for periodontal disease is of course not new. For several decades many potential periodontal disease biomarkers have been screened but all of these have been based on targeting a single analyte at a given time [10]. In more recent times there have been a paradigm shift towards possibility of using a panel of independent disease-related proteins that may serve better and reflect more accurately the disease correlation. In this respect the ability to highlight simultaneously a large number of proteins with local tissue/cell specificity becomes a major interest which the present work fulfills. It is important to note that no classical and well known glandular secretory proteins were identified in the present work in GCF, indicating lack of contamination of the GCF by saliva in the oral cavity during collection. Contrary to our work, however, Ngo et al., found only a handful of distinct proteins plus many keratins by MS approach in GCF of periodontal disease pockets within which there were salivary contaminant proteins such as statherin, acidic proline rich proteins and histatins using capillary glass collection method [13]. Another recent study also used periopapers for collection of GCF from periodontally inflamed sites and performed relative quantitative changes in GCF proteome levels as a function of time of experimentally induced inflammation [40]. That study utilized a 21-day experimental human gingivitis model where inflammation was induced as a function of time by restricting brushing on selected sites. The study documented identification of 186 proteins and when cross-correlated with the proteins in GCF of healthy periodontium sites reported in the present study herein, Table 1, only 28 proteins were found to be common.
Conclusions
The results reported on GCF proteome using multi-dimensional protein separation and MS approaches provided identification of a large number of proteins in GCF of healthy periodontium sites. Comparison of the studies using MS technology and GCF from periodontally inflamed or periodontal sites [12, 13, 40] and our work highlighted important facets of such studies related to GCF in that with the exception of the most abundant proteins, very little overlaps exists amongst the proteins identified so far by MS technologies and hence the present work clearly adds substantially to the knowledge of GCF proteome of healthy periodontal sites. This is likely due to difference in samples, healthy sites versus inflamed and periodontal disease, degree of fractionations of the protein sample, removal of abundant proteins such as albumin and use of chemical labeling for quantitative work or direct qualitative proteome analysis. Furthermore, present work also revealed that when GCF is collected by periopaper a simple elution of the proteins by NH4HCO3 leaves on the periopaper significant number of proteins with some proteins not eluted at all and others only partially. Therefore, caution should be exercised when such collection methods are used for relative quantitative proteomic studies. In comparison to other proteomic studies of saliva field such as parotid secretion that identified more than 1100 proteins [28]and in whole saliva 450 [26] and2300 proteins [39], the proteome of GCF still remain at its infancy. A combined total of about 400 distinct proteins identified (~50% of which are serum derived) from present work (199 proteins) plus those of Grant et. al. [40] (186 proteins, with 28 proteins common), Bostanci et. al. [11] (101 proteins, with 56 proteins common) and Ngo et. al. [13] (66 proteins, with 56 proteins common). The cross-correlation of our data for GCF and the literature plasma proteomes permitted dissociation of our 199 identified GCF proteins into, 105 proteins that can also be identified in plasma and 94 proteins being likely specific to GCF microenvironment. In this respect the importance of the GCF proteome from periodontally healthy sites can be appreciated since GCF is the major link between “serum” (system-wise fluid) and “oral cavity” (whole saliva). In essence our data provide another dimension and augment ongoing GCF proteome studies towards forming the basis for the development of diagnostic biomarkers for health versus disease states.
Supplementary Material
Acknowledgments
The authors thank Dr. Hatice Hasturk for her help and guidance during the collection of GCF from patients at Henry M. Goldman School of Dental Medicine, Boston University. This work was supported by grants from NIDCR: DE 018448 (E.S.), DE 05672 (F.O), DE 07652 (F.O.).
Abbreviations used
- GCF
gingival crevicular fluid
- WS
whole saliva
- ECM
extracellular matrix
- aPRP
acidic-proline-rich protein
- bPRP
basic-proline-rich protein
- CID
collision-induced dissociation
- DTT
dithiothreitol
- LC-ESI-MS/MS
liquid-chromatography electrospray-ionization-tandem-mass spectrometry
- NH4HCO3
ammonium bicarbonate
- CH3CN
acetonitrile
- RP-HPLC
reversed-phase high-performance-liquid-chromatography
Footnotes
This work was presented in part at the International Association for Dental Research (IADR) meeting, 2008, 86th General Session and Exhibition, 2008, Toronto, Canada, Abstract 2135.
References
- 1.Lamster IB, Ahlo JK. Analysis of gingival crevicular fluid as applied to the diagnosis of oral and systemic diseases. Ann New York Acad Sci. 2007;1098:216–229. doi: 10.1196/annals.1384.027. [DOI] [PubMed] [Google Scholar]
- 2.Teles RP, Gursky LC, Faveri M, Rosa EA, Teles FRF, Feres M, et al. Relationships between subgingival microbiota and GCF biomarkers in generalized aggressive periodontitis. J Clin Periodontol. 2010;37:313–323. doi: 10.1111/j.1600-051X.2010.01534.x. [DOI] [PMC free article] [PubMed] [Google Scholar]
- 3.Shimada K, Mizuno T, Ohshio K, Kamaga M, Murai S, Ito K. Analysis of aspartate aminotransferase in gingival crevicular fluid assessed by using PocketWatch (TM): a longitudinal study with initial therapy. J Clin Periodontol. 2000;27:819–823. doi: 10.1034/j.1600-051x.2000.027011819.x. [DOI] [PubMed] [Google Scholar]
- 4.Mantyla P, Stenman M, Kinane D, Salo T, Suomalainen K, Tikanoja S, et al. Monitoring periodontal disease status in smokers and nonsmokers using a gingival crevicular fluid matrix metalloproteinase-8-specific chair-side test. J Periodontal Res. 2006;41:503–512. doi: 10.1111/j.1600-0765.2006.00897.x. [DOI] [PubMed] [Google Scholar]
- 5.Lerner UH, Modeer T, Krekmanova L, Claesson R, Rasmussen L. Gingival crevicular fluid from patients with periodontitis contains bone resorbing activity. Eur journal Oral Sci. 1998;106:778–787. doi: 10.1046/j.0909-8836.1998.eos106304.x. [DOI] [PubMed] [Google Scholar]
- 6.Layik M, Yamalik N, Caglayan F, Kilinc K, Etikan I, Eratalay K. Analysis of human gingival tissue and gingival crevicular fluid beta-glucuronidase activity in specific periodontal diseases. J Periodontol. 2000;71:618–624. doi: 10.1902/jop.2000.71.4.618. [DOI] [PubMed] [Google Scholar]
- 7.Fitzsimmons TR, Sanders AE, Bartold PM, Slade GD. Local and systemic biomarkers in gingival crevicular fluid increase odds of periodontitis. J Clin Periodontol. 2010;37:30–36. doi: 10.1111/j.1600-051X.2009.01506.x. [DOI] [PubMed] [Google Scholar]
- 8.Kojima T, Andersen E, Sanchez JC, Wilkins MR, Hochstrasser DF, Pralong WF, et al. Human gingival crevicular fluid contains MRP8 (S100A8) and MRP14 (S100A9), two calcium-binding proteins of the S100 family. J Dental Res. 2000;79:740–747. doi: 10.1177/00220345000790020701. [DOI] [PubMed] [Google Scholar]
- 9.Offenbacher S, Barros S, Mendoza L, Mauriello S, Preisser J, Moss K, et al. Changes in gingival crevicular fluid inflammatory mediator levels during the induction and resolution of experimental gingivitis in humans. J Clin Periodontol. 2010;37:324–333. doi: 10.1111/j.1600-051X.2010.01543.x. [DOI] [PMC free article] [PubMed] [Google Scholar]
- 10.Loos BG, Tjoa S. Host-derived diagnostic markers for periodontitis: do they exist in gingival crevice fluid? Periodontology 2000. 2005;39:53–72. doi: 10.1111/j.1600-0757.2005.00129.x. [DOI] [PubMed] [Google Scholar]
- 11.Bostanci N, Heywood W, Mills K, Parkar M, Nibali L, Donos N. Application of Label-Free Absolute Quantitative Proteomics in Human Gingival Crevicular Fluid by LC/MS(E) (Gingival Exudatome) J Proteome Res. 2010;9:2191–2199. doi: 10.1021/pr900941z. [DOI] [PubMed] [Google Scholar]
- 12.Estreicher A, Broggiato A, Duroux P, Andersen E, Cimasoni G. Low molecular-weight proteins in human gingival crevicular fluid. Arch Oral Biol. 1996;41:733–738. doi: 10.1016/s0003-9969(96)00076-3. [DOI] [PubMed] [Google Scholar]
- 13.Ngo LH, Veith PD, Chen YY, Chen D, Darby IB, Reynolds EC. Mass spectrometric analyses of peptides and proteins in human gingival crevicular fluid. J Proteome Res. 2010;9:1683–1693. doi: 10.1021/pr900775s. [DOI] [PubMed] [Google Scholar]
- 14.Armitage GC. Analysis of gingival crevice fluid and risk of progression of periodontitis. Periodontology 2000. 2004;34:109–119. doi: 10.1046/j.0906-6713.2002.003427.x. [DOI] [PubMed] [Google Scholar]
- 15.Pruzanski W, Platts ME. Serum and urinary proteins, lysozyme (muramidase), and renal dysfunction in mono- and myelomonocytic leukemia. J Clin Invest. 1970;49:1694–1708. doi: 10.1172/JCI106387. [DOI] [PMC free article] [PubMed] [Google Scholar]
- 16.Killingsworth LM, Britain CE, Woodard LL. Automated immunochemical method for determination of urinary protein of plasma origin. Clin Chem. 1975;21:1465–1468. [PubMed] [Google Scholar]
- 17.Bennick A, Connell GE. Purification and partial characterization of four proteins from human parotid saliva. Biochem J. 1971;123:455–464. doi: 10.1042/bj1230455. [DOI] [PMC free article] [PubMed] [Google Scholar]
- 18.Schlesinger DH, Hay DI. Complete covalent structure of statherin, a tyrosine-rich acidic peptide which inhibits calcium phosphate precipitation from human parotid saliva. J Biol Chem. 1977;252:1689–1695. [PubMed] [Google Scholar]
- 19.Oppenheim FG, Hay DI, Franzblau C. Proline-rich proteins from human parotid saliva. I. Isolation and partial characterization. Biochemistry. 1971;10:4233–8. doi: 10.1021/bi00799a013. [DOI] [PubMed] [Google Scholar]
- 20.Oppenheim FG, Yang YC, Diamond RD, Hyslop D, Offner GD, Troxler RF. The primary structure and functional characterization of the neutral histidine-rich polypeptide from human parotid secretion. J Biol Chem. 1986;261:1177–1182. [PubMed] [Google Scholar]
- 21.Oppenheim FG, Xu T, McMillian FM, Levitz SM, Diamond RD, Offner GD, et al. Histatins, a novel family of histidine-rich proteins in human parotid secretion. Isolation, characterization, primary structure, and fungistatic effects on Candida albicans. J Biol Chem. 1988;263:7472–7477. [PubMed] [Google Scholar]
- 22.Schenk S, Schoenhals GJ, de Souza G, Mann M. A high confidence, manually validated human blood plasma protein reference set. BMC Med Genomics. 2008;1:41. doi: 10.1186/1755-8794-1-41. [DOI] [PMC free article] [PubMed] [Google Scholar]
- 23.Li QR, Fan KX, Li RX, Dai J, Wu CC, Zhao SL, et al. Comprehensive and non-prefractionation on the protein level approach for the human urinary proteome: touching phosphorylation in urine. Rapid Commun Mass Spectrom. 2010;24:823–832. doi: 10.1002/rcm.4441. [DOI] [PubMed] [Google Scholar]
- 24.Candiano G, Santucci L, Petretto A, Bruschi M, Dimuccio V, Urbani A, et al. 2D-electrophoresis and the urine proteome map: where do we stand? J Proteomics. 2010;73:829–844. doi: 10.1016/j.jprot.2009.12.003. [DOI] [PubMed] [Google Scholar]
- 25.Xie H, Rhodus NL, Griffin RJ, Carlis JV, Griffin TJ. A catalogue of human saliva proteins identified by free flow electrophoresis-based peptide separation and tandem mass spectrometry. Mol Cell Proteomics. 2005;4:1826–1830. doi: 10.1074/mcp.D500008-MCP200. [DOI] [PubMed] [Google Scholar]
- 26.Hu S, Xie Y, Ramachandran P, Ogorzalek Loo RR, Li Y, Loo JA, et al. Large-scale identification of proteins in human salivary proteome by liquid chromatography/mass spectrometry and two-dimensional gel electrophoresis-mass spectrometry. Proteomics. 2005;5:1714–1728. doi: 10.1002/pmic.200401037. [DOI] [PubMed] [Google Scholar]
- 27.Hardt M, Thomas LR, Dixon SE, Newport G, Agabian N, Prakobphol A, et al. Toward defining the human parotid gland salivary proteome and peptidome: identification and characterization using 2D SDS-PAGE, ultrafiltration, HPLC, and mass spectrometry. Biochemistry. 2005;44:2885–2899. doi: 10.1021/bi048176r. [DOI] [PubMed] [Google Scholar]
- 28.Denny P, Hagen FK, Hardt M, Liao L, Yan W, Arellanno M, et al. The proteomes of human parotid and submandibular/sublingual gland salivas collected as the ductal secretions. J Proteome Res. 2008;7:1994–2006. doi: 10.1021/pr700764j. [DOI] [PMC free article] [PubMed] [Google Scholar]
- 29.Yan W, Apweiler R, Balgley BM, Boontheung P, Bundy JL, Cargile BJ, et al. Systematic comparison of the human saliva and plasma proteomes. Proteomics Clin Appl. 2009;3:116–134. doi: 10.1002/prca.200800140. [DOI] [PMC free article] [PubMed] [Google Scholar]
- 30.Siqueira WL, Salih E, Wan DL, Helmerhorst EJ, Oppenheim FG. Proteome of human minor salivary gland secretion. J Dental Res. 2008;87:445–450. doi: 10.1177/154405910808700508. [DOI] [PMC free article] [PubMed] [Google Scholar]
- 31.Yao Y, Berg EA, Costello CE, Troxler RF, Oppenheim FG. Identification of protein components in human acquired enamel pellicle and whole saliva using novel proteomics approaches. J Biol Chem. 2003;278:5300–5308. doi: 10.1074/jbc.M206333200. [DOI] [PubMed] [Google Scholar]
- 32.Siqueira WL, Zhang W, Helmerhorst EJ, Gygi SP, Oppenheim FG. Identification of protein components in in vivo human acquired enamel pellicle using LC-ESI-MS/MS. J Proteome Res. 2007;6:2152–2160. doi: 10.1021/pr060580k. [DOI] [PubMed] [Google Scholar]
- 33.Salih E, Siqueira WL, Helmerhorst EJ, Oppenheim FG. Large-scale phosphoproteome of human whole saliva using disulfide-thiol interchange covalent chromatography and mass spectrometry. Anal Biochemistry. 2010;407:19–33. doi: 10.1016/j.ab.2010.07.012. [DOI] [PMC free article] [PubMed] [Google Scholar]
- 34.Stone MD, Chen X, McGowan T, Bandhakavi S, Cheng B, Rhodus NL, et al. Large-Scale Phosphoproteomics Analysis of Whole Saliva Reveals a Distinct Phosphorylation Pattern. J Proteome Res. 2011;10:1728–1736. doi: 10.1021/pr1010247. [DOI] [PMC free article] [PubMed] [Google Scholar]
- 35.Hattingh J, Ho E. The concentration of proteins in human gingival crevicular fluid. J Periodontal Res. 1980;15:90–95. doi: 10.1111/j.1600-0765.1980.tb00262.x. [DOI] [PubMed] [Google Scholar]
- 36.Alfano MC. The origin of gingival fluid. J Theor Biol. 1974;47:127–136. doi: 10.1016/0022-5193(74)90103-9. [DOI] [PubMed] [Google Scholar]
- 37.Bickel M, Cimasoni G, Andersen E. Flow and albumin content of early (pre-inflammatory) gingival crevicular fluid from human subjects. Arch Oral Biol. 1985;30:599–602. doi: 10.1016/0003-9969(85)90079-2. [DOI] [PubMed] [Google Scholar]
- 38.Anderson L. Candidate-based proteomics in the search for biomarkers of cardiovascular disease. J Physiol. 2005;563:23–60. doi: 10.1113/jphysiol.2004.080473. [DOI] [PMC free article] [PubMed] [Google Scholar]
- 39.Bandhakavi S, Stone M, Onsongo G, Van Riper SK, Griffin T. A dynamic range compression and three-dimensional peptide fractionation analysis platform expands proteome coverage and the diagnostic potential of whole saliva. J Proteome Res. 2009;8:5590–5600. doi: 10.1021/pr900675w. [DOI] [PMC free article] [PubMed] [Google Scholar]
- 40.Grant MM, Creese AJ, Barr G, Ling MR, Scott AE, Matthews JB, et al. Proteomic analysis of a noninvasive human model of acute inflammation and its resolution: the twenty-one day gingivitis model. J Proteome Res. 2010;9:4732–4744. doi: 10.1021/pr100446f. [DOI] [PMC free article] [PubMed] [Google Scholar]
- 41.Eng JK, Mccormack AL, Yates JR. An Approach to Correlate Tandem Mass-Spectral Data of Peptides with Amino-Acid-Sequences in a Protein Database. J Am Soc Mass Spectrom. 1994;5:976–989. doi: 10.1016/1044-0305(94)80016-2. [DOI] [PubMed] [Google Scholar]
- 42.Peng J, Elias JE, Thoreen CC, Licklider LJ, Gygi SP. Evaluation of multidimensional chromatography coupled with tandem mass spectrometry (LC/LC-MS/MS) for large-scale protein analysis: the yeast proteome. J Proteome Res. 2003;2:43–50. doi: 10.1021/pr025556v. [DOI] [PubMed] [Google Scholar]
- 43.Baum BJ, Bird JL, Millar DB, Longton RW. Studies on histidine-rich polypeptides from human parotid saliva. Arch Biochem Biophys. 1976;177:427–436. doi: 10.1016/0003-9861(76)90455-0. [DOI] [PubMed] [Google Scholar]
- 44.Helmerhorst EJ, Alagl AS, Siqueira WL, Oppenheim FG. Oral fluid proteolytic effects on histatin 5 structure and function. Arch Oral Biol. 2006;51:1061–1070. doi: 10.1016/j.archoralbio.2006.06.005. [DOI] [PubMed] [Google Scholar]
- 45.Wong DT. Salivary diagnostics powered by nanotechnologies, proteomics and genomics. J American Dental Assoc. 2006;137:313–21. doi: 10.14219/jada.archive.2006.0180. [DOI] [PubMed] [Google Scholar]
- 46.Lowry OH, Rosebrough NJ, Farr AL, Randall RJ. Protein measurement with folin phenol reagent. J Biol Chem. 1951;193:265–275. [PubMed] [Google Scholar]
Associated Data
This section collects any data citations, data availability statements, or supplementary materials included in this article.