

Abstract
Osteoporosis is a common skeletal disease characterized by low bone mass and micro-architectural deterioration of bone tissue, with a consequent increase in bone fragility and susceptibility to fracture. We previously demonstrated that Col1a1-SOX9 transgenic mice, in which SOX9 specifically expresses in osteoblasts driven by a 2.3kb Col1a1 promoter, display osteopenia during the early postnatal stage. In this study, to further analyze the osteopenia phenotype and especially the effect of the osteoblast-specific expression of SOX9 on bone mechanical properties, we performed bone geometry and mechanical property analysis of long bones from Col1a1-SOX9 transgenic mice (TG) and wild type littermates (WT) at different time points. Interestingly, after body weight adjustment, TG mice have similar whole-bone strength as WT mice, but exhibit significantly thinner cortical bone, lower elastic modulus, and higher moment of inertia. Thus, osteoblast-specific SOX9 expression results in altered bone structure and material properties. Furthermore, the expression levels of Pcna, Col1a1, Osteocalcin, and the Opg/Rankl ratio in TG mice are significantly lower until 4 months of age compared with WT mice, suggesting that TG mice have dysregulated bone homeostasis. Finally, bone marrow stromal cells (MSCs) isolated from TG mice display enhanced adipocyte differentiation and decreased osteoblast differentiation in vitro, suggesting that osteoblast-specific expression of SOX9 can lead to altered mesenchymal stem cell differentiation potentials. In conclusion, our study implies that SOX9 activity has to be tightly regulated in adult skeleton to ensure optimal bone quality.
Keywords: SOX9, RUNX2, osteoporosis, bone mechanical property, marrow stromal cells (MSC)
Introduction
Many factors, including genetic elements, influence the risk of osteoporosis. Among the large number of candidate genes for the regulation of bone mass and osteoporotic fracture, runt-domain transcription factor Runx2 plays an essential role in regulating osteoblast differentiation and function [1, 2]. Runx2 has been shown to regulate all the major genes expressed by osteoblasts in tissue culture [3]. Mouse genetic studies show that homozygous Runx2 null mice have a complete lack of all mineralized skeletal elements due to the absence of osteoblast differentiation [4, 5]. Transgenic Runx2 over-expressing mouse models reveal that Runx2 also regulates postnatal bone formation and bone remodeling [6-8]. Importantly, mutations in RUNX2 result in cleidocranial dysplasia (CCD), a dominantly inherited skeletal dysplasia [9-12]. Furthermore, increasing evidence suggests that subtle polymorphic variations in RUNX2 could also regulate bone mineral density (BMD) in the general population [13, 14]. Thus, RUNX2 itself has been proposed as one of the candidate genes for osteoporosis [15].
HMG-domain transcription factor Sox9 is a potent transcriptional activator of chondrocyte-specific genes such as Col2a1, Col11a1, and Aggrecan [16]. Sox9 is essential for successive stages of chondrocyte differentiation and cartilage formation as demonstrated by human and mouse genetic studies [17-19]. Interestingly, both Sox9 and Runx2 are expressed in osteo-chondroprogenitor cells, and our previous study demonstrated the dominance of SOX9 function over RUNX2 during skeletogenesis [20]. SOX9 and RUNX2 directly interact with each other via their respective DNA binding domains. SOX9 decreases RUNX2 binding to its target sequences and drastically inhibits RUNX2 transactivation of osteoblast-specific enhancers. Importantly, SOX9 expression diminishes when osteo-chondroprogenitor cells further differentiate into osteoblasts, and the significance of down-regulating SOX9 expression in osteoblasts remains speculative [21]. Interestingly, the transgenic mice—in which either the full-length or RUNX2-interacting domain of SOX9 specifically expresses in osteoblasts driven by a 2.3kb Col1a1 promoter—display dwarfism and osteopenia at 6 weeks of age, with significantly reduced bone volume with a decreased number of osteoblasts and bone formation rate, defective osteoblast function and mineralization, and down-regulation of osteoblast differentiation markers [20]. However, the effect of SOX9 expression in osteoblasts on bone mechanical properties remains unknown.
Bone marrow is constituted of two separate and distinct stem cell populations: hematopoietic stem cells (HSCs) and mesenchymal stem cells (MSCs, also termed marrow stromal cells) [22, 23]. While mesenchymal stem cells can differentiate into osteoblasts, adipocytes, chondrocytes, and myoblasts as determined by different cell-type specific transcription factors [24-28], recent report shows that human perivascular cells give rise to adherent, multi-lineage progenitor cells that exhibit MSC features [29]. However, the direct effects of osteoblasts on MSC differentiation remain poorly understood. Interestingly, there appears to be antagonism between osteoblastic versus adipogenic cell lineage differentiation in MSCs. Indeed, besides being a transcriptional activator essential for osteoblast differentiation and chondrocyte maturation, Runx2 is also a repressor of adipocyte differentiation. Runx2 deficient chondrocytes and osteoblasts can differentiate into adipocytes at increased frequency [30] [31].
In this study, to further analyze the osteopenia phenotype, especially at the adult stage in Col1a1-SOX9 transgenic mice, we performed a detailed mechanical property analysis of adult long bone from Col1a1-SOX9 transgenic mice (TG) and wild type littermates (WT). To explore the underlying molecular mechanisms of SOX9 function in regulating bone mechanical properties, we evaluated the expressions of bone-related markers in TG and WT adult long bones at different time points. Finally, to investigate the potential effect of SOX9-expressing osteoblasts on MSC differentiation, we isolated MSCs and analyzed their differentiation potential in Col1a1-SOX9 transgenic mice.
Materials and Methods
Animals
Col1a1-SOX9 FL or Col1a1-SOX9 NT transgenic mice were generated and genotyped as previously reported and maintained on a FVB/N background (Fig. 1A) [20]. All mice were maintained and housed at the Case Western Reserve University animal facility under standard conditions. All animal protocols have been reviewed and approved by the Institutional Animal Care and Use Committee (IACUC) of Case Western Reserve University. At ages 1, 2, 4, and 6 months, age- and sex-matched transgenic mice and wild type littermates were sacrificed for mechanical tests (see Supplemental Table 1 for the numbers of mice used) and molecular analysis (additional 3–6 mice per genotype per time point). The whole skeletons and the dissected hindlimbs were analyzed by contact radiography taken at the same time for transgenic and wild-type littermates by a radiographic inspection unit (Faxitron, McMinnville, Oregon).
Figure 1.
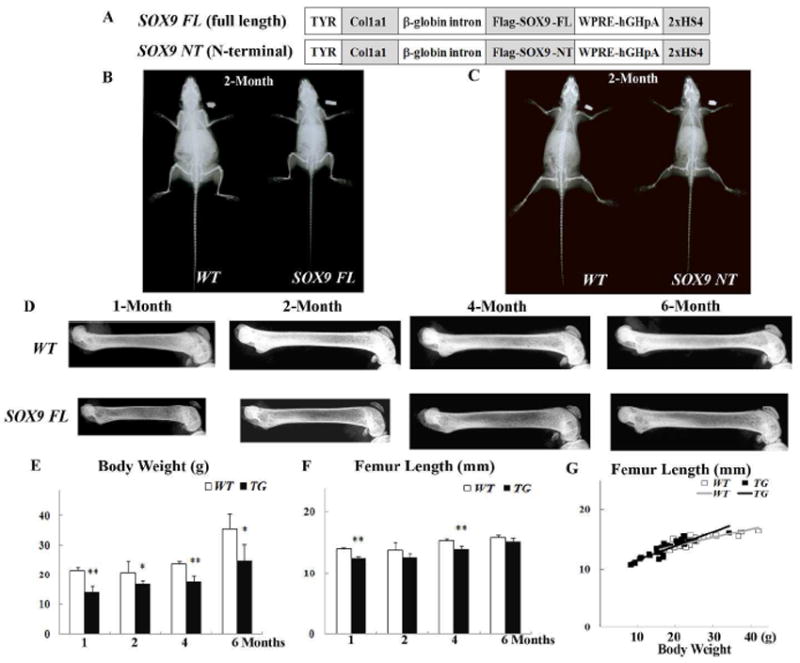
Radiographic analysis of skeletons from wild-type and Col1a1-SOX9 transgenic mice at different time points. (A) Transgenic constructs of Col1a1-SOX9 full length (SOX9 FL) and Col1a1-SOX9 N-terminal (SOX9 NT) [20]. (B, C) Whole body X-ray of Col1a1-SOX9 FL, Col1a1-SOX9 NT transgenic mice and their wild type littermates (WT) at 2 months of age. (D) X-ray photography of dissected femurs in 1-, 2-, 4-, and 6-month-olds. All the images were taken under identical conditions for the transgenic and wild-type littermates. (E, F) Comparison of body weight and femur length by age. (G) Comparison of femur length via body weight adjustment. The linear correlations of femur length with body weight were not significantly different between WT and TG mice (p=0.854). Data are mean ± standard deviation from 3-6 mice per age/group. * indicates p<0.05, and ** indicates p<0.01.
Bone mechanical analysis
Femurs were dissected and cleaned of soft tissue, wrapped in saline soaked gauze, sealed in airtight containers, and stored at -20°C until mechanical testing. The left femurs were tested in three-point bending; the right femurs were used for geometric analysis (as below). Specimens were thawed in saline and placed posterior side down on the bottom pins of a bending fixture (5-mm span between lower pins, 0.75-mm diameter pins) within a materials testing device (Electroforce 3400, Bose, Eden Prairie, MN, USA). The upper pin was aligned and loading was applied at 0.1 mm/sec. The stiffness of the specimen, K, was determined by fitting a linear regression line to the force-displacement curve. Yield strength was evaluated as the point on the force displacement curve where the secant stiffness declined by 10% from the original stiffness [32]. The bending strength was evaluated as the maximum moment applied to the specimen (ultimate load * span length/4; note that maximum moment is directly proportional to ultimate load but accounts for the span length to allow comparisons to other studies).
The right femurs were embedded undecalcificied in methyl methyacrylate, and mid-diaphyseal cross-sections were cut using a low speed diamond saw. The cross sections were hand polished, mounted on glass slides, and observed at 40X magnification. Digital images of the cross-sections under UV illumination were collected to visualize the entire bone cross-section (4.6 micrometers/pixel). The periosteal and endosteal diameters in the anterior-posterior (minor) axis and medial-lateral (major) axis were determined by manual measurement from the image using ImageJ (http://rsbweb.nih.gov/ij/). Average thickness of the cross section was calculated directly using a thresholded image and a distance transform method. The second moment of inertia, I, was determined from the thresholded image using custom Matlab software. The elastic modulus, E, of the bone tissue was estimated using the following equation from beam theory:
where L is the span length (5mm), I is the second moment of inertia, and K is the stiffness obtained from the force-displacement curve.
RNA Isolation and real-time reverse-transcription-polymerase chain reaction (RT-PCR) analysis
Using TRIzol reagent (Invitrogen) and Purelink Micro-To-Midi RNA Kit (Invitrogen), total RNA was extracted from fresh femur samples at different time points (n=3-6/group/time point). The epiphyses at both ends were cut off and the bone marrows were flushed out with PBS as described [33]. cDNAs were prepared from 1μg total RNA with iScript cDNA Synthesis Kit (Bio-Rad). The Power SYBR Green PCR Master Mix (Applied Biosystems) and the 7500 Real Time PCR system (Applied Biosystems) were used for real-time RT-PCR with gene-specific primers listed in Table 1. The Gapdh gene was used as an internal control of the quantity and quality of the cDNAs. The relative gene expression levels were quantified in triplicate and calculated by the 2-ΔΔCT method for fold induction as described previously [34]. For each gene at each time point, WT values were arbitrarily designated as 1 and gene expression levels in TG were compared with WT samples to calculate the relative-fold changes of gene expression at each time points. A single peak was observed for all qPCR primers used in this study. The slopes of the qPCR reactions were between −3.16 and −3.40, indicating efficient amplification.
Table 1.
Primers used in real time RT-PCR analyses
| Gene | Primers* | Size (bp) | Accession No. |
|---|---|---|---|
| Pcna | ACAGCTTACTCTGCGCTCCG | 157 | NM_011045 |
| TGCTAAGGTGTCTGCATTATCTTC | |||
| Col1a1 | GGTGCCCCCGGTCTTCAG | 528 | NM_007742 |
| AGGGCCAGGGGTGCCAGCATTTC | |||
| Osteocalc in | ACCCTGGCTGCGCTCTGTCTCT | 240 | NM_007541 |
| GATGCGTTTGTAGGCGGTCTTCA | |||
| Opg | ATGAACAAGTGGCTGTGCTG | 106 | NM_008764 |
| CAGTTTCTGGGTCATAATGCAA | |||
| Rankl | CAGAAGACAGCACTCACTGC | 296 | NM_011613 |
| ATGGGAACCCGATGGGATGC | |||
| Gapdh | ATGGGAAGCTCGTCATCAAC | 152 | NM_008084 |
| GTGGTTCACACCCATCACAA |
All primer sequences are presented from 5’ to 3’. For each gene, the top sequence is the sense primer, and the bottom sequence is the anti-sense primer.
Bone marrow stromal cell isolation, colony enumeration, and differentiation assay
For bone marrow stromal cells (MSCs) isolation, mice were sacrificed at 2 months of age. Bone marrows were immediately flushed out with cold PBS from the femurs and tibias, followed by centrifugation at 400 × g for 10 min and cell counting. MSCs were then re-suspended to a final concentration of 5 × 10⁶ cells/ml in DMEM medium (HyClone, Utah, USA) with 10% FBS (Invitrogen, USA) as described [35, 36]. MSCs were cultured in a humidified 5% CO2 incubator at 37°C for 72 hours before non-adherent cells were removed by changing the medium. MSCs were then cultured in 6-cm dishes at 1 × 10⁷ cells/dish for 10 days. After washing with PBS twice, dishes were stained with toluidine blue for fibroblast colony-forming unit (CFU-F).
At 50-70% confluence, MSCs were further passaged for 2-3 times before differentiation induction as described [35, 36]. For adipocyte differentiation, after cells reached confluence, adipogenesis was stimulated by three induction/maintenance cycles. Each cycle consisted of 3-day culturing of MSCs with adipogenesis induction DMEM medium, which contains 10% FBS, 10 μg/ml ITS (Insulin-Transferrin-Sodium Selenite Supplement, Roche, Germany), 0.2 mM Indomethacine, and 1 μM Dexamethasone. Cells were then cultured for 3-4 days in adipogenesis maintenance DMEM medium, which contains 10% FBS and 1 μM Dexamethasone. Cells were then fixed, washed with PBS, and stained with 0.5% Oil red O (Sigma) in isopropyl alcohol for 1 h, followed by PBS washing. Osteogenesis differentiation was induced by culturing MSCs for up to 4 weeks in DMEM containing 10% FBS, 50 mg/ml ascorbic acid, 10 mM β-glycerophosphate, and 10-8 M Dexamethasone. To observe calcium deposition, cells were washed once with PBS and stained with alizarin red S solution for 5 min at room temperature.
Histology and Green Fluorescent Protein (GFP) Analysis
For histological analysis, tibiae were collected from 8-week-old Col1a1-SOX9 transgenic mice and wild-type littermates, decalcified and then embedded in paraffin, followed by hematoxylin and eosin staining. For GFP transgenic MSC analysis, MSCs were collected as described above from 8-week-old osteoblast-specific 2.3 Col1a1-GFP transgenics (a kind gift from Dr. David Rowe) [37], CAG-EGFP transgenics that ubiquitously express GFP (The Jackson Laboratory # 006053), and wild-type littermates. After 12-day culture, MSCs were subjected to fluorescence microscopy analysis as described [37].
Statistical Analysis
Results were given as mean ± standard deviations (SD). Statistical analysis was performed by Student’s t-test to compare the differences in gene expression between age-matched Col1a1-SOX9 transgenic mice and wild-type littermates (n=3-6). P<0.05 was considered statistically significant. The linear correlations between geometry, mechanical property data, and body weight were calculated by Microsoft Excel. To compare the difference in linear correlation, statistical analysis was performed by ANCOVA test with XLSTAT 2009 to detect differences in stiffness and strength after accounting for body weight. The ANCOVA was implemented using a generalized least squares model with body weight as a covariate [38]. P<0.05 was considered statistically significant.
Results
Radiographic analysis of Col1a1-SOX9 transgenic skeletons
Whole body X-ray analysis confirmed the dwarfism phenotype in 2-month-old Col1a1-SOX9 full length (SOX9 FL) (Fig. 1B) and Col1a1-SOX9 N-terminal (SOX9 NT) (Fig. 1C) transgenic mice [20]. X-ray photography of dissected femurs showed that both the length and the bone mineralization were reduced in Col1a1-SOX9 FL transgenic mice at age 1 month and 2 months (Fig. 1D). Col1a1-SOX9 FL transgenic mice had more translucent and wider femurs until 6-months of age, suggesting compromised bone mineralization and altered bone geometry (Fig. 1D). The body weight was also significantly lower (Fig. 1E), and the femur length was significantly shorter until age 4 months in Col1a1-SOX9 FL transgenic mice (TG) compared with wild-type littermates (WT) (Fig. 1F). The differences in the femur length between TG and WT appeared to be much reduced at later time points. Indeed, at age 6 months, TG mice had femur lengths similar to those of WT mice (Fig. 1F). There were similar linear correlations between femur length and body weight in WT and TG mice (WT vs TG, p=0.854) (Fig. 1G). Thus, for the same body weight, there was no significant difference in the femur length between WT and TG mice.
Bone geometry
At 1 month of age, Col1a1-SOX9 FL transgenic mice (TG) exhibited severely decreased cortical bone thickness compared with wild-type littermates (WT) (Fig. 2A). Although the cortical bone thickness increased in TG in 2-month- and 4-month-olds, it was still lower than that of WT (Fig. 2A). Additionally, both the femoral periosteal diameter and the endosteal diameter of TG mice were wider than those of WT littermates at all time points (Fig. 2B and 2D). The average cortical bone thickness of TG mice was also significantly lower than that of WT littermates until 4 months of age (Fig. 2F). Importantly, after body weight adjustment, the difference in periosteal diameter, endosteal diameter, and average cortical bone thickness was even more dramatic. There were significant differences in the linear correlations between WT and TG mice (p<0.01) (Fig. 2C, 2E, and 2G). Thus, for the same body weight, TG mice had wider and thinner cortical bone than WT mice.
Figure 2.
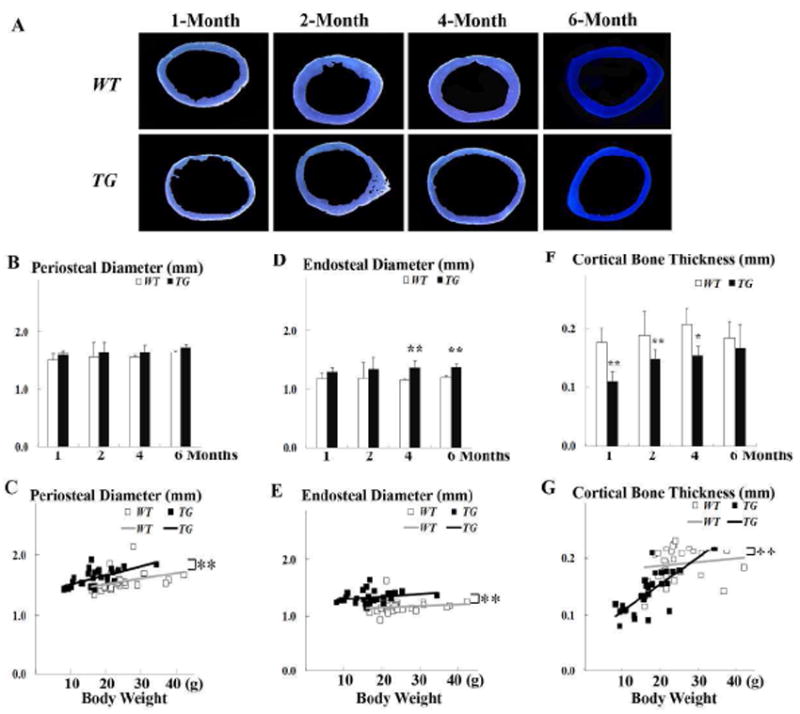
Geometric analysis of cortical bone. (A) Representative mid-diaphyseal femur cross section shows significant reduction in cortical bone thickness in Col1a1-SOX9 FL transgenic mice (TG). (B, D, F) Comparison of periosteal diameter, endosteal diameter, and cortical bone thickness in 1-, 2-, 4-, and 6-month-olds. (C, E, G) Comparison of the linear correlations of periosteal diameter, endosteal diameter, and cortical bone thickness between WT and TG mice after body weight adjustment. For the same body weight, TG mice have wider periosteal diameter, wider endosteal diameter, and thinner cortical bone than WT mice. Data are mean ± standard deviation from 3-6 mice per age/group. * indicates p< 0.05, and ** indicates p<0.01.
Biomechanical analysis
To evaluate the effect of the osteoblast-specific expression of SOX9 on bone mechanical strength, we performed a standard three-point bending assay. Stiffness, yield moment, and maximum moment were all significantly decreased in SOX9 FL transgenic (TG) mice compared with those in wild-type (WT) littermates at all time points we tested (Fig. 3A, 3B, and 3C). However, with body weight adjustment, there was no significant difference in maximum moment between WT and TG mice (Fig. 3D). Thus, for the same body weight, transgenic and wild-type mice had similar whole-bone strength.
Figure 3.
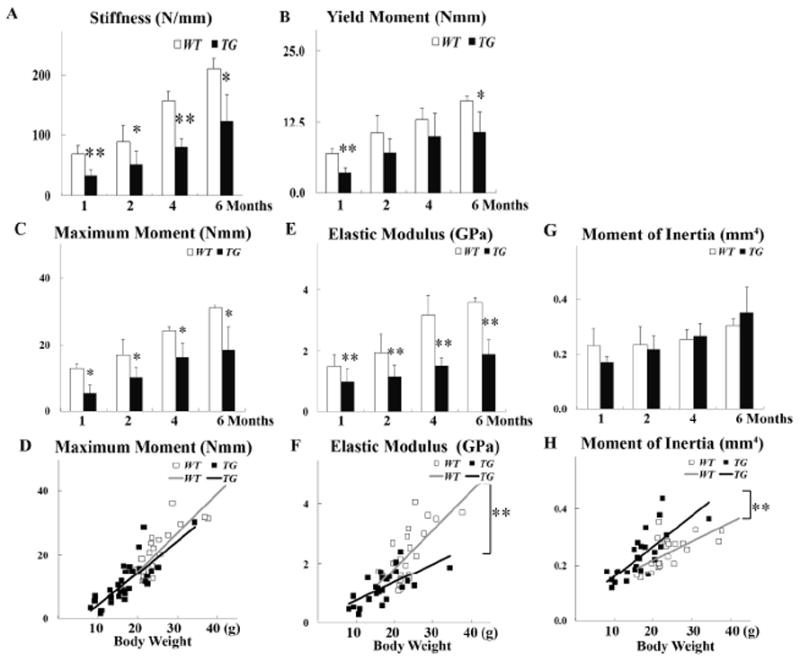
Biomechanical data. Comparison of (A) Stiffness (N/mm), (B) Yield Moment (Nmm), (C) Maximum Moment (Nmm), (E) Elastic Modulus (GPa), (G) Moment of Inertia (mm4) at 1, 2, 4, and 6 months of age. (D, F, H) Comparison of the linear correlation of body weight and Maximum Moment, body weight and Elastic Modulus, and body weight and Moment of Inertia in WT and TG mice. Data are mean ± standard deviation from 3-6 mice per age/group. * indicates p< 0.05, and ** indicates p<0.01.
In both TG and WT mice, there was a linear correlation between the elastic modulus and the body weight (Fig. 3F). However, the elastic modulus was significantly lower in TG than in WT mice at all time points we tested (Fig. 3E). Importantly, for the same body weight, TG mice appear to have more compliant bone tissue material with significantly lower elastic modulus than WT mice (P<0.01) (Fig. 3F). Interestingly, transgenic mice had a moment of inertia similar to that of wild type littermates at the same age (Fig. 3G). There was also a linear correlation between the moment of inertia and the body weight in both TG and WT mice (Fig. 3H). In contrast with the elastic modulus, the slope of the moment of inertia was significantly higher for TG than for WT after body weight adjustment (p<0.01). Thus, femurs from TG mice showed wider bone than WT mice at the same body weight, consistent with the geometry data which showed that TG mice have wider and thinner cortical bone (Fig. 2C, 2E, and 2G). Together, our data show that despite their more compliant bone tissue, at the same body weight, Col1a1-SOX9 FL transgenic mice appear to achieve whole-bone biomechanical performance similar to that of WT by compensating with altered bone geometry, namely an increased second moment of inertia through wider and thinner cortices.
We have previously shown that—similar to Col1a1-SOX9 full length (SOX9 FL), which contains a full-length SOX9 construct—another transgenic mouse line, Col1a1-SOX9 N-terminal (SOX9 NT), which harbors only the N-terminal RUNX2-interacting domain of SOX9, also exhibits osteopenia with defective osteoblast function (Fig. 1C and [20]). To confirm our findings in Col1a1-SOX9 FL transgenic mice and to investigate whether the bone biomechanical changes in mutant mice depend on the RUNX2-interacting domain of SOX9, we performed the same mechanical test in the Col1a1-SOX9 NT transgenic mouse line (Fig. 4A). The bone parameter data in Col1a1-SOX9 NT and wild-type littermates at 2 months of age—including the body weight, femur length, stiffness, yield moment, maximum moment, moment of inertia, and elastic modulus—were consistent with those in the Col1a1-SOX9 FL line (Fig. 4B-4H). Hence, Col1a1-SOX9 NT transgenic mice had a similar biomechanical performance as Col1a1-SOX9 FL transgenic mice. This suggests that the SOX9 effect on bone material and geometry is likely due to its RUNX2-interacting N-terminal that harbors the HMG DNA-binding domain of SOX9.
Figure 4.
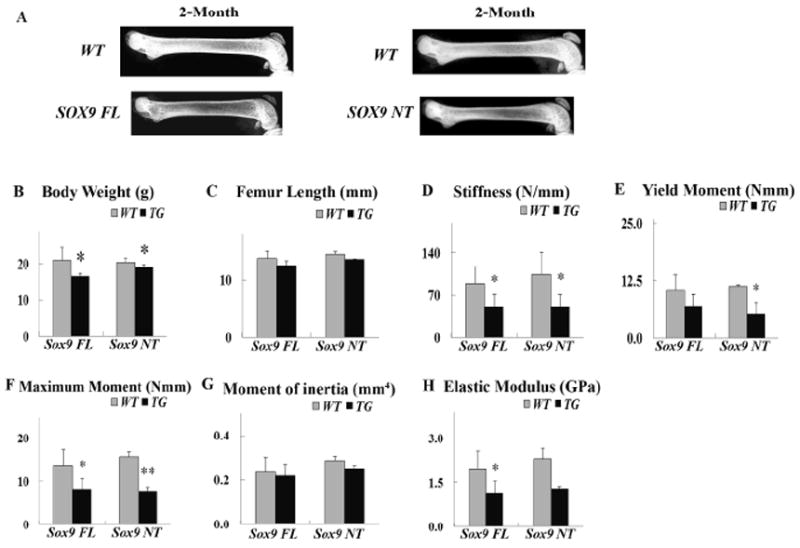
Col1a1-SOX9 NT mice show similar mechanical properties as Col1a1-SOX9 FL mice. (A) X-ray photography of dissected femurs of 2-month-old Col1a1-SOX9 NT and wild-type littermates. (B) Body Weight (grams). (C) Femur Length (mm). (D)Stiffness (N/mm). (E) Yield Moment (Nmm). (F) Maximum moment (Nmm). (G) Moment of inertia (mm4). (H) Elastic modulus. Data are mean ± standard deviation from 3-6 mice per age/group; * and ** indicate p<0.05 and p<0.01, respectively.
Dysregulated osteoblast-specific gene expression in Col1a1-SOX9 FL transgenic mice
To uncover the underlying molecular mechanisms for the altered bone mechanical properties in Col1a1-SOX9 FL transgenic mice (TG), we extracted RNAs from femurs and performed quantitative real-time RT-PCR analysis for osteoblast proliferation and function. We first confirmed the transgene expression in Col1a1-SOX9 FL transgenic mice at all time points (data not shown). To evaluate osteoblast proliferation status, we quantified the expression level of Pcna (proliferating cell nuclear antigen), a proliferation maker. Compared with wild-type femurs, Pcna expression in TG femurs was significantly lower until 4 months of age but significantly higher at 6 months of age (Table 2). This suggests that osteoblasts in TG mice might be deficient in proliferation at an early stage but compensate by over-proliferating at a later stage. Type I collagen is the most abundant extracellular protein in bone, essential for maintaining skeletal strength. In TG mice, Col1a1 expression was significantly lower at 1, 2, and 4 months of age but was significantly higher at 6 months of age than WT (Table 2). Osteocalcin is a non-collagenous protein, secreted specifically by osteoblasts, critical for bone mineralization and calcium ion homeostasis. Interestingly, the expression dynamics of Osteocalcin were similar to those of Col1a1 in TG mice. Osteocalcin expression level was significantly lower at 1 and 2 months of age, increasing to similar levels at age of 4 months, and significantly higher at age 6 months in TG than in WT (Table 2). Thus, the expression profiles of Pcna, Col1a1, and Osteocalcin suggest that Col1a1-SOX9 FL transgenic mice might have delayed proliferation and deregulated bone mineralization.
Table 2.
Relative gene expression level at different time points
| Time Point | Genes | TG | p value |
|---|---|---|---|
| 1-Month | |||
| Pcna | 0.44 ± 0.10 | <0.01 | |
| Col1a1 | 0.18 ± 0.13 | <0.01 | |
| Osteocalcin | 0.08 ± 0.06 | <0.01 | |
| Opg/Rankl | 0.47 ± 0.15 | <0.01 | |
| 2-Month | |||
| Pcna | 0.54 ± 0.22 | <0.01 | |
| Col1a1 | 0.58 ± 0.27 | <0.01 | |
| Osteocalcin | 0.86 ± 0.37 | 0.39 | |
| Opg/Rankl | 1.11 ± 0.23 | 0.56 | |
| 4-Month | |||
| Pcna | 0.76 ± 0.04 | <0.05 | |
| Col1a1 | 0.60 ± 0.03 | <0.01 | |
| Osteocalcin | 1.04 ± 0.06 | 0.72 | |
| Opg/Rankl | 1.10 ± 0.38 | 0.84 | |
| 6-Month | |||
| Pcna | 2.27 ± 0.83 | <0.01 | |
| Col1a1 | 2.13 ± 1.06 | <0.05 | |
| Osteocalcin | 1.78 ± 0.51 | <0.01 | |
| Opg/Rankl | 3.50 ± 1.38 | <0.01 |
For each gene at each time point, expression levels in wild-type (WT) values were arbitrarily designated as 1. Gene expression levels in Col1a1-SOX9 FL transgenics (TG) were compared with WT samples to calculate the relative-fold changes in TG. Data are mean ± SD from 3-6 individual mice per genotype and expressed as the fold changes in TG relative to WT mice.
Osteoblasts and osteoclasts are intimately coupled during bone formation and bone remodeling. To assess the effect of osteoblast-specific SOX9 expression on adult bone remodeling, we quantified the bone metabolism markers Opg and Rankl by real-time RT-PCR. Opg is a major negative regulator of bone resorption as an osteoclastogenesis inhibitory factor, while Rankl is a key stimulator of bone resorption. The Opg/Rankl ratio is commonly used as a prognostic indicator of bone remodeling [39]. The Opg/Rankl ratio was significantly lower at age 1 month in TG than in WT. But afterwards, the Opg/Rankl ratio kept on increasing in TG mice and reached a level similar to that of WT littermates at 2 and 4 months of age. Eventually, the Opg/Rankl ratio was significantly higher at 6 months of age in TG compared with WT. The Opg/Rankl ratio changes hint at the dysregulated bone homeostasis in Col1a1-SOX9 FL transgenic mice. Thus, TG mice might have delayed bone formation and active bone resorption at an early postnatal stage, but switch to increased bone formation and decreased bone resorption at later stages. These osteoblast-related gene expression profiles correlate well with the bone mechanical and geometry data, such as the lower elastic modulus and higher moment of inertia in Col1a1-SOX9 FL transgenic mice compared with WT mice.
Altered bone marrow stromal cell differentiation in Col1a1- SOX9 FL transgenic mice
In bone marrow, osteoblasts might play important roles in regulating mesenchymal stem cell (MSC, also termed marrow stromal cell) maintenance and differentiation, probably as part of the MSC niche. To analyze the MSC function in Col1a1-SOX9 FL transgenic mice, we first performed the in vitro colony formation assay of MSCs derived from Col1a1-SOX9 FL transgenic mice and wild type littermate controls. There was no significant difference in the total colony numbers (CFU-F) (Fig. 5A), suggesting no significant change in MSC numbers in the bone marrow of TG mice.
Figure 5.
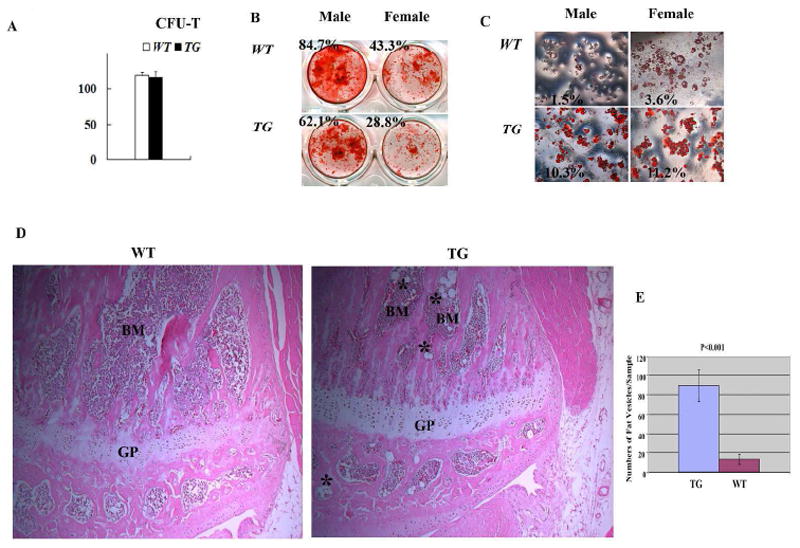
Characterization of Col1a1-SOX9 FL bone marrow stromal cells (MSCs). (A) No significant difference in total colony numbers (CFU-F) between TG and WT mice. (B) Modestly decreased osteoblast differentiation in MSCs from TG mice as assayed by alizarin red staining. (C) Drastically enhanced adipocyte differentiation by Oil red O staining in MSCs from TG mice. The staining area in (B) and (C) was quantified as a percentage of the total area using Image J software analysis and the ratio is presented in each panel. Results are representative of three individual MSC culture experiments. (D) Hematoxylin and eosin staining of proximal tibia of 8 week-old mice showing more fat vesicles in the bone marrow of transgenic mice (asterisks). GP: growth plate; BM: bone marrow. Objective magnification: 10X. (E) Quantification of the number of fat vesicles in the proximal tibia of 8-week-old transgenic and wild-type littermates. p<0.001. N=4 mice per group.
To investigate the effect of osteoblast-specific SOX9 expression on MSC differentiation capability, we performed in vitro adipogenesis and osteogenesis induction assays. Interestingly, for both wild type and transgenic mice, MSCs from males exhibited higher osteogenic activity than those of females by alizarin red staining (Fig. 5B). This suggests a gender difference in murine MSCs differentiation potential, which correlates with a previous report showing that mouse skeletal muscle-derived stem cells from males exhibited higher osteogenic activity than those derived from females [40]. Compared with WT, for both male and female, Col1a1-SOX9 FL MSCs appeared to exhibit modestly decreased osteogenic differentiation (Fig. 5B). However, MSCs from Col1a1-SOX9 FL mice displayed drastically enhanced adipocyte differentiation as assayed by oil red O staining (Fig. 5C). In addition, histological analysis revealed significantly increased numbers of adipocytes in the bone marrow of Col1a1-SOX9 transgenic mice compared with WT (Fig. 5D and 5E). Thus, ectopic expression of SOX9 in osteoblasts seems to tip the MSC differentiation potential towards adipogenesis. Importantly, 2.3Col1a1 promoter is a well-characterized promoter that targets only well-differentiated osteoblasts, not BMSCs [41] [37]. Consistent with a previous report that 2.3 Col1a1-GFP transgene was inactive in human BMSCs [42], our 2.3 Col1a1-GFP transgenic MSC culture experiment indicates that 2.3 Col1a1-targeted osteoblastic lineage cells were not a major direct contributor to the MSC population in cell culture (Fig. 6A), suggesting that the changes in ex vivo differentiation potential in MSCs derived from Col1a1-SOX9 transgenic mice is unlikely due to the direct expression of SOX9 transgene itself in MSCs.
Figure 6.
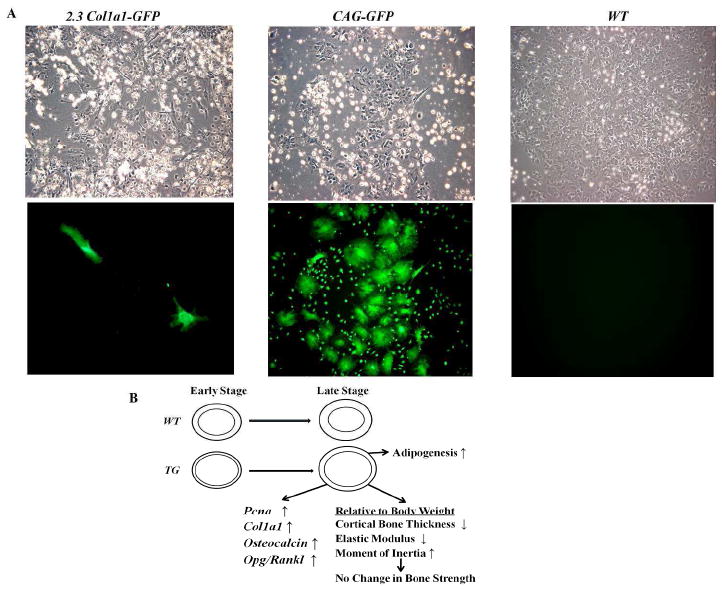
SOX9, osteoblasts, and bone marrow stromal cells. (A) The 2.3 Col1a1 promoter was largely inactive in bone marrow stromal cells. MSCs from CAG-GFP transgenic mice, in which GFP was ubiquitously expressed, exhibited robust GFP expression. MSCs from osteoblast-specific 2.3 Col1a1-GFP transgenic mice [37] were largely absent of GFP expression. The few positive cells in 2.3 Col1a1-GFP MSC cultures were likely due to the residual osteoblasts mixed in MSC preparation. Top panel, bright field; bottom field, GFP filter. Objective magnification: 10X. (B) Proposed model for the effect of SOX9 mis-expression in osteoblasts on bone properties.
Discussion
Bone is a living tissue capable of self-repair, with complex mechanical properties. Bone strength is determined by structural and material properties. Structural properties include features such as bone size, bone geometry, and bone microstructure. Material properties include features such as bone mineral density, chemical composition, and the size of hydroxyapatite crystals [43]. Our previous studies revealed that osteoblasts from Col1a1-SOX9 FL transgenic mice were less active than those from wild-type mice. Bone histomorphometric analysis showed that osteoblast numbers and bone formation rates were significantly reduced in transgenic mice [20]. In the current study, we have investigated the mechanical properties of long bone in Col1a1-SOX9 FL transgenic mice. Interestingly, Col1a1-SOX9 FL transgenic mice exhibit a lower elastic modulus and higher moment of inertia than WT after body weight adjustment. This indicates that for the same body weight, TG mice have wider bone diameters than WT mice to compensate for the decreased elastic modulus. The average cortical bone thickness of SOX9 FL transgenic mice is also significantly lower than that of WT mice until 4 months of age, even after the body weight adjustment (Fig. 2F and 2G). Thus, these results collectively demonstrate the altered bone structure and bone material in TG mice (Fig. 6B).
In previous work, we uncovered the down-regulation of the osteoblast markers Col1a1 and Osteocalcin in Col1a1-SOX9 transgenic mice at both the newborn and 6-week-old time points [20]. In our present work, we further evaluate the expression of various bone-related markers in Col1a1-SOX9 FL transgenic mice to explore the underlying molecular mechanisms of SOX9 in regulating bone mechanical properties. Compared with WT, proliferation marker Pcna expression in TG is significantly lower until age 4 months but increasing to a significantly higher level at age 6 months, indicating delayed bone growth in TG. Col1a1, Osteocalcin, and the Opg/Rankl ratio all display dynamic expression profiles similar to those of Pcna, suggesting delayed bone mineralization and deregulated bone remodeling. These molecular changes are consistent with the inhibitory effect of Sox9 on Runx2 in adult transgenic mice [20].
Genetic factors play an important role in the pathogenesis of osteoporosis [15]. Among them, Runx2 is a master transcription factor essential for osteoblast differentiation and bone remodeling. The Runx2 gene produces two major transcripts driven by alternative promoters, designated P1 and P2, respectively. Interestingly, Runx2-II deficient mice, which have P1 promoter and exon 1 deleted, exhibited a low-turnover osteopenia phenotype similar to Col1a1-SOX9 FL transgenic mice [44, 45]. Runx2-II deficient mice displayed significantly reduced trabecular bone volume, decreased cortical thickness, and decreased bone mineral density. They also exhibited down-regulated osteoblastic and osteoclastic marker expression, decreased bone formation, significant reductions in bone mechanical properties, and impaired MSC differentiation in vitro. Our current study demonstrates that Col1a1-SOX9 FL transgenic mice also exhibit a significant reduction in cortical bone thickness, stiffness, yield moment, and maximum moment, as well as altered MSC differentiation (Fig. 6B). Our previous study demonstrated that SOX9 decreases RUNX2 binding to its target sequences and drastically inhibits RUNX2 transactivation of osteoblast-specific enhancers, indicating the dominance of SOX9 function over RUNX2 during skeletogenesis [20]. Another recent study further demonstrated that Sox9 also directly induced Runx2 protein degradation [46]. Interestingly, the phenotypes in Col1a1-SOX9 mice were also very similar to those observed in Col1a1-Sox8 mice, in which the expression of a highly related HMG transcription factor Sox8 was driven by the same Col1a1 promoter element [47]. Cola1-Sox8 mice displayed impaired bone-formation characterization by low bone mass, defective osteoblast function, and increased spontaneous fracture occurrence. Furthermore, Col1a1-Sox8 also had decreased expression of Runx2 downstream targets such as Col1a1 and Osteocalcin in osteoblasts [47]. Collectively, these three different mouse models show that compromised Runx2 activity leads to osteopenia with altered bone mechanical properties and likely leads to altered MSC differentiation potential. Thus, tight regulation of Runx2 function is not only critical for early embryogenesis, it is also essential for proper adult bone remodeling.
The osteoblast is part of the well-established HSC niche due to its function in maintaining a quiescent HSC microenvironment in bone marrow. However, the effect of osteoblasts on MSCs residing in bone marrow remains poorly understood. Recently, a new factor was reported as regulating stem cell fate: the elasticity of the matrix microenvironment, as a rigid matrix stimulates osteogenic differentiation with elevated Osteocalcin expression [48]. Another report indicates that MSCs respond to ECM rigidity in bone through an integrin-ROCK-FAK-ERK1/2 axis during osteogenic differentiation [49]. However, the mechanism of osteoblast impact on MSC differentiation is still largely unclear. In our current study, although in vitro CFU-F assay showed no significant difference in MSC numbers, MSCs from Col1a1-SOX9 FL transgenic mice exhibited modestly decreased osteogenic potential compared with WT mice. The decreased osteogenesis potential correlated with the decreased elastic modulus in TG mice. Col1a1-SOX9 FL MSCs also displayed enhanced adipocyte differentiation in vitro. There were also more adipocytes in the bone marrow of TG mice compared with WT mice. Our results correlate with previous reports that MSCs derived from osteoporotic patients exhibited important functional differences compared to MSCs obtained from control donors: decreased osteoblast differentiation, less Type I collagen synthesis and increased adipocyte differentiation [50, 51]. The underlying molecular mechanism for the changes in MSC differentiation in Col1a1-SOX9 transgenic mice is still unclear and is likely to be complex. It may reflect the above-mentioned effect of the elasticity of the matrix microenvironment on MSCs, the direct interaction between osteoblasts and MSCs, or the effect of some osteoblast-secreted paracrine factor(s) on MSCs. These possibilities don’t necessarily exclude each other.
Although cell lineage analysis revealed that Sox9-expressing progenitor cells contribute not only to chondrocytes but also to osteoblasts during embryogenesis, Sox9 expression is extinguished during osteoblast differentiation [21]. However, the importance of down-regulating Sox9 expression in osteoblasts is still poorly understood. Interestingly, Sox9 was identified to be associated with Col1a1 promoter in a recent chromatin immunoprecipitation (ChIP)-on-chip study, raising the intriguing possibility that Sox9 can directly inhibit Col1a1 expression in vivo [52]. Additionally, the loss of Sox9 in differentiated chondrocytes resulted in eptopic Col1a1 and Runx2 expression [53]. Thus, Sox9 is likely to repress Col1a1 and Runx2 in differentiated chondrocytes at the transcriptional level. Our current study reveals the adverse effect of mis-expressing Sox9 in osteoblasts during mouse postnatal skeletal development and underscores the importance of inhibiting Sox9 activity in osteoblastic cell linage. Thus, it is important to identify the negative regulators of Sox9 in osteo-chondroprogenitor cells and osteoblasts. In summary, our study shows that tight regulation of SOX9 activity may be critical for maintaining the material and structural integrity of adult bone. A better understanding of SOX9 function in adult skeleton might lead to improved diagnosis of and therapeutic options for osteoporosis. Furthermore, SOX9 mis-expression has been associated with various pathological conditions including fibrosis and cancers [54]. Thus, our study may also shed new light for understanding the mechanism of SOX9-associated disease.
Supplementary Material
Acknowledgments
This work is supported by the NIH grant DE15139 and Case start-up fund (G. Zhou) and the fellowship support from the Department of Anatomy, Case Western Reserve University (M. M. Cotter). We thank Chiderah Okoye and Justin Daggett for assistance with image analysis, and Teresa Pizzuto for expert histology work, Dr. David Rowe for 2.3 Col1a1-GFP mice. We also thank Valerie Schmedlen for editorial assistance and Dr. Shunichi Murakami for critical reading of the manuscript.
Footnotes
The authors have stated that they have no conflict of interest.
Disclosures None.
References
- 1.Ducy P. Cbfa1: a molecular switch in osteoblast biology. Dev Dyn. 2000;219:461–471. doi: 10.1002/1097-0177(2000)9999:9999<::AID-DVDY1074>3.0.CO;2-C. [DOI] [PubMed] [Google Scholar]
- 2.Schroeder TM, Jensen ED, Westendorf JJ. Runx2: a master organizer of gene transcription in developing and maturing osteoblasts. Birth Defects Res C Embryo Today. 2005;75:213–225. doi: 10.1002/bdrc.20043. [DOI] [PubMed] [Google Scholar]
- 3.Ducy P, Zhang R, Geoffroy V, Ridall AL, Karsenty G. Osf2/Cbfa1: a transcriptional activator of osteoblast differentiation. Cell. 1997;89:747–754. doi: 10.1016/s0092-8674(00)80257-3. [DOI] [PubMed] [Google Scholar]
- 4.Komori T, Yagi H, Nomura S, Yamaguchi A, Sasaki K, Deguchi K, Shimizu Y, Bronson RT, Gao YH, Inada M, Sato M, Okamoto R, Kitamura Y, Yoshiki S, Kishimoto T. Targeted disruption of Cbfa1 results in a complete lack of bone formation owing to maturational arrest of osteoblasts. Cell. 1997;89:755–764. doi: 10.1016/s0092-8674(00)80258-5. [DOI] [PubMed] [Google Scholar]
- 5.Otto F, Thornell AP, Crompton T, Denzel A, Gilmour KC, Rosewell IR, Stamp GW, Beddington RS, Mundlos S, Olsen BR, Selby PB, Owen MJ. Cbfa1, a candidate gene for cleidocranial dysplasia syndrome, is essential for osteoblast differentiation and bone development. Cell. 1997;89:765–771. doi: 10.1016/s0092-8674(00)80259-7. [DOI] [PubMed] [Google Scholar]
- 6.Ducy P, Starbuck M, Priemel M, Shen J, Pinero G, Geoffroy V, Amling M, Karsenty G. A Cbfa1-dependent genetic pathway controls bone formation beyond embryonic development. Genes Dev. 1999;13:1025–1036. doi: 10.1101/gad.13.8.1025. [DOI] [PMC free article] [PubMed] [Google Scholar]
- 7.Liu W, Toyosawa S, Furuichi T, Kanatani N, Yoshida C, Liu Y, Himeno M, Narai S, Yamaguchi A, Komori T. Overexpression of Cbfa1 in osteoblasts inhibits osteoblast maturation and causes osteopenia with multiple fractures. J Cell Biol. 2001;155:157–166. doi: 10.1083/jcb.200105052. [DOI] [PMC free article] [PubMed] [Google Scholar]
- 8.Geoffroy V, Kneissel M, Fournier B, Boyde A, Matthias P. High bone resorption in adult aging transgenic mice overexpressing cbfa1/runx2 in cells of the osteoblastic lineage. Mol Cell Biol. 2002;22:6222–6233. doi: 10.1128/MCB.22.17.6222-6233.2002. [DOI] [PMC free article] [PubMed] [Google Scholar]
- 9.Mundlos S, Otto F, Mundlos C, Mulliken JB, Aylsworth AS, Albright S, Lindhout D, Cole WG, Henn W, Knoll JH, Owen MJ, Mertelsmann R, Zabel BU, Olsen BR. Mutations involving the transcription factor CBFA1 cause cleidocranial dysplasia. Cell. 1997;89:773–779. doi: 10.1016/s0092-8674(00)80260-3. [DOI] [PubMed] [Google Scholar]
- 10.Lee B, Thirunavukkarasu K, Zhou L, Pastore L, Baldini A, Hecht J, Geoffroy V, Ducy P, Karsenty G. Missense mutations abolishing DNA binding of the osteoblast-specific transcription factor OSF2/CBFA1 in cleidocranial dysplasia. Nat Genet. 1997;16:307–310. doi: 10.1038/ng0797-307. [DOI] [PubMed] [Google Scholar]
- 11.Zhou G, Chen Y, Zhou L, Thirunavukkarasu K, Hecht J, Chitayat D, Gelb BD, Pirinen S, Berry SA, Greenberg CR, Karsenty G, Lee B. CBFA1 mutation analysis and functional correlation with phenotypic variability in cleidocranial dysplasia. Hum Mol Genet. 1999;8:2311–2316. doi: 10.1093/hmg/8.12.2311. [DOI] [PubMed] [Google Scholar]
- 12.Otto F, Kanegane H, Mundlos S. Mutations in the RUNX2 gene in patients with cleidocranial dysplasia. Hum Mutat. 2002;19:209–216. doi: 10.1002/humu.10043. [DOI] [PubMed] [Google Scholar]
- 13.Vaughan T, Pasco JA, Kotowicz MA, Nicholson GC, Morrison NA. Alleles of RUNX2/CBFA1 gene are associated with differences in bone mineral density and risk of fracture. J Bone Miner Res. 2002;17:1527–1534. doi: 10.1359/jbmr.2002.17.8.1527. [DOI] [PubMed] [Google Scholar]
- 14.Doecke JD, Day CJ, Stephens AS, Carter SL, van Daal A, Kotowicz MA, Nicholson GC, Morrison NA. Association of functionally different RUNX2 P2 promoter alleles with BMD. J Bone Miner Res. 2006;21:265–273. doi: 10.1359/JBMR.051013. [DOI] [PubMed] [Google Scholar]
- 15.Ralston SH, de Crombrugghe B. Genetic regulation of bone mass and susceptibility to osteoporosis. Genes Dev. 2006;20:2492–2506. doi: 10.1101/gad.1449506. [DOI] [PubMed] [Google Scholar]
- 16.Akiyama H. Control of chondrogenesis by the transcription factor Sox9. Mod Rheumatol. 2008;18:213–219. doi: 10.1007/s10165-008-0048-x. [DOI] [PubMed] [Google Scholar]
- 17.Lefebvre V, Huang W, Harley VR, Goodfellow PN, de Crombrugghe B. SOX9 is a potent activator of the chondrocyte-specific enhancer of the pro alpha1(II) collagen gene. Mol Cell Biol. 1997;17:2336–2346. doi: 10.1128/mcb.17.4.2336. [DOI] [PMC free article] [PubMed] [Google Scholar]
- 18.Bi W, Huang W, Whitworth DJ, Deng JM, Zhang Z, Behringer RR, de Crombrugghe B. Haploinsufficiency of Sox9 results in defective cartilage primordia and premature skeletal mineralization. Proc Natl Acad Sci U S A. 2001;98:6698–6703. doi: 10.1073/pnas.111092198. [DOI] [PMC free article] [PubMed] [Google Scholar]
- 19.Akiyama H, Chaboissier MC, Martin JF, Schedl A, de Crombrugghe B. The transcription factor Sox9 has essential roles in successive steps of the chondrocyte differentiation pathway and is required for expression of Sox5 and Sox6. Genes Dev. 2002;16:2813–2828. doi: 10.1101/gad.1017802. [DOI] [PMC free article] [PubMed] [Google Scholar]
- 20.Zhou G, Zheng Q, Engin F, Munivez E, Chen Y, Sebald E, Krakow D, Lee B. Dominance of SOX9 function over RUNX2 during skeletogenesis. Proc Natl Acad Sci U S A. 2006;103:19004–19009. doi: 10.1073/pnas.0605170103. [DOI] [PMC free article] [PubMed] [Google Scholar]
- 21.Akiyama H, Kim JE, Nakashima K, Balmes G, Iwai N, Deng JM, Zhang Z, Martin JF, Behringer RR, Nakamura T, de Crombrugghe B. Osteo-chondroprogenitor cells are derived from Sox9 expressing precursors. Proc Natl Acad Sci U S A. 2005;102:14665–14670. doi: 10.1073/pnas.0504750102. [DOI] [PMC free article] [PubMed] [Google Scholar]
- 22.Yin T, Li L. The stem cell niches in bone. J Clin Invest. 2006;116:1195–1201. doi: 10.1172/JCI28568. [DOI] [PMC free article] [PubMed] [Google Scholar]
- 23.Caplan AI. All MSCs are pericytes? Cell Stem Cell. 2008;3:229–230. doi: 10.1016/j.stem.2008.08.008. [DOI] [PubMed] [Google Scholar]
- 24.Karsenty G, Kronenberg HM, Settembre C. Genetic control of bone formation. Annu Rev Cell Dev Biol. 2009;25:629–648. doi: 10.1146/annurev.cellbio.042308.113308. [DOI] [PubMed] [Google Scholar]
- 25.Luo D, Renault VM, Rando TA. The regulation of Notch signaling in muscle stem cell activation and postnatal myogenesis. Semin Cell Dev Biol. 2005;16:612–622. doi: 10.1016/j.semcdb.2005.07.002. [DOI] [PubMed] [Google Scholar]
- 26.Lefebvre V, Smits P. Transcriptional control of chondrocyte fate and differentiation. Birth Defects Res C Embryo Today. 2005;75:200–212. doi: 10.1002/bdrc.20048. [DOI] [PubMed] [Google Scholar]
- 27.Komori T. Regulation of osteoblast differentiation by transcription factors. J Cell Biochem. 2006;99:1233–1239. doi: 10.1002/jcb.20958. [DOI] [PubMed] [Google Scholar]
- 28.Farmer SR. Transcriptional control of adipocyte formation. Cell Metab. 2006;4:263–273. doi: 10.1016/j.cmet.2006.07.001. [DOI] [PMC free article] [PubMed] [Google Scholar]
- 29.Crisan M, Yap S, Casteilla L, Chen CW, Corselli M, Park TS, Andriolo G, Sun B, Zheng B, Zhang L, Norotte C, Teng PN, Traas J, Schugar R, Deasy BM, Badylak S, Buhring HJ, Giacobino JP, Lazzari L, Huard J, Peault B. A perivascular origin for mesenchymal stem cells in multiple human organs. Cell Stem Cell. 2008;3:301–313. doi: 10.1016/j.stem.2008.07.003. [DOI] [PubMed] [Google Scholar]
- 30.Kobayashi H, Gao Y, Ueta C, Yamaguchi A, Komori T. Multilineage differentiation of Cbfa1-deficient calvarial cells in vitro. Biochem Biophys Res Commun. 2000;273:630–636. doi: 10.1006/bbrc.2000.2981. [DOI] [PubMed] [Google Scholar]
- 31.Enomoto H, Furuichi T, Zanma A, Yamana K, Yoshida C, Sumitani S, Yamamoto H, Enomoto-Iwamoto M, Iwamoto M, Komori T. Runx2 deficiency in chondrocytes causes adipogenic changes in vitro. J Cell Sci. 2004;117:417–425. doi: 10.1242/jcs.00866. [DOI] [PubMed] [Google Scholar]
- 32.Jepsen KJ, Pennington DE, Lee YL, Warman M, Nadeau J. Bone brittleness varies with genetic background in A/J and C57BL/6J inbred mice. J Bone Miner Res. 2001;16:1854–1862. doi: 10.1359/jbmr.2001.16.10.1854. [DOI] [PubMed] [Google Scholar]
- 33.Merciris D, Schiltz C, Legoupil N, Marty-Morieux C, de Vernejoul MC, Geoffroy V. Over-expression of TIMP-1 in osteoblasts increases the anabolic response to PTH. Bone. 2007;40:75–83. doi: 10.1016/j.bone.2006.07.013. [DOI] [PubMed] [Google Scholar]
- 34.Zheng Q, Zhou G, Morello R, Chen Y, Garcia-Rojas X, Lee B. Type X collagen gene regulation by Runx2 contributes directly to its hypertrophic chondrocyte-specific expression in vivo. J Cell Biol. 2003;162:833–842. doi: 10.1083/jcb.200211089. [DOI] [PMC free article] [PubMed] [Google Scholar]
- 35.Meirelles Lda S, Nardi NB. Murine marrow-derived mesenchymal stem cell: isolation, in vitro expansion, and characterization. Br J Haematol. 2003;123:702–711. doi: 10.1046/j.1365-2141.2003.04669.x. [DOI] [PubMed] [Google Scholar]
- 36.Nadri S, Soleimani M, Hosseni RH, Massumi M, Atashi A, Izadpanah R. An efficient method for isolation of murine bone marrow mesenchymal stem cells. Int J Dev Biol. 2007;51:723–729. doi: 10.1387/ijdb.072352ns. [DOI] [PubMed] [Google Scholar]
- 37.Kalajzic I, Kalajzic Z, Kaliterna M, Gronowicz G, Clark SH, Lichtler AC, Rowe D. Use of type I collagen green fluorescent protein transgenes to identify subpopulations of cells at different stages of the osteoblast lineage. J Bone Miner Res. 2002;17:15–25. doi: 10.1359/jbmr.2002.17.1.15. [DOI] [PubMed] [Google Scholar]
- 38.Glantz SA, Slinker BK. Primer of Applied Regression & Analysis of Variance. New York: McGraw-Hill; 2001. [Google Scholar]
- 39.Khosla S. Minireview: the OPG/RANKL/RANK system. Endocrinology. 2001;142:5050–5055. doi: 10.1210/endo.142.12.8536. [DOI] [PubMed] [Google Scholar]
- 40.Corsi KA, Pollett JB, Phillippi JA, Usas A, Li G, Huard J. Osteogenic potential of postnatal skeletal muscle-derived stem cells is influenced by donor sex. J Bone Miner Res. 2007;22:1592–1602. doi: 10.1359/jbmr.070702. [DOI] [PubMed] [Google Scholar]
- 41.Rossert J, Eberspaecher H, de Crombrugghe B. Separate cis-acting DNA elements of the mouse pro-alpha 1(I) collagen promoter direct expression of reporter genes to different type I collagen-producing cells in transgenic mice. J Cell Biol. 1995;129:1421–1432. doi: 10.1083/jcb.129.5.1421. [DOI] [PMC free article] [PubMed] [Google Scholar]
- 42.Yin D, Wang Z, Gao Q, Sundaresan R, Parrish C, Yang Q, Krebsbach PH, Lichtler AC, Rowe DW, Hock J, Liu P. Determination of the fate and contribution of ex vivo expanded human bone marrow stem and progenitor cells for bone formation by 2.3ColGFP. Mol Ther. 2009;17:1967–1978. doi: 10.1038/mt.2009.151. [DOI] [PMC free article] [PubMed] [Google Scholar]
- 43.Ammann P, Rizzoli R. Bone strength and its determinants. Osteoporos Int. 2003;14(Suppl 3):S13–18. doi: 10.1007/s00198-002-1345-4. [DOI] [PubMed] [Google Scholar]
- 44.Xiao ZS, Hjelmeland AB, Quarles LD. Selective deficiency of the “bone-related” Runx2-II unexpectedly preserves osteoblast-mediated skeletogenesis. J Biol Chem. 2004;279:20307–20313. doi: 10.1074/jbc.M401109200. [DOI] [PubMed] [Google Scholar]
- 45.Xiao Z, Awad HA, Liu S, Mahlios J, Zhang S, Guilak F, Mayo MS, Quarles LD. Selective Runx2-II deficiency leads to low-turnover osteopenia in adult mice. Dev Biol. 2005;283:345–356. doi: 10.1016/j.ydbio.2005.04.028. [DOI] [PMC free article] [PubMed] [Google Scholar]
- 46.Cheng A, Genever PG. SOX9 determines RUNX2 transactivity by directing intracellular degradation. J Bone Miner Res. 2010;25:2404–2413. doi: 10.1002/jbmr.174. [DOI] [PubMed] [Google Scholar]
- 47.Schmidt K, Schinke T, Haberland M, Priemel M, Schilling AF, Mueldner C, Rueger JM, Sock E, Wegner M, Amling M. The high mobility group transcription factor Sox8 is a negative regulator of osteoblast differentiation. J Cell Biol. 2005;168:899–910. doi: 10.1083/jcb.200408013. [DOI] [PMC free article] [PubMed] [Google Scholar]
- 48.Engler AJ, Sen S, Sweeney HL, Discher DE. Matrix elasticity directs stem cell lineage specification. Cell. 2006;126:677–689. doi: 10.1016/j.cell.2006.06.044. [DOI] [PubMed] [Google Scholar]
- 49.Shih YR, Tseng KF, Lai HY, Lin CH, Lee OK. Matrix stiffness regulation of integrin-mediated mechanotransduction during osteogenic differentiation of human mesenchymal stem cells. J Bone Miner Res. 2011;26:730–738. doi: 10.1002/jbmr.278. [DOI] [PubMed] [Google Scholar]
- 50.Rodriguez JP, Garat S, Gajardo H, Pino AM, Seitz G. Abnormal osteogenesis in osteoporotic patients is reflected by altered mesenchymal stem cells dynamics. J Cell Biochem. 1999;75:414–423. doi: 10.1002/(sici)1097-4644(19991201)75:3<414::aid-jcb7>3.3.co;2-3. [DOI] [PubMed] [Google Scholar]
- 51.Rodriguez JP, Montecinos L, Rios S, Reyes P, Martinez J. Mesenchymal stem cells from osteoporotic patients produce a type I collagen-deficient extracellular matrix favoring adipogenic differentiation. J Cell Biochem. 2000;79:557–565. doi: 10.1002/1097-4644(20001215)79:4<557::aid-jcb40>3.0.co;2-h. [DOI] [PubMed] [Google Scholar]
- 52.Oh CD, Maity SN, Lu JF, Zhang J, Liang S, Coustry F, de Crombrugghe B, Yasuda H. Identification of SOX9 interaction sites in the genome of chondrocytes. PLoS One. 5:e10113. doi: 10.1371/journal.pone.0010113. [DOI] [PMC free article] [PubMed] [Google Scholar]
- 53.Ikegami D, Akiyama H, Suzuki A, Nakamura T, Nakano T, Yoshikawa H, Tsumaki N. Sox9 sustains chondrocyte survival and hypertrophy in part through Pik3ca-Akt pathways. Development. 2011;138:1507–1519. doi: 10.1242/dev.057802. [DOI] [PubMed] [Google Scholar]
- 54.Pritchett J, Athwal V, Roberts N, Hanley NA, Hanley KP. Understanding the role of SOX9 in acquired diseases: lessons from development. Trends Mol Med. 2011;17:166–174. doi: 10.1016/j.molmed.2010.12.001. [DOI] [PubMed] [Google Scholar]
Associated Data
This section collects any data citations, data availability statements, or supplementary materials included in this article.