

Abstract
Objectives
To determine (1) the error attributable to external tibia-length measurements by using peripheral quantitative computed tomography (pQCT) and (2) the effect these errors have on scan location and tibia trabecular bone mineral density (BMD) after spinal cord injury (SCI).
Design
Blinded comparison and criterion standard in matched cohorts.
Setting
Primary care university hospital.
Participants
Eight able-bodied subjects underwent tibia length measurement. A separate cohort of 7 men with SCI and 7 able-bodied age-matched male controls underwent pQCT analysis.
Interventions
Not applicable.
Main Outcome Measures
The projected worst-case tibia-length–measurement error translated into a pQCT slice placement error of ±3mm. We collected pQCT slices at the distal 4% tibia site, 3mm proximal and 3mm distal to that site, and then quantified BMD error attributable to slice placement.
Results
Absolute BMD error was greater for able-bodied than for SCI subjects (5.87mg/cm3 vs 4.5mg/cm3). However, the percentage error in BMD was larger for SCI than able-bodied subjects (4.56% vs 2.23%).
Conclusions
During cross-sectional studies of various populations, BMD differences up to 5% may be attributable to variation in limb-length–measurement error.
Keywords: Bone density, Osteoporosis, Rehabilitation, Spinal cord injuries, Tibia, Tomography, x-ray computed
After spinal cord injury (SCI), paralyzed muscles and atrophybecome highly fatigable.1-4 The loss of regular weight bearing and muscle loading causes rapid bone demineralization (2%–4% per month),5-7 yielding profound disuse osteoporosis in paralyzed limbs.8,9 The lifetime fracture risk for people with SCI is approximately 2 times higher than in able-bodied individuals.10 Fractures readily occur because of low-magnitude forces,10,11 particularly in the distal and proximal epiphyses of long bones.12 These regions contain extensive trabecular bone surrounded by a thin cortical shell.
Quantification of osteoporotic change in these regions has been hindered by technical limitations of dual-energy x-ray absorptiometry (DXA). DXA, as a 2-dimensional scan modality, cannot differentiate between cortical and trabecular bone. Because trabecular bone is more metabolically active and is more responsive to a range of stimuli than cortical bone,13 it may be particularly responsive to changes (increases or decreases) in osteogenic stimuli. A previous study revealed that DXA, but not peripheral quantitative computed tomography (pQCT), failed to detect the large increases in trabecular bone mineral density (BMD) in sheep tibiae that underwent a mechanical loading intervention.14
pQCT is being used to measure the effects of disuse osteoporosis in long bones, particularly at the epiphyses.15-17 pQCT has revealed that after SCI BMD rapidly declines in trabecular bone but not in cortical bone.15,17 Cortical bone appears to respond to long-term unloading by endosteal absorption, which decreases the thickness15,16,18 (and hence, the strength) of the cortical shell.
Numerous studies19-22 have investigated ways to mitigate the deterioration of bone strength after SCI. All have reported only minimal or transient effects. Eser et al,23 by using conventional computed tomography scans, detected no changes in tibia diaphyseal cortical BMD in response to electrically stimulated cycle ergometry in people with SCI.23 Cortical thickness was not examined. De Bruin et al24 used pQCT to detect trends suggesting that early loading may attenuate the decline in distal tibia trabecular BMD.
In studies that measure BMD response to loading, the scan site must be accurately located if between-subject comparisons are to be valid. A primary source of error is that an investigator must first identify external bony landmarks and measure total-limb segment length. In the case of the tibia, by using a scout view (rapid scan) of the ankle joint, the investigator places a reference line at the distal tibial endplate. By using this reference line and the externally measured tibia length, the pQCT scanner gantry advances the requisite distance up the tibia to obtain a scan at 4% of tibia length. The magnitude of BMD error attributable to limb-length measurement is currently unknown. If trabecular BMD is highly variable along the length of the distal tibial epiphysis, then errors in slice placement (because of mismeasurement of tibia length) may lead to false conclusions regarding BMD values across limbs.
Accordingly, the purposes of this study are (1) to determine the error attributable to external measurements of tibia length and (2) to establish the difference in BMD along the distal tibia that may occur as a result of tibia length–measurement errors. We explore the difference in error estimates for people with and without spinal cord injury. We hypothesize that limb-length–measurement error could impact the distal tibia BMD measurements.
METHODS
Participants
Eight able-bodied subjects participated in the first arm of the study, designed to determine the error associated with the external measurement of tibia length. A separate cohort of 7 men with SCI and 7 male age-matched able-bodied control subjects participated in the second portion of the study, designed to explore the error associated with positioning the pQCT slices (table 1). Mean age did not differ between the able-bodied and SCI groups (P=.846). The protocol was approved by the institution’s human subjects institutional review board. All subjects provided written informed consent before participating. Subjects with SCI were at least 2 years postinjury (mean, 12y). Exclusion criteria for all subjects included a history of bone pathology (ie, bone metabolic disease, cancer), previous fracture at the scan site, or current knee or ankle pathology that would compromise limb-length measurement or pQCT scans. SCI subjects were excluded if they experienced frequent spasms that would likely induce pQCT scan artifacts. Demographic data for all subjects appear in tables 1 and 2. Three subjects (S1, S2, S3; see table 2) were concurrently enrolled in a unilateral soleus training program within our laboratory. As such, their right (trained) limbs were not included in this study.
Table 1.
Subject Demographic Data: Subjects Who Participated in the Tibia-Length Measurements
| Subject | Sex | Age | Height (cm) | Weight (kg) |
|---|---|---|---|---|
| 1 | M | 23 | 191 | 80 |
| 2 | M | 23 | 175 | 68 |
| 3 | F | 23 | 170 | 75 |
| 4 | F | 25 | 182 | 70 |
| 5 | F | 23 | 168 | 55 |
| 6 | F | 23 | 168 | 61 |
| 7 | M | 25 | 193 | 93 |
| 8 | M | 23 | 183 | 73 |
Abbreviations: F, female; M, male.
Table 2.
Subject Demographic Data: Subjects Who Underwent pQCT Scanning
| Subject | Age | Height (cm) | Weight (kg) | Years Post SCI | Lesion | ASIA Grade* |
|---|---|---|---|---|---|---|
| S1 | 23 | 188 | 85 | 2 | T4 | A |
| S2 | 25 | 185 | 80 | 3 | T4 | A |
| S3 | 33 | 175 | 113 | 4.5 | T9 | A |
| S4 | 35 | 173 | 60 | 18 | C5-6 | B |
| S5 | 43 | 170 | 61 | 18.5 | C8 | A |
| S6 | 46 | 175 | 71 | 22.5 | C5-6 | B |
| S7 | 74 | 180 | 83 | 18.5 | C5-6 | A |
| A1 | 24 | 180 | 95 | NA | NA | NA |
| A2 | 25 | 178 | 64 | NA | NA | NA |
| A3 | 34 | 175 | 77 | NA | NA | NA |
| A4 | 30 | 193 | 95 | NA | NA | NA |
| A5 | 43 | 173 | 78 | NA | NA | NA |
| A6 | 50 | 175 | 74 | NA | NA | NA |
| A7 | 62 | 188 | 95 | NA | NA | NA |
NOTE. Prefix “S” denotes subjects with SCI, and prefix “A” denotes able-bodied subjects.
Abbreviation: NA, not applicable.
American Spinal Injury Association (ASIA) grade A indicates sensory and motor complete SCI. ASIA grade B indicates complete motor and incomplete sensory SCI.
The strategy used in this study was to first determine the number of millimeters of error that could be expected in an external measurement of tibia length. pQCT slices were then intentionally collected at “erroneous” locations that spanned the number of millimeters of predicted measurement error. We were therefore able to determine the magnitude of trabecular BMD change that could be expected assuming the worst-case tibia-length–measurement error.
Measurement of Tibia Length
Four testers participated in 7 hours of training to establish operational definitions for tibia landmarks and to practice a protocol for measuring tibia length. Each training session lasted between 1 and 2 hours.
Each subject sat on an examination table and placed 1 leg in a figure-of-4 position (the lateral side of 1 foot resting on the contralateral knee). The investigators marked the most distal palpable tip of the medial malleolus and the most proximal edge of the medial tibial plateau with a fine-point pen. The investigators taped an unmarked ribbon to the subject’s leg (without following the contours of the limb). The pen marks were then transferred to the ribbon and measured (by a different investigator) with a tape measure. To avoid bias, the leg marks were washed off between each tester. Each tester measured each subject twice (nonconsecutively) to establish intrarater reliability. Interrater reliability was obtained from among the 4 testers.
pQCT Measurement
pQCT measurements were performed with a Stratec XCT-2000.a Accuracy of this device is 2% (to the COMAC phantom); precision is ±3mg/cm3 for trabecular bone and ±9mg/cm3 for cortical bone.25 This device is calibrated with respect to fat (fat density, 0mg/cm3).
The tibiae of SCI and able-bodied subjects were marked and measured according to the procedure described previously. The investigators passed one of the subject’s limbs through the pQCT gantry and then secured the subject’s foot onto a footplate. Padding was placed under the subject’s knee to distribute pressure between the popliteal fossa and the rigid knee rest. A custom-made laser that emitted a thin beam of light (mounted on top of the pQCT gantry) was used to align the subject’s tibial tuberosity and ankle mortise to standardize limb rotation. By using an inclinometer placed just distal to the tibial tuberosity, the investigators adjusted the vertical height of the footplate to bring the pitch of the shank to horizontal. After positioning the limb, the investigators taped the knee securely into the knee rest to minimize limb movement should spasms or other movement occur.
A radiology technician performed a scout view of the talocrural joint and placed a reference line at the tibial endplate, bisecting the region of highest density at the lateral side of the ultradistal tibia. By using this reference line, the scanner obtained images at 4% of tibia length, at 3mm proximal to 4%, and at 3mm distal to 4% (fig 1A). In this way, the pQCT slices spanned the estimated absolute error (3mm) obtained via tibia-length measurements (see Results section).
Fig 1.
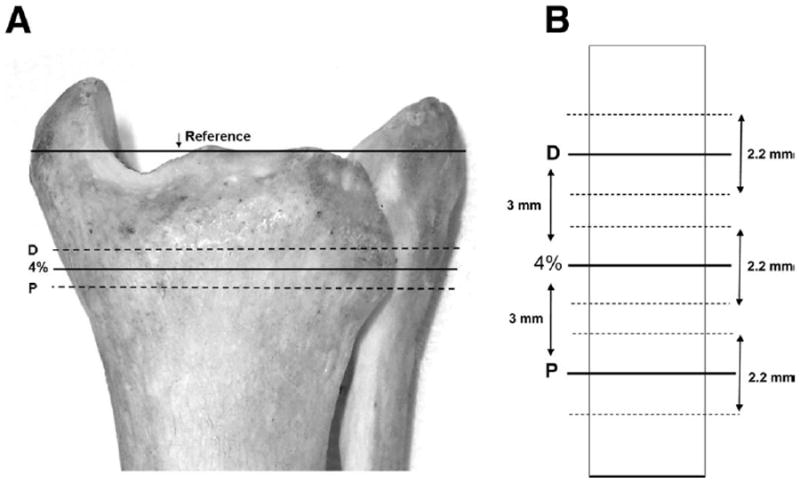
Location of pQCT slices. (A) Scans were obtained at 4% of the distal tibia length, at 3mm distal to 4% (D), and at 3mm proximal to 4% (P). (B) Schematic detail of region surrounding the pQCT slices. Heavy lines indicate the center of each slice. Dashed lines denote the slice thickness (2.2mm).
Voxel size was 0.4mm3, scanner speed was 25mm/s, and slice thickness was 2.2mm (fig 1B). An iterative contour search was used to define the periosteal surface of the bone, based on a threshold density of 200mg/cm3. Within this region, densities higher than 400mg/cm3 were defined as cortical and subcortical bone, and values lower than this threshold were defined as trabecular bone. A 3×3 voxel filter then proofed the cortical and subcortical bone regions to detect pockets of trabecular values. Voxels that had substantially lower BMD than the surrounding voxels were reassigned as trabecular bone. Because the cortical shell is very thin at 4% (and is therefore subject to the partial-volume effect26), we report only trabecular BMD. Two subjects (S4, S6) had sufficiently low BMD that the automated contour-detection algorithms were unable to define the periosteal border. Regions of interest were manually delineated for these subjects.
Statistical Analysis
Tibia-length (in millimeters) repeated measurements were averaged and compared for systematic variation by using paired t tests (α<.05). The absolute error was calculated by taking the absolute value of the difference in tibia lengths between all repeated tibia leg-length tests. Intraclass correlations (1,k) were calculated for all repeated measurements. Correlation coefficients for the tibia length measurements between and within testers were calculated.
Group means and standard deviations were calculated for all pQCT slice locations. The absolute difference in BMD (in mg/cm3) between the calculated 4% slice and the corresponding proximal or distal slice was determined. A split-plot repeated-measures analysis of variance was used to establish the effects of scan location and the effects of SCI. The extent to which the bone density scan site (proximal, 4%, distal) was consistent across subject type (SCI vs able-bodied) was tested first (interaction). In the absence of an interaction, main effects were assessed. Significance was set at P less than .05.
RESULTS
Tibia-Length Error
There was no difference between average repeated tibia-length measurements (P=.94) (fig 2A). The intraclass correlation coefficient (ICC1,k) for all repeated tibia-length measurements was .94, indicating highly consistent measurements among the various individual testers (between-tester reliability). The within-tester reliability was also high, supported by a .98 correlation for individual testers’ repeated measurements. The mean overall absolute tibia-length error among all repeated measurements was 6mm (fig 2B). The worst-case leg-length absolute error translated to 3mm of scan location error (4% of limb length). By using this conservative estimate, we collected pQCT slices at 3mm proximal to and 3mm distal to the “true” 4% tibia site.
Fig 2.
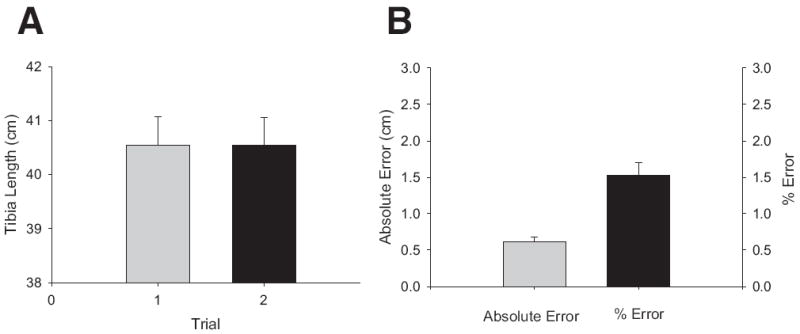
(A) Mean tibia length ± SE for 7 able-bodied subjects measured by 4 raters over 2 trials. (B) Mean absolute error ± SE in tibia length and percent error in tibia length for 7 able-bodied subjects measured by 4 raters (trials 1 and 2 combined).
Able-Bodied Versus SCI
pQCT data for SCI and able-bodied subjects appear in table 3. A representative example of a pQCT scan appears in figure 3. Right- and left-limb BMD did not differ statistically at any scan site (P>0.7 in each case). As such, right and left limbs were pooled for each group (SCI: 11 limbs; able bodied: 14 limbs). The bone density changes across sites (proximal, 4%, distal) were consistent between the SCI group and the able-bodied group and were supported by a nonsignificant interaction (P=.241). A test of main effects indicated that the tibia bone density of the able-bodied group at the 4% site (254.2mg/cm3) was greater than that of the SCI group (113.8 mg/cm3) (P<.001) (fig 4A). Able-bodied BMD was therefore 2.24 times greater than SCI BMD at this site.
Table 3.
pQCT Raw Data
| Subject | 4% (L) | 4% (R) | 3mm Distal (L) | 3mm Distal (R) | 3mm Proximal (L) | 3mm Proximal (R) |
|---|---|---|---|---|---|---|
| S1 | 209.5 | NA | 186.9 | NA | 210.0 | NA |
| S2 | 102.2 | NA | 113.9 | NA | 89.0 | NA |
| S3 | 131.2 | NA | 140.1 | NA | 126.8 | NA |
| S4 | 81.2 | 58.4 | 75.7 | 76.8 | 74.7 | 53.5 |
| S5 | 171.2 | 152.3 | 168.8 | 152.2 | 164.2 | 146.3 |
| S6 | 56.5 | 59.8 | 53.3 | 67.1 | 50.8 | 63.0 |
| S7 | 112.5 | 116.5 | 118.9 | 114.1 | 104.5 | 119.0 |
| A1 | 270.9 | 268.7 | 276.0 | 272.4 | 260.4 | 256.0 |
| A2 | 295.8 | 302.0 | 304.9 | 309.7 | 289.6 | 298.6 |
| A3 | 240.3 | 243.6 | 245.7 | 249.4 | 229.9 | 232.2 |
| A4 | 269.4 | 262.4 | 269.3 | 265.7 | 264.9 | 253.4 |
| A5 | 211.2 | 207.9 | 205.8 | 202.9 | 213.9 | 209.7 |
| A6 | 257.5 | 263.6 | 263.5 | 269.7 | 255.3 | 255.7 |
| A7 | 234.4 | 241.6 | 239.3 | 245.9 | 229.9 | 237.3 |
| SCI* | 123.5±52.5 | 96.8±45.8 | 122.5±47.7 | 102.6±38.8 | 117.1±54.9 | 95.5±44.5 |
| Able-bodied* | 254.2±27.9 | 255.7±29.0 | 257.8±31.1 | 259.4±32.4 | 249.1±25.9 | 249.0±27.4 |
NOTE. Values are in mg/cm3. Subject numbers refer to table 2.
Abbreviations: L, left limb; R, right limb.
Mean ± SD.
Fig 3.
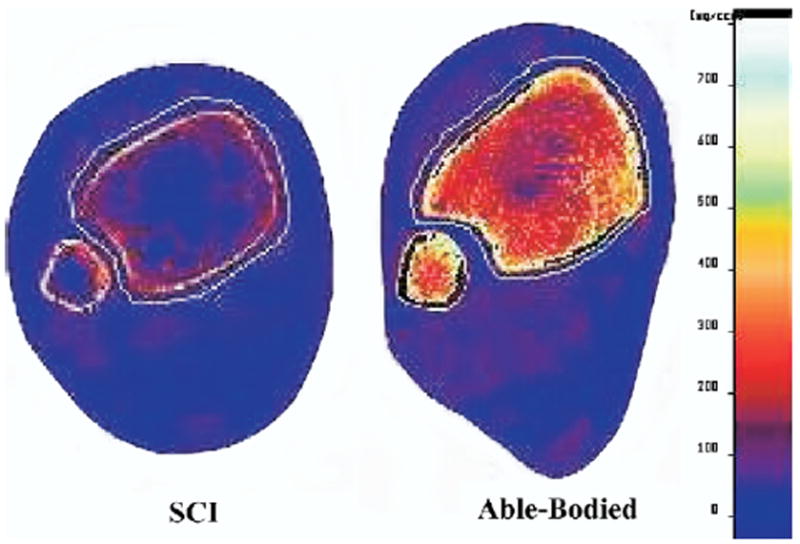
Representative examples of pQCT scans from the 4% tibia site in an SCI and an able-bodied subject. Note the extensive loss of trabecular lattice and the degree of muscular atrophy in the SCI limb.
Fig 4.
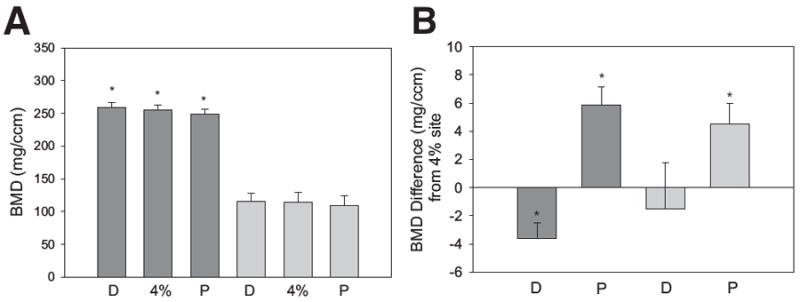
pQCT BMD results. Dark gray bars are mean ± SE for the able-bodied subjects. Light gray bars are mean ± SE for the SCI subjects. (A) Trabecular BMD at the distal (D), 4%, and proximal (P) measurement sites. *Significant difference (P<.05) from the corresponding SCI slice. (B) Difference in BMD from the 4% slice for the distal (D) and proximal (P) sites. *Significant difference from the 4% BMD value (P<.05).
Sensitivity Analysis
For the able-bodied group, trabecular BMD at the distal measurement site was significantly higher than BMD at the 4% site (paired t test, P=.007) (fig 4B). Mean difference ± standard error (SE) in BMD between these 2 sites was −3.65±1.1mg/cm3, a 1.31% difference. BMD at the proximal measurement site was significantly lower than BMD at the 4% site (paired t test, P=.006) (see fig 4B). Mean difference ± SE in BMD between these 2 sites was 5.87±1.3mg/cm3, a 2.23% difference.
For the SCI group, trabecular BMD at the distal measurement site did not differ significantly from BMD at the 4% site (paired t test, P=.65) (see fig 4B). Mean difference ± SE in BMD between these 2 sites was −1.5±3.2mg/cm3, a 3.72% difference. BMD at the proximal measurement site was significantly lower than BMD at the 4% site (paired t test, P=.01) (see fig 4B). Mean difference ± SE in BMD between these 2 sites was 4.5±1.5mg/cm3, a 4.56% difference.
DISCUSSION
Interventions that aim to attenuate the decline of BMD after SCI must yield an effect size that exceeds the measurement error of the BMD measurement device. Because the location of pQCT scan slices depends partly on externally measured tibia length, we estimated the error that could occur during a realistic instance of mismeasurement of limb length. We then obtained pQCT scans at locations indicated by this estimate. We found that trabecular BMD generally decreased as the scans moved proximally along the tibia. The effect of mismeasurement of tibia length appears to be more systematic in able-bodied subjects. (In figure 4B, able-bodied BMD differed significantly among and across the 3 measurement sites. This was not the case for SCI subjects.) Although absolute differences (in mg/cm3) between “true” and “erroneous” sites were higher for able-bodied subjects (see fig 4B), these differences represent a greater percentage of the total BMD for the SCI group (3.72% and 4.56% vs 1.31% and 2.23% for the able bodied).
Magnitude of BMD Loss After SCI
The degree of bone mineral loss sustained by subjects in the present study was less than previous reports performed by using pQCT. At the 4% tibia site, others have reported mean trabecular BMD of 68.416 and 66.1mg/cm3.15 Only 2 subjects (S4, S6) had BMD values in that range (see table 3). One possible reason for this minor discrepancy was that subjects S1, S2, and S7 in the present study reported that they engaged in limited passive standing as a home-based exercise. It is unclear whether any subjects in the study by Eser et al16 engaged in standing. Although 1 previous report27 suggested that passive standing did not yield improvements in BMD, 2 recent pQCT studies17,24 hinted that passive standing could possibly attenuate the decline in distal tibia trabecular BMD. This possibility has not yet been systematically studied with pQCT.
A more likely source for the differences in BMD observed between the present study and previous reports is the method used to delineate trabecular area. In the present study, after bone area was defined by a contour search, we applied thresholds and a filter to eliminate cortical voxels. Trabecular BMD was reported as the mean obtained from the remaining voxels. In the previous reports, the contour search and threshold steps were followed by a concentric peel process that stripped away rings of voxels until 45% of the original bone area remained.15,16 As can be seen in figure 2, this central core region is largely comprised of fatty marrow in subjects with SCI; little trabecular lattice remains intact. Because we sampled trabecular BMD from the entire bone area (except the cortical shell), we likely included greater numbers of surviving trabeculae in our analysis, elevating our BMD values. Although we favor our present method of allocating trabecular voxels, much discussion is ongoing regarding the optimal way to measure very osteoporotic bone. This highlights the need for additional pQCT studies in subjects with SCI.
BMD in Able-Bodied Versus SCI
Trabecular BMD systematically decreased from the distal to the proximal measurement sites in the able-bodied subjects (see fig 4B). In contrast, no such pattern emerged for the SCI group, most likely because the loss of trabecular bone was so extensive. Thus, for SCI subjects, if mismeasurement of tibia length occurred, one would be less able to predict whether the BMD obtained was higher or lower than it should rightfully have been. In figure 1A, the scout view reference line rests on the tibial endplate. Because this structure is not palpable, we marked the most distal palpable limit of the medial malleolus (as have other investigators15,16,18,23). Tibia lengths obtained via this method are inherently greater than the lengths that would be obtained if the tibial endplate itself was the reference point for the distal tibia. Regardless, the same method was applied to both groups (SCI, able-bodied); thus, the relative 4% site should be consistent for the between-group comparisons.
Measurement Sensitivity of pQCT
Repeated measurements of tibia length were highly correlated among 4 testers (ICC1,k=.94). Similarly, within-tester correlations were high (r2=.97). Under these conditions, overall absolute tibia-length error was found to be 6mm. Thus, by using our operational definitions of tibia length and our method of tibia measurement, scan-slice placement can be expected to vary by .24mm. Under our worst-case tibia-length–measurement error (3-mm error in slice placement), BMD error was between 1.31% and 2.23% for able-bodied subjects and between 3.72% and 4.56% for subjects with SCI.
The error associated with limb length is likely to be most important when comparing different populations in a 1-time cross-sectional analysis. Conversely, the error associated with limb length is likely to be minimal during longitudinal studies. At an initial session, tibia-length–measurement error may cause variation in pQCT slice placement across subjects, in accordance with the estimates put forth in this study. However, repeated scans in a single person would not be subject to this source of error because tibia length is not remeasured with each successive scan. Rather, the scout view for a new scan can be displayed alongside the scout view for a previous scan, allowing the investigator to place the reference line in the same anatomic location with each successive scan. Because the tibia length obtained at the initial session is used throughout the study, future scan sites will very closely replicate earlier sites. The degree of change observed in each person’s response to an intervention should be free of the tibia measurement error reported in the present study. (Two important caveats should be made. First, the simultaneous scout view feature may not be available on all pQCT devices. Second, tibia-length–measurement error may play a larger role in studies of growing children who require new measurements of tibia length with each scan.)
Because pQCT is a relatively new technology (vs DXA), only a handful of studies have used it to investigate BMD interventions after SCI. Two previous studies17,24 have suggested that standing or assisted ambulation after SCI may attenuate the decline in distal tibia trabecular BMD. De Bruin et al24 report that immobilized subjects lost between 6.9% and 9.4% of distal tibia trabecular BMD in 25 weeks after SCI. Subjects who passively stood or who engaged in weight-assisted treadmill ambulation only lost between 0.3% and 1.4% in the same timeframe. Frey-Rindova et al17 report that standing had no mitigating effect on BMD loss for the majority of subjects. On average, trabecular BMD declined by 15% after 1 year. However, 2 subjects who stood for 1 hour a day on 4 days a week lost only 3% and 1.5% of distal tibia trabecular BMD after 2 years.
These 2 pQCT-based BMD intervention studies did not specifically measure BMD at 4%. Rather, several stacks of images were analyzed “near the ankle joint”24 or “at the ultra-distal tibia.”17 We are aware of only 2 previous SCI BMD intervention studies that positioned slices according to a percentage of tibia length. The first (by using conventional computed tomography) considered cortical BMD at the tibial diaphysis (50% of tibia length) but did not examine the distal tibia 4% site.23 We have recently used pQCT to study BMD after a 2.5-year unilateral isometric soleus muscle electric stimulation protocol.28 Longitudinal studies are currently underway to assess the efficacy of this loading paradigm at the distal femur and proximal tibia, the 2 most prevalent locations for post-SCI fracture.12
Overall, the primary reason for analysis placement errors relates to identifying the tibia joint endplate during a scout scan or because of an error in externally measuring the limb-segment length. We suggest that clinical and technical personnel who take pQCT measurements should use consistent methods to determine tibia length and periodically repeat measurements to establish a high level of repeatability. In addition, interpretation of the tibia endplate should be routinely revisited among all staff performing these measurements to ensure a high level of scan-site accuracy.
CONCLUSIONS
pQCT slice placement may vary among subjects by as much as 3mm when external measurements of tibia length are used. Percentage error in BMD because of erroneous slice placement may be as high as 2.23% in able-bodied subjects and 4.56% in people with SCI. This source of error underscores the importance of an effect size greater than 5% when performing cross-sectional analysis on groups with varied levels of activity and loading. Future studies should consider this potential source of error when determining the efficacy of interventions to preserve tibia BMD after SCI.
Acknowledgments
We thank Deanna Frei, RTR, CT, April Miller, RTR, and Dan Schiferl for their technical expertise.
Supported by the National Center for Medical Rehabilitation Research (grant no. R01-HD 39445), the Christopher Reeve Paralysis Foundation, and the Foundation for Physical Therapy Inc (scholarship).
Footnotes
No commercial party having a direct financial interest in the results of the research supporting this article has or will confer a benefit upon the author(s) or upon any organization with which the author(s) is/are associated.
Supplier Stratec Medizinintechnik GmbH, Durlacher Str 35, D-75172 Pfor-zheim, Germany.
References
- 1.Shields RK. Fatigability, relaxation properties, and electromyo-graphic responses of the human paralyzed soleus muscle. J Neurophysiol. 1995;73:2195–206. doi: 10.1152/jn.1995.73.6.2195. [DOI] [PubMed] [Google Scholar]
- 2.Shields RK, Chang YJ. The effects of fatigue on the torque-frequency curve of the human paralysed soleus muscle. J Electromyogr Kinesiol. 1997;7:3–13. doi: 10.1016/s1050-6411(96)00015-6. [DOI] [PubMed] [Google Scholar]
- 3.Shields RK. Muscular, skeletal, and neural adaptations following spinal cord injury. J Orthop Sports Phys Ther. 2002;32:65–74. doi: 10.2519/jospt.2002.32.2.65. [DOI] [PMC free article] [PubMed] [Google Scholar]
- 4.Frey Law LA, Shields RK. Predicting human chronically paralyzed muscle force: a comparison of three mathematical models. J Appl Physiol. 2006;100:1027–36. doi: 10.1152/japplphysiol.00935.2005. [DOI] [PMC free article] [PubMed] [Google Scholar]
- 5.Wilmet E, Ismail AA, Heilporn A, Welraeds D, Bergmann P. Longitudinal study of the bone mineral content and of soft tissue composition after spinal cord section. Paraplegia. 1995;33:674–7. doi: 10.1038/sc.1995.141. [DOI] [PubMed] [Google Scholar]
- 6.Biering-Sorensen F, Bohr HH, Schaadt OP. Longitudinal study of bone mineral content in the lumbar spine, the forearm and the lower extremities after spinal cord injury. Eur J Clin Invest. 1990;20:330–5. doi: 10.1111/j.1365-2362.1990.tb01865.x. [DOI] [PubMed] [Google Scholar]
- 7.Garland DE, Stewart CA, Adkins RH, et al. Osteoporosis after spinal cord injury. J Orthop Res. 1992;10:371–8. doi: 10.1002/jor.1100100309. [DOI] [PubMed] [Google Scholar]
- 8.Shields RK, Dudley-Javoroski S, Law LA. Electrically induced muscle contractions influence bone density decline after spinal cord injury. Spine. 2006;31:548–53. doi: 10.1097/01.brs.0000201303.49308.a8. [DOI] [PMC free article] [PubMed] [Google Scholar]
- 9.Shields RK, Schlechte J, Dudley-Javoroski S, et al. Bone mineral density after spinal cord injury: a reliable method for knee measurement. Arch Phys Med Rehabil. 2005;86:1969–73. doi: 10.1016/j.apmr.2005.06.001. [DOI] [PMC free article] [PubMed] [Google Scholar]
- 10.Vestergaard P, Krogh K, Rejnmark L, Mosekilde L. Fracture rates and risk factors for fractures in patients with spinal cord injury. Spinal Cord. 1998;36:790–6. doi: 10.1038/sj.sc.3100648. [DOI] [PubMed] [Google Scholar]
- 11.Keating JF, Kerr M, Delargy M. Minimal trauma causing fractures in patients with spinal cord injury. Disabil Rehabil. 1992;14:108–9. doi: 10.3109/09638289209167081. [DOI] [PubMed] [Google Scholar]
- 12.Comarr AE, Hutchinson RH, Bors E. Extremity fractures of patients with spinal cord injuries. Am J Surg. 1962;103:732–9. doi: 10.1016/0002-9610(62)90256-8. [DOI] [PubMed] [Google Scholar]
- 13.Snyder WS, editor. Report of the task group on reference man. Oxford: Pergamon; 1975. [Google Scholar]
- 14.Rubin C, Turner AS, Mallinckrodt C, Jerome C, McLeod K, Bain S. Mechanical strain, induced noninvasively in the high-frequency domain, is anabolic to cancellous bone, but not cortical bone. Bone. 2002;30:445–52. doi: 10.1016/s8756-3282(01)00689-5. [DOI] [PubMed] [Google Scholar]
- 15.Eser P, Frotzler A, Zehnder Y, et al. Relationship between the duration of paralysis and bone structure: a pQCT study of spinal cord injured individuals. Bone. 2004;34:869–80. doi: 10.1016/j.bone.2004.01.001. [DOI] [PubMed] [Google Scholar]
- 16.Eser P, Frotzler A, Zehnder Y, Denoth J. Fracture threshold in the femur and tibia of people with spinal cord injury as determined by peripheral quantitative computed tomography. Arch Phys Med Rehabil. 2005;86:498–504. doi: 10.1016/j.apmr.2004.09.006. [DOI] [PubMed] [Google Scholar]
- 17.Frey-Rindova P, de Bruin ED, Stussi E, Dambacher MA, Dietz V. Bone mineral density in upper and lower extremities during 12 months after spinal cord injury measured by peripheral quantitative computed tomography. Spinal Cord. 2000;38:26–32. doi: 10.1038/sj.sc.3100905. [DOI] [PubMed] [Google Scholar]
- 18.Eser P, Frotzler A, Zehnder Y, Schiessl H, Denoth J. Assessment of anthropometric, systemic, and lifestyle factors influencing bone status in the legs of spinal cord injured individuals. Osteoporos Int. 2005;16:26–34. doi: 10.1007/s00198-004-1638-x. [DOI] [PubMed] [Google Scholar]
- 19.BeDell KK, Scremin AM, Perell KL, Kunkel CF. Effects of functional electrical stimulation-induced lower extremity cycling on bone density of spinal cord-injured patients. Am J Phys Med Rehabil. 1996;75:29–34. doi: 10.1097/00002060-199601000-00008. [DOI] [PubMed] [Google Scholar]
- 20.Mohr T, Podenphant J, Biering-Sorensen F, Galbo H, Thamsborg G, Kjaer M. Increased bone mineral density after prolonged electrically induced cycle training of paralyzed limbs in spinal cord injured man. Calcif Tissue Int. 1997;61:22–5. doi: 10.1007/s002239900286. [DOI] [PubMed] [Google Scholar]
- 21.Belanger M, Stein RB, Wheeler GD, Gordon T, Leduc B. Electrical stimulation: can it increase muscle strength and reverse osteopenia in spinal cord injured individuals? Arch Phys Med Rehabil. 2000;81:1090–8. doi: 10.1053/apmr.2000.7170. [DOI] [PubMed] [Google Scholar]
- 22.Bloomfield SA, Mysiw WJ, Jackson RD. Bone mass and endocrine adaptations to training in spinal cord injured individuals. Bone. 1996;19:61–8. doi: 10.1016/8756-3282(96)00109-3. [DOI] [PubMed] [Google Scholar]
- 23.Eser P, de Bruin ED, Telley I, Lechner HE, Knecht H, Stussi E. Effect of electrical stimulation-induced cycling on bone mineral density in spinal cord-injured patients. Eur J Clin Invest. 2003;33:412–9. doi: 10.1046/j.1365-2362.2003.01156.x. [DOI] [PubMed] [Google Scholar]
- 24.de Bruin ED, Frey-Rindova P, Herzog RE, Dietz V, Dambacher MA, Stussi E. Changes of tibia bone properties after spinal cord injury: effects of early intervention. Arch Phys Med Rehabil. 1999;80:214–20. doi: 10.1016/s0003-9993(99)90124-7. [DOI] [PubMed] [Google Scholar]
- 25.Norland Medical Systems. XCT 2000 technical reference. White Plains: Norland Medical Systems Inc; 2000. [Google Scholar]
- 26.Hangartner TN, Gilsanz V. Evaluation of cortical bone by computed tomography. J Bone Miner Res. 1996;11:1518–25. doi: 10.1002/jbmr.5650111019. [DOI] [PubMed] [Google Scholar]
- 27.Kunkel CF, Scremin AM, Eisenberg B, Garcia JF, Roberts S, Martinez S. Effect of “standing” on spasticity, contracture, and osteoporosis in paralyzed males. Arch Phys Med Rehabil. 1993;74:73–8. [PubMed] [Google Scholar]
- 28.Shields RK, Dudley-Javoroski S, Deshpande P, Madhavan S. Minimal dose of electrical stimulation training adapts skeletal muscle after spinal cord injury. Presented to: American College of Sports Medicine annual meeting; 2005 June 1-4; Nashville (TN). [Google Scholar]