

Abstract
A model-based method for calculating three-dimensional (3D) cardiac wall strain distributions in the mouse has been developed and tested in a genetically engineered mouse model of dilated cardiomyopathy. Data from MR tagging and harmonic phase (HARP) tracking were used to measure material point displacements, and 3D Lagrangian strains were calculated throughout the entire left ventricle (LV) with a deformable parametric model. A mouse model where cardiomyocytes are specifically made deficient in vinculin (VclKO) were compared to wild-type (WT) littermates. 3D strain analysis revealed differences in LV wall mechanics between WT and VclKO mice at 8 weeks of age when systolic function had just begun to decline. Most notably, end-systolic radial strain and torsional shear were reduced in VclKO hearts which contributed to regional mechanical dysfunction. This study demonstrates the feasibility of using MRI tagging methods to detect alterations in 3D myocardial strain distributions in genetically engineered mouse models of cardiovascular disease.
Keywords: SPAMM, HARP, 3D strain, transgenic mouse
INTRODUCTION
The mouse has become an important model in cardiovascular research. Gene-targeted mice are frequently used to study the molecular basis of cardiac diseases. In doing so, mouse models of cardiomyopathies with inherent ventricular hypertrophy, dilatation, or diastolic/systolic dysfunction are created and analyzed using a range of physiological techniques (1–4). Despite the progress in using these models to study the biological basis of cardiovascular disease, measuring regional cardiac function in vivo in the mouse is challenging due to the small size and fast beating rate of the mouse heart. Magnetic resonance imaging (MRI) is a technique commonly used to quantify global geometric and functional parameters of the mouse heart in vivo such as wall mass, cavity volumes, stroke volume, and ejection fraction (5–7). With MR tagging techniques, myocardial motion and regional strain can also be studied. Ventricular torsion (8, 9) and 2-D strains (10–12) have been measured in the mouse LV using MR tagging.
Nevertheless, for a complete description of myocardial tissue deformation, the spatial distributions of the nonhomogeneous 3D strain tensor components need to be measured throughout the ventricular myocardium, including transmurally. Regional heterogeneities in function are important to characterize, particularly in diseased hearts. For example, in dilated cardiomyopathy (DCM) the transmural gradient in radial strain is reduced, which can adversely affect global function (13). Using tagged MRI, 3D strains have been measured in healthy and diseased large animal and human hearts (14–17). In the mouse heart, 3D strains from MR tagging have been calculated by adopting techniques used in larger hearts such as homogenous strain analysis (18) or finite element analysis (19). Previous studies have mainly focused on characterizing function in normal hearts or myocardial infarction models (19); however, MRI has only been used to measure regional function in few genetically engineered mouse models of cardiovascular disease (20–21).
Here we describe a method that combines MRI tagging, automated material point tracking, and anatomically accurate finite element models to calculate non-homogeneous 3D finite strain distributions in the mouse LV throughout the cardiac cycle. These methods were sufficiently sensitive to detect significant regional differences in systolic wall thickening and shear strains between a genetically engineered mouse model and WT littermate controls, prior to the onset of overt heart failure. End-systolic radial strain and torsional shear were reduced in genetically engineered hearts and found to contribute to regional mechanical dysfunction.
METHODS
Mouse Model
A mouse model with cardiomyocyte-specific excision of the vinculin gene (VclKO) starting soon after birth (22) was previously characterized by us and seen to develop overt DCM by 16 weeks of age. Eight week-old male VclKO mice (n = 5) and WT littermates (n = 5) with no Vcl excision were used for the MRI study. All protocols were performed according to the National Institutes of Health’s Guide for the Care and Use of Laboratory Animals and approved by the UCSD Animal Subjects Committee.
Animal Preparation and Monitoring
The mice were initially sedated with 5 vol-% isoflurane in 100% O2 and transferred to a custom built restraint unit which was centered within a quadrature volume coil with an inner diameter of 2.5 cm (Bruker, Germany). In the RF coil, the mouse remained sedated in a supine position with 1.5 vol-% isoflurane being delivered through a nose cone at 1.5 L/min. MR compatible ECG leads were inserted subcutaneously into the front paws of the mouse. ECG and body temperature were monitored with the MR compatible SAII Model 1025 monitoring and gating system (SA Instruments, Inc., Stony Brook, NY, USA). The heart rate was maintained at 400 ± 10 BPM. The bore temperature was regulated using heated airflow to maintain the mice at 36–38°C.
MRI
The MRI protocol was performed on a 7T horizontal-bore magnet (Varian, Palo Alto, CA, USA) with an Avance II console (Bruker, Germany). The scanner is equipped with a gradient system capable of 100mT/m gradient strength and maximum ramp time of 210 μsec.
An ECG-triggered 2D fast gradient echo pulse sequence was used for cine imaging with the following parameters: TE = 2.3 ms, TR = 6 ms, flip angle = 15°, 1 mm slice thickness, and 4 averages. Multiple averages were used to increase SNR and decrease the effect of respiratory motion artifacts. A field of view of 2.0 cm and data matrix of 128×128 were prescribed for an in-plane resolution of (156 um)2. Depending on the heart rate, 20–23 cardiac phases were reconstructed.
For MRI tagging, a Spatial Modulation of Magnetization (SPAMM) sequence was used to create images with a periodic pattern of stripes that move with the heart wall (23). A tagging module (7 ms duration) containing sinc-modulated RF pulse trains (3 RF pulses) was applied after the detection of the R wave to produce a tagging grid with a tag distance of 0.9 mm and tag width of 0.31 mm. All other parameters were matched to the cine image acquisition.
In the image acquisition, the long axis of the LV was first identified. Five contiguous short axis slices perpendicular to the long axis of the LV were acquired. Then 3 longitudinal slices centered about the long axis of the LV were obtained (FIG. 1). The first long axis slice bisected the septal wall and each successive slice was separated radially by 60°. Both cine and tagged images were acquired for all slice locations. The entire imaging protocol took approximately 1.5 hours for each mouse.
FIG. 1.

Imaging protocol includes 5 short axis slices and 3 long axis slices. Both cine and tagged images are acquired at each location.
Image Analysis
For each slice location, the first frame of the cine acquisition was used for segmentation of the LV myocardium at end-diastole. A semiautomatic level set algorithm available in the ITK-SNAP software (24) was used to extract the LV endocardial and epicardial boundaries.
The SPAMM image sequence corresponding to the same slice location was used for 2D material point tracking. Harmonic Phase (HARP) analysis was used to automatically track material points through the cardiac cycle (25). First, the end diastolic frame of the SPAMM image sequence was transformed by a 2D Fast Fourier Transform (FFT) into the frequency domain. The spectral peak located at the first positive harmonic frequency in each tag direction was isolated with a bandpass filter with a radius of half the tagging frequency. The inverse FFT of each filtered spectral peak resulted in a complex image from which a phase map was obtained. Every pixel in the myocardium contains a pair of phases (one for each tag direction) which are time invariant (25). Therefore, material points at the center of each pixel within the LV myocardium were tracked by matching their harmonic phase pairs between different time points of the cardiac cycle (FIG. 2). Depending on the wall thickness, up to 8 material points could be obtained transmurally. Due to the discrete nature of the images, linear interpolation between pixels was used to find phase positions with subpixel resolution. Using HARP analysis, the 2D displacement of each material point was calculated.
FIG. 2.

Material points are tracked from end-diastole to end-systole using HARP analysis
Geometric Model
A geometric model of the end-diastolic LV was created using prolate spheroidal bi-cubic Hermite finite element surface meshes (FIG. 3A) which were fit to LV endocardial and epicardial boundary points (26, 27). The fit was performed using a least squares minimization of the λ coordinate with bicubic Hermite interpolation. A 3D bicubic-linear mesh was created from the endocardial and epicardial surfaces (FIG. 3B) and then converted into 3D rectangular Cartesian coordinates with tricubic basis functions. The final mesh had 16 elements (FIG. 3C). The mesh was oriented such that the X-axis was along the long-axis of the LV and the Y-axis bisected the septal wall. Cavity and element volumes were measured directly from the 3D mesh. Wall mass was calculated by multiplying wall volume by the myocardial density (1.05 g/ml).
FIG. 3.
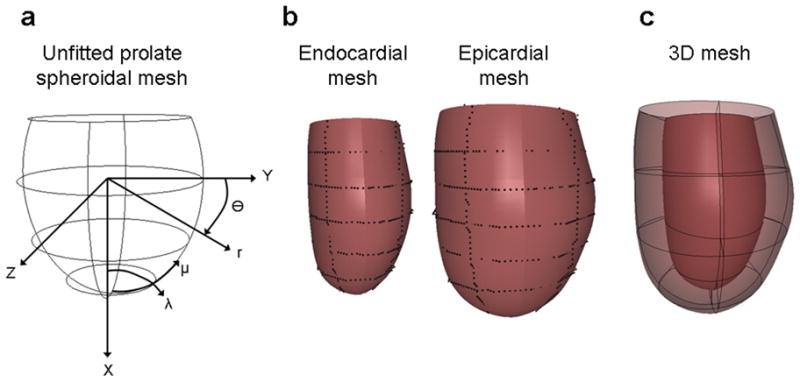
(a) Prolate spheroidal mesh is fitted to (b) endocardial and epicardial points to create (c) a 3D mesh of the LV.
Strain Analysis
A deformable model was used to calculate Lagrangian 3D strains throughout the LV. The end-diastolic geometry is used for the undeformed reference state. The model is deformed to fit material point coordinates throughout the cardiac cycle using a least squares fit of tricubic Hermite deformed nodal coordinate parameters with the following objective function (28):
| [1] |
Xd are the measured coordinates and X(ξd) is the interpolated value of ξd which is defined by the projection of the measured point onto a surface. The difference field u is equal to X-X0 where X0 is the initial estimate of the shape. Since the HARP analysis doesn’t provide information about through plane motion, the data weights, γd, were adjusted according to the orientation of the MR slice. Displacement data from short-axis images (FIG. 4A) were assigned weights of zero in the X direction and data from long-axis images (FIG. 4B) were assigned zero weights in the Y and Z directions. Thus, the through plane motion was accounted for by only fitting Y and Z components of the model to displacements from short-axis images and only fitting X components to displacements from long-axis images. To regularize the fits, a smoothing function was included. The α and β smoothing weights penalized excessive changes in the first and second derivatives of u. An analysis was performed to find the maximal values of the smoothing weights for the mesh that would not increase the fitting errors significantly beyond the estimated measurement accuracy (28).
FIG. 4.

Undeformed material points from (a) short axis images and (b) long axis images.
Once the deformed x(ξ) and undeformed X(ξ) coordinates were fitted, the deformation gradient tensor was obtained by the chain rule using derivatives of the fitted cubic Hermite interpolation functions:
| [2] |
The Lagrangian strain tensor, E, was calculated from the deformation gradient tensor, F:
| [3] |
Statistics
All measurements are presented as mean ± SD. Student’s t-test was used to compare end systolic strains, torsion, and geometry measurements between VclKO and WT mice. Strain time courses were compared by two-way repeated measures ANOVA. P values < 0.05 were considered significant.
RESULTS
Geometric Models
A representative WT model at end-diastole is shown in FIG. 3C with a RMS fitting error of 0.10 mm. From the geometric models, end-diastolic volume (EDV), end-systolic volume (ESV), and ejection fraction (EF) were calculated. In WT mice, EDV = 45 ± 4 ul, ESV = 22 ± 4 ul, and EF = 53 ± 4 %. These values were significantly different in the VclKO mice with EDV = 63 ± 2 ul, ESV = 37 ± 3 ul, and EF = 41 ± 6 % (P < 0.05). The larger EDV and lower EF in VclKOs indicate ventricular dilation and systolic dysfunction. The wall thickness at the middle of the LV free wall was 1.2 ± 0.2 mm in WTs and 1.0 ± 0.1 mm in VclKOs. The VclKO wall was slightly thinner than the WT wall but not significantly different. LV mass was normalized by body mass (LVMI). LVMI was 4.3 ± 0.3 mg/g in VclKOs and 3.9 ± 0.4 mg/g in WT mice. LVMI was significantly higher in VclKO mice (P <0.05), which suggests that there is cardiac hypertrophy. However, lung and liver weights were not significantly different between VclKO and WT mice indicating that the VclKO mice were not in decompensated heart failure.
Fitting Error Analysis
Approximately 480 ± 75 and 546 ± 89 material points were tracked respectively for each short-axis and long-axis image. To find the optimal smoothing weights for the data fitting, α and β were varied over a wide range of values. A representative plot of RMS fitting error for end systole is shown in FIG. 5A. When holding α/β constant, the optimal ratio for the lowest error was α/β = 10. This holds for all coordinates as well as VclKO and WT hearts. With this ratio of smoothing weights, first-order derivatives were penalized the most and a smaller penalty was imposed on the second-order derivatives and cross derivatives. FIG. 5B is a box and whisker plot of the variation of RMS error over different α values with α/β = 10. The RMS error begins to increase more rapidly at α = 1. Choosing α to be between 0.1 and 1 allows for the RMS fitting error to be similar to the estimated HARP measurement error of 0.08 pixels which is 0.013 mm (25).
FIG. 5.

(a) RMS error over a range of β and α smoothing weights. Keeping α/β constant, the lowest error trajectory falls on the solid line where α/β = 10. (b) RMS error over a range of α weights with α/β = 10.
To validate the accuracy of the deformable model, end-systolic cavity and wall volumes were compared with corresponding volumes from a geometric model created directly from cine MR images at end systole of the same mouse heart (FIG. 6). Linear regression analysis showed a strong correlation between the ESVs calculated from the deformable model and the MR-derived geometric model (R = 0.95). LV wall volumes were also strongly correlated (R = 0.92).
FIG. 6.

Linear regression analysis shows strong correlations between (a) ESV and (b) wall volumes derived from the deformable model and corresponding volumes derived from non-tagged MRI.
3D Strain Analysis
FIG. 7 shows representative 3D end systolic strain maps from a KO and WT heart, which allow for easy visualization of regional strain variations throughout the entire LV. The maps show smoothly varying strain distributions along the posterior LV endocardium and transmurally through the septal and lateral walls. Table 1 compares end-systolic strains between VclKO and WT hearts at different transmural locations in the lateral free wall. The basal and apical locations correspond respectively to the most basal and apical short-axis slice locations. In WT mice, the radial strain (Err) was positive which indicates systolic wall thickening. Both the longitudinal and circumferential strains (Ell and Ecc respectively) were negative indicating shortening in those directions. The torsional shear (Ecl) was positive, consistent with expected right-handed twist, and all shear components were non-zero. In VclKOs, Err was significantly lower than in WT mice at the endocardium in the mid-ventricle and apex (P <0.05), indicating reduced systolic wall thickening in these regions. In FIG.8, the average Err in several transmural segments of the lateral wall are plotted for representative WT and VclKO hearts. In the WT heart, there is a transmural Err gradient which is diminished in the VclKO hearts. The Ecr transverse shear was also significantly lower in the apical wall, and the torsional shear (Ecl) was significantly lower in the mid ventricle (P < 0.05). From the deformable models, peak torsion was 40 ± 6 degrees/cm in WT hearts. Peak torsion in VclKOs was 25 ± 6 degrees/cm and significantly lower than WT values (P < 0.05).
FIG. 7.

(a) 3D end-systolic strain maps of the LV in representative WT and VclKO hearts. Transmural strain distributions are shown at the septal (S) and lateral wall (L). Endocardial strains are displayed on the posterior wall (P). The normal strain tensor components are circumferential strain (Ecc), longitudinal strain (Ell), and radial strain (Err). (b) The shear strain tensor components are torsional shear (Ecl), and the transverse shears (Ecr, Elr).
Table 1.
3D Lagrangian strain tensor components in the LV lateral wall of WT and VclKO hearts
| Basal | Equatorial | Apical | ||||||||
|---|---|---|---|---|---|---|---|---|---|---|
| endo | mid | epi | endo | mid | epi | endo | mid | epi | ||
| Ecc | WT | −0.13 ± 0.05 | −0.07 ± 0.02 | −0.05 ± 0.01 | −0.17 ± 0.03 | −0.12 ± 0.05 | −0.10 ± 0.04 | −0.17 ± 0.06 | −0.12 ± 0.07 | −0.09 ± 0.05 |
| KO | −0.11 ± 0.04 | −0.09 ± 0.02 | −0.06 ± 0.02 | −0.13 ± 0.05 | −0.12 ± 0.03 | −0.09 ± 0.02 | −0.16 ± 0.05 | −0.13 ± 0.02 | −0.09 ± 0.02 | |
|
| ||||||||||
| Ell | WT | −0.13 ± 0.04 | −0.13 ± 0.04 | −0.11 ± 0.05 | −0.13 ± 0.05 | −0.13 ± 0.04 | −0.12 ± 0.03 | −0.17 ± 0.04 | −0.16 ± 0.04 | −0.15 ± 0.05 |
| KO | −0.09 ± 0.03 | −0.10 ± 0.03 | −0.09 ± 0.03 | −0.13 ± 0.02 | −0.12 ± 0.02 | −0.11 ± 0.03 | −0.13 ± 0.02* | −0.12 ± 0.01 | −0.10 ± 0.01 | |
|
| ||||||||||
| Err | WT | 0.25 ± 0.11 | 0.19 ± 0.08 | 0.10 ± 0.04 | 0.39 ± 0.15 | 0.25 ± 0.13 | 0.12 ± 0.09 | 0.20 ± 0.07 | 0.15 ± 0.05 | 0.11 ± 0.04 |
| KO | 0.13 ± 0.07 | 0.14 ± 0.09 | 0.09 ± 0.07 | 0.09 ± 0.03* | 0.12 ± 0.05 | 0.13 ± 0.09 | 0.09 ± 0.06* | 0.12 ± 0.07 | 0.14 ± 0.08 | |
|
| ||||||||||
| Ecl | WT | 0.02 ± 0.01 | 0.03 ± 0.02 | 0.02 ± 0.01 | 0.05 ± 0.02 | 0.05 ± 0.02 | 0.05 ± 0.01 | 0.02 ± 0.03 | 0.02 ± 0.02 | 0.01 ± 0.02 |
| KO | 0.01 ± 0.02 | 0.02 ± 0.02 | 0.01 ± 0.01 | 0.02 ± 0.01* | 0.03 ± 0.02 | 0.02 ± 0.02* | 0.02 ± 0.01 | 0.01 ± 0.01 | 0.00 ± 0.01 | |
|
| ||||||||||
| Ecr | WT | −0.06 ± 0.06 | −0.07 ± 0.07 | −0.10 ± 0.09 | 0.00 ± 0.05 | 0.01 ± 0.03 | 0.00 ± 0.02 | 0.07 ± 0.04 | 0.10 ± 0.04 | 0.05 ± 0.05 |
| KO | −0.01 ± 0.03 | −0.05 ± 0.07 | −0.06 ± 0.07 | 0.00 ± 0.05 | −0.03 ± 0.03 | −0.05 ± 0.06 | 0.01 ± 0.03* | 0.01 ± 0.03* | 0.01 ± 0.04 | |
|
| ||||||||||
| Elr | WT | 0.07 ± 0.10 | 0.05 ± 0.10 | −0.01 ± 0.07 | −0.01 ± 0.03 | −0.02 ± 0.03 | 0.00 ± 0.02 | −0.04 ± 0.02 | −0.02 ± 0.03 | −0.02 ± 0.02 |
| KO | 0.02 ± 0.08 | 0.02 ± 0.07 | 0.01 ± 0.06 | −0.01 ± 0.03 | −0.01 ± 0.03 | −0.01 ± 0.02 | −0.05 ± 0.03 | −0.02 ± 0.02 | 0.01 ± 0.02 | |
|
| ||||||||||
P < 0.05 between KO and WT
FIG. 8.

Average end-systolic radial strains in transmural segments of the lateral wall of WT and VclKO hearts.
Strain distributions were also calculated throughout the cardiac cycle to examine differences in the temporal development of strain (heart rate maintained near 400 BPM). There was no significant difference in heart rate between VclKO and WT mice. Strain time courses in the ventricular lateral wall at the endocardium are shown in FIG. 9. Time courses for radial strain and torsional shear were found to be significantly different between VclKO and WT hearts using 2-way repeated measures ANOVA (P < 0.05).
FIG. 9.

Comparison of WT (■) and VclKO (▲) strain time courses for (a) Err and (b) Ecl in the endocardium of the lateral wall.
DISCUSSION
In previous mouse MR tagging studies, either HARP or finite element modeling have been used separately to help calculate 3D strains in the heart. In this study, we combined the strengths of HARP and finite element modeling for a more efficient and accurate 3D strain analysis of the mouse heart. HARP was used to facilitate material point tracking. Unlike manual tracing of taglines, HARP allows for automatic point tracking, which greatly reduces processing time. Errors in tracking sometimes occur near the edges of the myocardium, but these points are easily removed from the analysis. Strain measurements are also not restricted by tag line resolution since displacement data from every pixel in the myocardium can be used. Sub-pixel resolution in point tracking also allows for more precision in displacement measurements. In this study, the tag separation was 0.9 mm, which was higher than previously published values of 0.6–0.7 mm (18). With a lower tagging resolution, the harmonic peaks were closer together in k-space. If the HARP filter was too large, spectral interference from neighboring harmonic peaks would be included in the analysis. If the HARP filter was too small, some information about the modulated motion could be lost. A bandpass filter with a radius of half the tagging frequency was chosen to encompass the spread of the first harmonic peak but exclude most of the spectral energy from the surrounding harmonic peaks. The HARP analysis could have been improved with the use of CSPAMM, which reduces artifacts by suppressing the central peak in k-space (29). However, implementation of CSPAMM requires additional image acquisitions which would have increased scan time and costs significantly.
With a deformable finite element model, 3D strain distributions were calculated throughout the LV wall. Unlike homogenous strain analysis, the strain fields produced from finite element modeling were nonhomogenous and smooth. They could be reconstructed with sufficient sensitivity to detect variations in deformation by region and genotype. The addition of smoothing weights to the data fitting reduced the model’s susceptibility to noise. By systematically varying the smoothing weights for the mesh, the optimal values were found such that the RMS error was similar to the magnitude of the measurement error while minimizing the strain energy of the resulting deformations. The model was also able to reproduce global changes in geometry. End-systolic geometry of the deformable model agreed well with measurements made from end-systolic untagged cine images. The use of finite element strain analysis with MR tagging has also been validated in gel phantoms subjected to known, well-controlled 3D deformations (30). One limitation of our strain analysis results from the acquisition of only 5 tagged short-axis slices. The 3D model encompasses most of the LV up to the valve plane. However, the short-axis slices do not reach the true apex or base of the ventricle. In these peripheral regions, there is a lack of displacement data in the short-axis plane, which may result in less accurate radial and circumferential strains. Strain calculations at the apex and base can be improved with the acquisition of additional short-axis images in these areas. To account for the relative density of material points, the smoothing weight optimization can also be customized for each element according to the number of markers per element.
The geometric models made from the cine MR images allow for the incorporation of accurate cardiac geometries, which is important since diseased hearts are usually abnormal in shape and size. Fitting of the LV geometry from cine MR data and measurement of wall and cavity volumes has been previously validated by us (31, 32). EDV and EF calculated from the geometries in the WT mice were close to the ranges reported in literature (12, 33–35). Slight differences may be attributed to background strain, age, and anesthesia levels. Previously published results from echocardiography and histology show that the VclKO hearts have dilation, hypertrophy, and decreased fractional shortening (22). The EDV, EF, and LVMI values calculated from MRI were consistent with these previous findings.
The 3D end-systolic strain patterns calculated in the WT lateral free wall agree well with previously published mouse data in terms of magnitude and sign (18, 19). Base-to-apex strain variations, such as Ecr transitioning from negative (base) to positive (apex), are found to be similar (18). Err seems to be larger at the equatorial level than the apical and basal regions, which agrees with the published literature (18). The WT data also shows that Err is generally larger at the endocardium than the epicardium. This transmural gradient in radial strain is consistent with data published from large animal studies (36, 37) and in mice (12). Torsion measurements are also similar to values found in literature for the mouse heart (9).
End-systolic stains in the VclKO hearts showed patterns characteristic of human cases of DCM. In human patients with DCM, radial wall thickening and peak torsion are reduced (13, 38, 39). Circumferential and longitudinal shortening in the lateral wall are relatively unchanged from levels found in healthy subjects (38). In the VclKO hearts, Err is significantly lower in the endocardium compared to WT levels. Torsional shear and torsion were decreased in VclKO mice as well. Ecc and Ell were not significantly different from WT values across the majority of the lateral free wall, which suggests that cell shortening during systole is largely unaffected by Vcl deletion. However, the decrease of Err in the endocardium may result from impaired deformation and transverse shearing of myocardial sheets, which normally contribute to wall thickening (40). The decrease in radial strain may lead to a detrimental reduction in the heart’s pumping function.
In summary, the current technique combines SPAMM tagging, HARP tracking, and finite element modeling to calculate 3D finite strain distributions in the mouse LV. The technique is capable of distinguishing abnormal 3D strain patterns in different mouse models of cardiovascular disease. In this study, 3D strains were only presented in cardiac coordinates. However, this computational approach provides a convenient framework for the inclusion of fiber architecture and the measurement of fiber and sheet strains. Myocardial material properties can also be estimated with the appropriate pressure measurements, which may provide further insight into the origin and progression of different cardiovascular diseases.
Acknowledgments
Special thanks to and the UCSD Center for Functional MRI for imaging resources and support.
References
- 1.Chien KR. Genes and physiology: Molecular physiology in genetically engineered animals. J Clin Invest. 1996;97(4):901–9. doi: 10.1172/JCI118512. [DOI] [PMC free article] [PubMed] [Google Scholar]
- 2.Christensen G, Wang Y, Chien KR. Physiological assessment of complex cardiac phenotypes in genetically engineered mice. Am J Physiol. 1997;272(6 Pt 2):H2513–24. doi: 10.1152/ajpheart.1997.272.6.H2513. [DOI] [PubMed] [Google Scholar]
- 3.Carmeliet P, Collen D. Transgenic mouse models in angiogenesis and cardiovascular disease. J Pathol. 2000;190(3):387–405. doi: 10.1002/(SICI)1096-9896(200002)190:3<387::AID-PATH595>3.0.CO;2-R. [DOI] [PubMed] [Google Scholar]
- 4.Hasenfuss G. Animal models of human cardiovascular disease, heart failure and hypertrophy. Cardiovasc Res. 1998;39(1):60–76. doi: 10.1016/s0008-6363(98)00110-2. [DOI] [PubMed] [Google Scholar]
- 5.Kubota T, McTiernan CF, Frye CS, Slawson SE, Lemster BH, Koretsky AP, Demetris AJ, Feldman AM. Dilated cardiomyopathy in transgenic mice with cardiac-specific overexpression of tumor necrosis factor-alpha. Circ Res. 1997;81(4):627–35. doi: 10.1161/01.res.81.4.627. [DOI] [PubMed] [Google Scholar]
- 6.Franco F, Dubois SK, Peshock RM, Shohet RV. Magnetic resonance imaging accurately estimates LV mass in a transgenic mouse model of cardiac hypertrophy. Am J Physiol. 1998;274(2 Pt 2):H679–83. doi: 10.1152/ajpheart.1998.274.2.H679. [DOI] [PubMed] [Google Scholar]
- 7.Ross AJ, Yang Z, Berr SS, Gilson WD, Petersen WC, Oshinski JN, French BA. Serial MRI evaluation of cardiac structure and function in mice after reperfused myocardial infarction. Magnetic Resonance in Medicine. 2002;47(6):1158–68. doi: 10.1002/mrm.10166. [DOI] [PubMed] [Google Scholar]
- 8.Henson RE, Song SK, Pastorek JS, Ackerman JJH, Lorenz CH. Left ventricular torsion is equal in mice and humans. Am J Physiol Heart Circ Physiol. 2000;278:H1117–23. doi: 10.1152/ajpheart.2000.278.4.H1117. [DOI] [PubMed] [Google Scholar]
- 9.Liu W, Ashford MW, Chen J, Watkins MP, Williams TA, Wickline SA, Yu X. MR tagging demonstrates quantitative differences in regional ventricular wall motion in mice, rats, and men. Am J Physiol Heart Circ Physiol. 2006;291(5):H2515–2521. doi: 10.1152/ajpheart.01016.2005. [DOI] [PubMed] [Google Scholar]
- 10.Epstein FH, Yang Z, Gilson WD, Berr SS, Kramer CM, French BA. MR tagging early after myocardial infarction in mice demonstrates contractile dysfunction in adjacent and remote regions. Magnetic Resonance in Medicine. 2002;48(2):399–403. doi: 10.1002/mrm.10210. [DOI] [PubMed] [Google Scholar]
- 11.Heijman E, Strijkers GJ, Habets J, Janssen B, Nicolay K. Magnetic resonance imaging of regional cardiac function in the mouse. MAGMA. 2004;17(3–6):170–8. doi: 10.1007/s10334-004-0082-4. [DOI] [PubMed] [Google Scholar]
- 12.Zhong J, Liu W, Yu X. Transmural myocardial strain in mouse: Quantification of high-resolution MR tagging using harmonic phase (HARP) analysis. Magn Reson Med. 2009;61(6):1368–73. doi: 10.1002/mrm.21942. [DOI] [PMC free article] [PubMed] [Google Scholar]
- 13.Tanaka N, Tone T, Ono S, Tomochika Y, Murata K, Kawagishi T, Yamazaki N, Matsuzaki M. Predominant inner-half wall thickening of left ventricle is attenuated in dilated cardiomyopathy: An application of tissue doppler tracking technique. Journal of the American Society of Echocardiography. 2001;14(2):97–103. doi: 10.1067/mje.2001.109515. [DOI] [PubMed] [Google Scholar]
- 14.Moore CC, Lugo-Olivieri CH, McVeigh ER, Zerhouni EA. Three-dimensional systolic strain patterns in the normal human left ventricle: Characterization with tagged MR imaging. Radiology. 2000;214(2):453–66. doi: 10.1148/radiology.214.2.r00fe17453. [DOI] [PMC free article] [PubMed] [Google Scholar]
- 15.Kuijer JP, Marcus JT, Gotte MJ, van Rossum AC, Heethaar RM. Three-dimensional myocardial strains at end-systole and during diastole in the left ventricle of normal humans. J Cardiovasc Magn Reson. 2002;4(3):341–51. doi: 10.1081/jcmr-120013299. [DOI] [PubMed] [Google Scholar]
- 16.Moore CC, McVeigh ER, Zerhouni EA. Noninvasive measurement of three-dimensional myocardial deformation with tagged magnetic resonance imaging during graded local ischemia. J Cardiovasc Magn Reson. 1999;1(3):207–22. doi: 10.3109/10976649909088333. [DOI] [PMC free article] [PubMed] [Google Scholar]
- 17.O’Dell WG, Moore CC, Hunter WC, Zerhouni EA, McVeigh ER. Three-dimensional myocardial deformations: Calculation with displacement field fitting to tagged MR images. Radiology. 1995;195(3):829–35. doi: 10.1148/radiology.195.3.7754016. [DOI] [PMC free article] [PubMed] [Google Scholar]
- 18.Zhong Jia, Liu Wei, Yu Xin. Characterization of three-dimensional myocardial deformation in the mouse heart: An MR tagging study. Journal of Magnetic Resonance Imaging. 2008;27(6):1263–70. doi: 10.1002/jmri.21367. [DOI] [PMC free article] [PubMed] [Google Scholar]
- 19.Young AA, French BA, Yang Z, Cowan BR, Gilson WD, Berr SS, Kramer CM, Epstein FH. Reperfused myocardial infarction in mice: 3D mapping of late gadolinium enhancement and strain. J Cardiovasc Magn Reson. 2006;8(5):685–92. doi: 10.1080/10976640600721767. [DOI] [PubMed] [Google Scholar]
- 20.Li W, Liu W, Zhong J, Yu X. Early manifestation of alteration in cardiac function in dystrophin deficient mdx mouse using 3D CMR tagging. J Cardiovasc Magn Reson. 2009;11(1):40–50. doi: 10.1186/1532-429X-11-40. [DOI] [PMC free article] [PubMed] [Google Scholar]
- 21.Vandsburger MH, French BA, Helm PA, Roy RJ, Kramer CM, Young AA, Epstein FH. Multi-parameter in vivo cardiac magnetic resonance imaging demonstrates normal perfusion reserve despite severely attenuated beta-adrenergic functional response in neuronal nitric oxide synthase knockout mice. Eur Heart J. 2007;28(22):2792–8. doi: 10.1093/eurheartj/ehm241. [DOI] [PubMed] [Google Scholar]
- 22.Zemljic-Harpf AE, Miller JC, Henderson SA, Wright AT, Manso AM, Elsherif L, Dalton ND, Thor AK, Perkins GA, McCulloch AD, Ross RS. Cardiac-myocyte-specific excision of the vinculin gene disrupts cellular junctions, causing sudden death or dilated cardiomyopathy. Mol Cell Biol. 2007;27(21):7522–37. doi: 10.1128/MCB.00728-07. [DOI] [PMC free article] [PubMed] [Google Scholar]
- 23.Axel L, Dougherty L. MR imaging of motion with spatial modulation of magnetization. Radiology. 1989;171(3):841–5. doi: 10.1148/radiology.171.3.2717762. [DOI] [PubMed] [Google Scholar]
- 24.Yushkevich PA, Piven J, Hazlett HC, Smith RG, Ho S, Gee JC, Gerig G. User-guided 3D active contour segmentation of anatomical structures: Significantly improved efficiency and reliability. Neuroimage. 2006;31(3):1116–28. doi: 10.1016/j.neuroimage.2006.01.015. [DOI] [PubMed] [Google Scholar]
- 25.Osman NF, Kerwin WS, McVeigh ER, Prince JL. Cardiac motion tracking using CINE harmonic phase (HARP) magnetic resonance imaging. Magnetic Resonance in Medicine. 1999;42(6):1048–60. doi: 10.1002/(sici)1522-2594(199912)42:6<1048::aid-mrm9>3.0.co;2-m. [DOI] [PMC free article] [PubMed] [Google Scholar]
- 26.Vetter FJ, McCulloch AD. Three-dimensional analysis of regional cardiac function: A model of rabbit ventricular anatomy. Prog Biophys Mol Biol. 1998;69(2–3):157–83. doi: 10.1016/s0079-6107(98)00006-6. [DOI] [PubMed] [Google Scholar]
- 27.Young AA, Orr R, Smaill BH, Dell’Italia LJ. Three-dimensional changes in left and right ventricular geometry in chronic mitral regurgitation. Am J Physiol Heart Circ Physiol. 1996;271(6):H2689–2700. doi: 10.1152/ajpheart.1996.271.6.H2689. [DOI] [PubMed] [Google Scholar]
- 28.Mazhari R, Omens JH, Waldman LK, McCulloch AD. Regional myocardial perfusion and mechanics: A model-based method of analysis. Ann Biomed Eng. 1998;26(5):743–55. doi: 10.1114/1.74. [DOI] [PubMed] [Google Scholar]
- 29.Kuijer JPA, Jansen E, Marcus JT, Rossum ACv, Heethaar RM. Improved harmonic phase myocardial strain maps. Magnetic Resonance in Medicine. 2001;46(5):993–9. doi: 10.1002/mrm.1286. [DOI] [PubMed] [Google Scholar]
- 30.Young AA, Kraitchman DL, Dougherty L, Axel L. Tracking and finite element analysis of stripe deformation in magnetic resonance tagging. Medical Imaging, IEEE Transactions on. 1995;14(3):413–21. doi: 10.1109/42.414605. [DOI] [PubMed] [Google Scholar]
- 31.Chuang J, McCulloch A, Omens J, Frank L. Generation of an accurate 3D computational model of the mouse heart from MR images. Proceedings of Joint Annual Meeting ISMRM-ESMRMB; Berlin Germany. 2007. Program #3633. [Google Scholar]
- 32.Costandi PN, McCulloch AD, Omens JH, Frank LR. High-resolution longitudinal MRI of the transition to heart failure. Magn Reson Med. 2007;57(4):714–20. doi: 10.1002/mrm.21182. [DOI] [PMC free article] [PubMed] [Google Scholar]
- 33.Croisille P, Rotaru C, Janier M, Hiba B. Gender and strain variations in left ventricular cardiac function and mass determined with magnetic resonance imaging at 7 tesla in adult mice. Invest Radiol. 2007;42(1):1–7. doi: 10.1097/01.rli.0000248892.35531.ea. [DOI] [PubMed] [Google Scholar]
- 34.Stegger L, Heijman E, Schafers KP, Nicolay K, Schafers MA, Strijkers GJ. Quantification of left ventricular volumes and ejection fraction in mice using PET, compared with MRI. J Nucl Med. 2009;50(1):132–8. doi: 10.2967/jnumed.108.056051. [DOI] [PubMed] [Google Scholar]
- 35.Yang Z, Berr SS, Gilson WD, Toufektsian MC, French BA. Simultaneous evaluation of infarct size and cardiac function in intact mice by contrast-enhanced cardiac magnetic resonance imaging reveals contractile dysfunction in noninfarcted regions early after myocardial infarction. Circulation. 2004;109(9):1161–7. doi: 10.1161/01.CIR.0000118495.88442.32. [DOI] [PubMed] [Google Scholar]
- 36.McCulloch AD, Omens JH. Non-homogeneous analysis of three-dimensional transmural finite deformation in canine ventricular myocardium. J Biomech. 1991;24(7):539–48. doi: 10.1016/0021-9290(91)90287-w. [DOI] [PubMed] [Google Scholar]
- 37.Ashikaga H, Omens JH, Ingels NB, Jr, Covell JW. Transmural mechanics at left ventricular epicardial pacing site. Am J Physiol Heart Circ Physiol. 2004;286(6):H2401–7. doi: 10.1152/ajpheart.01013.2003. [DOI] [PMC free article] [PubMed] [Google Scholar]
- 38.Young AA, Dokos S, Powell KA, Sturm B, McCulloch AD, Starling RC, McCarthy PM, White RD. Regional heterogeneity of function in nonischemic dilated cardiomyopathy. Cardiovasc Res. 2001;49(2):308–18. doi: 10.1016/s0008-6363(00)00248-0. [DOI] [PubMed] [Google Scholar]
- 39.Kanzaki H, Nakatani S, Yamada N, Urayama S, Miyatake K, Kitakaze M. Impaired systolic torsion in dilated cardiomyopathy: Reversal of apical rotation at mid-systole characterized with magnetic resonance tagging method. Basic Res Cardiol. 2006;101(6):465–70. doi: 10.1007/s00395-006-0603-6. [DOI] [PubMed] [Google Scholar]
- 40.LeGrice IJ, Takayama Y, Covell JW. Transverse shear along myocardial cleavage planes provides a mechanism for normal systolic wall thickening. Circ Res. 1995;77(1):182–93. doi: 10.1161/01.res.77.1.182. [DOI] [PubMed] [Google Scholar]