Abstract
The stability of bacteriorhodopsin (bR) has often been assessed using SDS unfolding assays that monitor the transition of folded bR (bRf) to unfolded (bRu). While many criteria suggest that the unfolding curves reflect thermodynamic stability, slow retinal (RET) hydrolysis during refolding makes it impossible to perform the most rigorous test for equilibrium, i.e., superimposable unfolding and refolding curves. Here we made a new equilibrium test by asking whether the refolding rate in the transition zone is faster than RET hydrolysis. We find that under conditions we have used previously, refolding is in fact slower than hydrolysis, strongly suggesting that equilibrium is not achieved. Instead, the apparent free energy values reported previously are dominated by unfolding rates. To assess how different the true equilibrium values are, we employed an alternative method by measuring the transition of bRf to unfolded bacterioopsin (bOu), the RET-free form of unfolded protein. The bRf-to-bOu transition is fully reversible, particular when we add excess RET. We compared the difference in unfolding free energies for 13 bR mutants measured by both assays. For 12 of the 13 mutants with a wide range of stabilities, the results are the essentially the same within experimental error. The congruence of the results is fortuitous and suggests the energetic effects of most mutations may be focused on the folded state. The bRf-to-bOu reaction is inconvenient because many days are required to reach equilibrium, but it is the preferable measure of thermodynamic stability.
1. Introduction
Measuring protein stability requires a method to drive the folding equilibrium in favor of the unfolded state. For water-soluble proteins this is typically accomplished using urea, Gdn HCl or temperature. To our knowledge, thermal unfolding has not been found to be reversible for any helical membrane proteins [1–6]. Urea and Gdn HCl have been particularly effective for beta-barrel membrane proteins [7] and have been found to reversibly unfold a few large helical membrane protein [7,8]. An alternative to urea and Gdn HCl is to use a denaturing detergent [9,10]. SDS has the advantage that the protein is maintained in a micelle environment, which leads to maintenance of considerable secondary structure and may therefore be a better mimic of the more structured unfolded state in a bilayer [9,11–14].
Bacteriorhodopsin can be completely refolded from an SDS unfolded state [11,15,16]. Titration of bR with SDS from a DMPC/CHAPSO or DMPC/CHAPS solution, leads to bRf-to-bRu unfolding curves that are reasonably stable over the course of an hour (see below). Moreover, kinetic constants in DMPC/CHAPS conditions indicate that unfolding to bRu should reach equilibrium in a matter of minutes [17–19]. The unfolding curves are also well modeled by a two-state equilibrium and the extrapolated kinetic constants of the unfolding and refolding reactions are consistent with extracted equilibrium constants within the transition zones [17,18]. Thus, we have assumed that the unfolding transitions reflect a folding equilibrium, in spite of the fact that the most rigorous test of equilibrium is not possible, i.e., overlap of the unfolding and refolding curves. We have now come to the conclusion, however, that true equilibrium cannot be achieved under the DMPC/CHAPSO conditions we have used in the past (16 mM DMPC, 6 mM CHAPSO) [20–25], because RET hydrolysis exceeds the rate of refolding near the midpoint of the observed unfolding transition (see below).
Instead of measuring the bRf-to-bRu transition that is accessed from unfolding at short time scales, it is also possible to measure the bRf-to-bOu transition if the reaction is allowed to proceed for many days. The advantage of the bRf-to-bOu transition is that it can be rigorously shown that the reaction is at equilibrium in the transition zones because the folding and unfolding curves are essentially the same [26]. To measure the error associated with the equilibrium assumption for the bRf-to-bRu transition, we compared the effects of mutations on both reactions. Fortuitously, the results are remarkably similar for both measurements.
2. Materials and Methods
2.1. Materials
All bR variants were prepared as described [20,27,28]. 1,2-dimyristoyl-sn-glycerol-3-phosphocholine (DMPC) was purchased from Avanti Polar Lipids. 3((3-cholamidopropyl)dimethylammonio)-2-hydroxy-1-propanesulphonate (CHAPSO) was purchased from Anatrace. Sodium dodecyl sulfate (SDS) and All-trans retinal (RET) were purchased from Sigma-Aldrich.
2.2. Methods
bRf-to-bRu unfolding and bRu-to-bRf refolding assays
The bRf-to-bRu unfolding assays were performed as described by Faham S. et al. [20]. Purple membrane was dissolved in a 2500 μL solution containing 15 mM DMPC, 6 mM CHAPSO and 10 mM sodium phosphate [pH 6.3]. The final concentration of the bR protein was in a range of 3 – 7 μM. After equilibration in dark for 1 hour, the solution was titrated by using an SDS titrant at room temperature in a 1-cm cuvette stirred with a magnetic stir bar. The SDS titrant contained 20 % (w/v) SDS, 15 mM DMPC, 6 mM CHAPSO and 10 mM sodium phosphate [pH 6.3]. 10 μL of the SDS titrant was added every 3 min during the titration.
To test the effect of RET hydrolysis on the time evolution of the bRf-to-bRu unfolding curve, a series of 200 μL solutions containing 3.7 μM wild-type bR, 15 mM DMPC, 6 mM CHAPSO, 10 mM sodium phosphate [pH 6.3] and different amounts of SDS varying from 5 to 71 mM were made at the same time and then loaded on a 96-well micro-plate (Thermo Scientific). The absorbance of each solution at 560 nm was monitored using a SpectraMax M5 plate reader (Molecular Devices).
To examine the bRu-to-bRf refolding reactions, purple membrane was dissolved to make a final solution containing 37 μM bR, 15 mM DMPC, 6 mM CHAPSO, 10 mM sodium phosphate [pH 6.3] and 66.5 mM SDS. 3 min later, the absorbance at 560 nm disappeared and absorbance at 440 nm reached the maximal value. 20 μL of the unfolded bR solution was then mixed with a series of 180 μL solutions. The final solutions contained 3.7 μM wild-type bR, 15 mM DMPC, 6 mM CHAPSO, 10 mM sodium phosphate [pH 6.3] and different amounts of SDS varying from 5.2 to 66.5 mM.
bRf-to-bOu unfolding and bOu-to-bRf refolding assays
The bRf-to-bOu unfolding and bOu-to-bRf refolding assays were performed similarly to Chen & Gouaux [26]. The main difference from their experiments was that we equilibrated each sample for much longer times.
For the unfolding assays, a stock solution was prepared by dissolving purple membrane in 20.625 mM DMPC, 22 mM CHAPSO and 13.75 mM sodium phosphate [pH 6.3]. For experiments with added RET, 15.4 μM all-trans RET was included in the stock solution. 160 μL aliquots of the stock solution were combined with 60 μL SDS solutions at various concentrations. The final solutions contained 1.5 – 3 μM bR, 15 mM DMPC, 16 mM CHAPSO, 10 mM sodium phosphate [pH 6.3], 0 or 11.2 μM all-trans RET and SDS varying from 8 to 138 mM.
For the refolding assays, bR was first unfolded in a buffer containing 15 mM DMPC, 16 mM CHAPSO, 10 mM sodium phosphate [pH 6.3] and 104 mM SDS. After equilibration for 1 h in dark, the absorbance at 560 nm disappeared and the absorbance at 390 nm reached the maximal value. Then, the unfolded bR solution was mixed with a series of DMPC/CHAPSO/SDS/RET/sodium phosphate [pH 6.3] solutions with varying SDS concentrations. The final solutions contained 1.5 – 3 μM bR, 15 mM DMPC, 16 mM CHAPSO, 10 mM sodium phosphate [pH 6.3], 0 or 11.2 μM all-trans RET and different amounts of SDS varying from 13 to 79 mM.
After the samples for unfolding and refolding assays were prepared, all the samples without added RET were equilibrated in dark at room temperature for 212 hours (~ 9 days) and those with added RET were equilibrated in dark at room temperature for 96 hours (~ 4 days). 200 μL of each unfolding and refolding sample was loaded on a 96-well UV-star micro-plate (Greiner Bio-One). Absorbance at 560 nm and fluorescence emission at 335 nm (excitation at 290 nm) of each solution were measured by SpectraMax M5 plate reader (Molecular Devices).
For unfolding experiments without added RET, the unfolding curves can be described by
| (1) |
where is the absorbance of the subdenaturant line and its extension over the experimental XSDS range, which represents the theoretical absorbance if all the bR is folded and is assumed to be linearly dependent on XSDS:
| (2) |
and Ff is the fraction of the folded state in each bR variant, i.e. Ff = [bRf]/c, where c is the total concentration of each bR variant in units of μM. Since the unfolding free energy calculated for a standard state of 1 μM is defined as
where RT is 0.592 kcal · mol−1, Ff can be written as a function of ΔGU and c:
| (3) |
If we assumed that ΔGU has a linear relationship with XSDS:
Then Eq. (3) can be re-written as
| (4) |
By plugging Eq. (2) and (4) into Eq. (1), we derived the equation of Abs560 in the expression of XSDS and used this equation to fit each unfolding curve without added RET:
| (5) |
Parameters a, b, m and Cm were fit using Kaleighdagraph4.1. The unfolding free energies for wild-type and mutant were compared by subtracting ΔGUWT from ΔGUmutant at the midpoint of the wild-type transition, XSDS = CmWT = 0.572.
For unfolding experiments with added RET, the RET concentration was held constant, so the RET concentration was combined with the equilibrium constant, giving the unfolding reaction a pseudo 1:1 stoichiometry, i.e. ΔGU = −RT ln([bOu]/[bRf]) = −RT ln[(1−Ff)/Ff]). Ff can be written as
| (6) |
If we assume that ΔGU has a linear relationship with XSDS:
Then Ff can be re-written as
| (7) |
By plugging Eq. (2) and (7) into Eq. (1), we obtain the equation of Abs560 in the expression of XSDS and used this equation to fit each unfolding curve with added RET:
Parameters a, b, m and Cm were fit using Kaleighdagraph4.1. The unfolding free energies for wild-type and mutant were compared by subtracting ΔGUWT from ΔGUmutant at the midpoint of the wild-type transition, XSDS = CmWT = 0.611.
3. Results
The bRf-to-bRu reaction is complicated by the slow hydrolysis of RET, which occurs from the fully unfolded protein with a half life of around 12 min [17]. Because loss of RET is slow until there is a significant fraction of unfolded protein, the unfolding curves are relatively stable over a modest time scale. Figure 1a shows the change in unfolding curves over time. Minimal change is seen over the first 30 min. These results, combined with measurements of unfolding rates under similar conditions [17,18], which indicate that unfolding should be achieved in a matter of minutes, suggest that the bRf-to-bRu unfolding curves can be used to extract equilibrium constants over a useable time scale. Nevertheless, due to RET hydrolysis during refolding, the refolding curves do not superimpose with the unfolding curves (Figure 1b). At low XSDS, where refolding is rapid, the protein refolds to near completion, but in the transition zones where refolding is slow, RET hydrolysis becomes a significant factor, complicating the interpretation.
Figure 1.
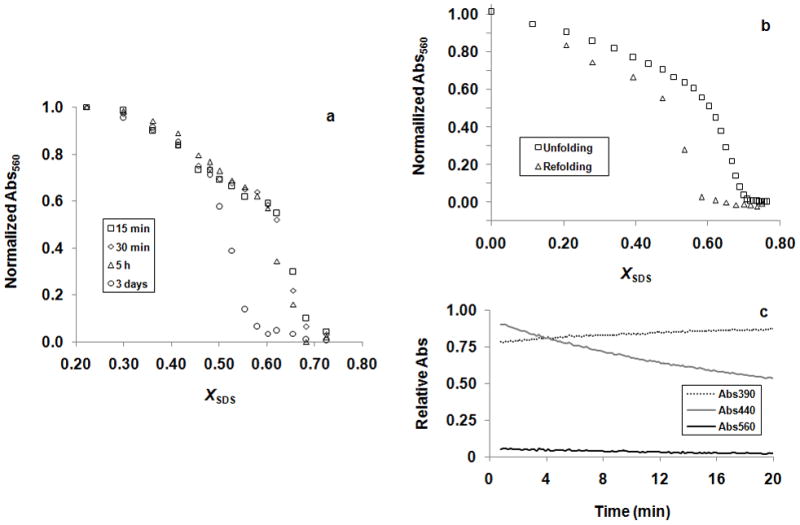
Effect of RET hydrolysis on the SDS-induced unfolding of wild-type bR. (a) Change of the wild-type bRf-to-bRu unfolding curve in time. (b) Plot of normailized absorbance at 560 nm against the SDS mole fraction concentration, XSDS, for the wild-type bRf-to-bRu unfolding and bRu-to-bRf refolding experiments. (c) Change of absorbances at 390, 440 and 560 nm in time when the wild-type protein was refolded from bRu at the apparent Cm of the bRf-to-bRu transition (XSDS = 0.673).
We therefore sought a further test of the equilibrium assumption. A simplified reaction scheme for unfolding followed by essentially irreversible RET hydrolysis is given by:
Where ku is the unfolding rate constant, kf is the refolding rate constant and khyd is the RET hydrolysis rate constant. For equilibrium between bRf and bRu to be achieved, kf must be greater than khyd. To test whether this is true in the transition zone, we rapidly unfolded the protein to bRu at high SDS concentration (XSDS = 0.78), then jumped back an SDS concentration at the midpoint of the observed transition (XSDS = 0.67) and monitored both refolding at 560 nm and hydrolysis at 390 nm. As shown in Figure 1c, we essentially saw no refolding before hydrolysis was complete. Thus, under the solution conditions we have used for measuring stability, equilibrium cannot be established near the midpoint of the transition and the extent of the observed unfolding must be limited by the unfolding rate.
We therefore measured the unfolding free energy differences for a variety of mutants using an alternative thermodynamic stability measurement. If the unfolding reactions are left to incubate, a bRf-to-bOu equilibrium is attained as described by Chen and Gouaux [26]: bRf ↔ bOu + RET. In our hands it took 9 days to reach equilibrium at room temperature as judged by the nearly superimposable folding and unfolding curves monitored by absorbance at 560 nm and fluorescence at 335 nm (Figure 2a and b). By adding excess RET in the samples, we shortened the equilibration time to 4 days and the folding and unfolding curves monitored by absorbance at 560 nm and fluorescence at 335 nm (Figure 2c and d) were more superimposable. The SDS concentration at the midpoint of the transition zone, Cm, was much higher for the bRf-to-bRu reaction [17,18] than for the bRf-to-bOu reaction, which is consistent with the spontaneous hydrolysis of the RET Schiff base in SDS solutions at neutral pH [29]. In addition, the only peaks observed in the absorbance spectra throughout the transition were at 560 nm, corresponding to bRf, and at 390 nm, corresponding to free RET (Figure 3). No indications of a contribution from bRu at 440 nm were evident, which indicates that the product of the unfolding experiment was bO and free RET but not bRu [15,17,26]. The unfolding curves derived from Abs560 and Flu335 were essentially the same (Figure 4), and the absorbance spectra exhibited an isosbestic point (Figure 3), suggesting that the unfolding of bRf to bOu can be described by a two-state model. As the bRf-to-bOu reaction should release RET, we expected that the addition of free RET would drive the equilibrium to higher SDS concentrations. Indeed, this is what we observed (Figure 4), and is consistent with a thermodynamic equilibrium process. The addition of free RET has two advantages: (1) the concentration of RET becomes a constant, simplifying analysis of the unfolding curves and (2) the time it took to reach equilibrium decreases from 9 days to 4 days.
Figure 2.
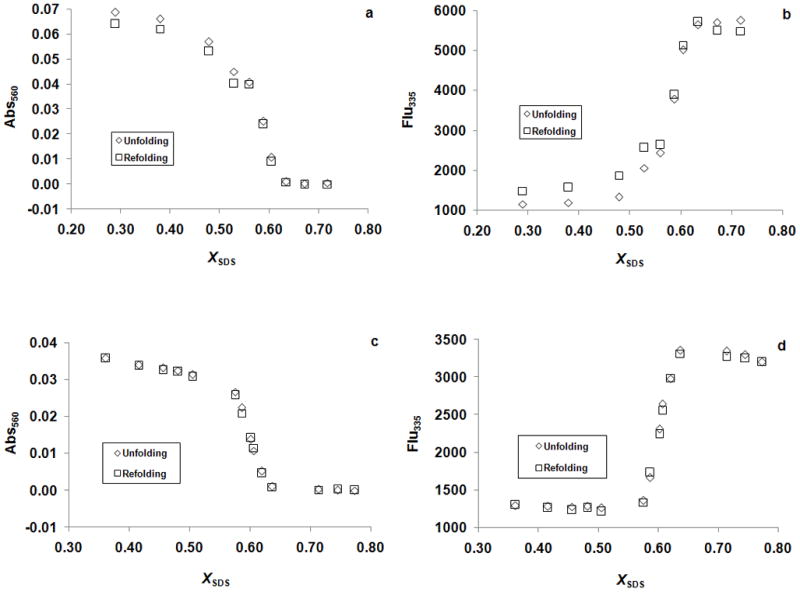
Equilibrium unfolding (bRf-to-bOu) and refolding (bOu-to-bRf) of wild-type protein. (a) The unfolding and refolding samples without added RET monitored by absrobance at 560 nm after incubated for ~9 days. (b) The unfolding and refolding samples without added RET monitored by fluorescence at 335 nm after incubated for ~9 days. (c) The unfolding and refolding samples with added RET monitored by absrobance at 560 nm after incubated for ~4 days. (d) The unfolding and refolding samples with added RET monitored by fluorescence at 335 nm after incubation for ~4 days.
Figure 3.
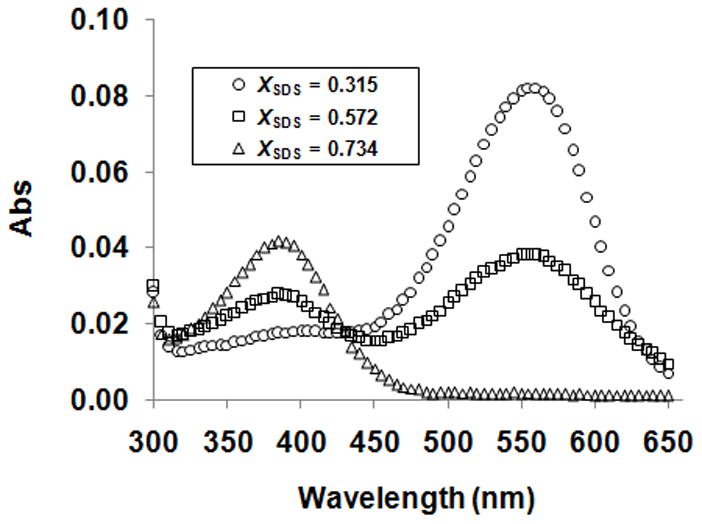
Absorbance spectra of the wild-type protein as a function of SDS concentration. The spectra were taken at XSDS = 0.315, 0.572 and 0.734, where the protein was completely folded, 50 % unfolded and completely unfolded, respectively.
Figure 4.
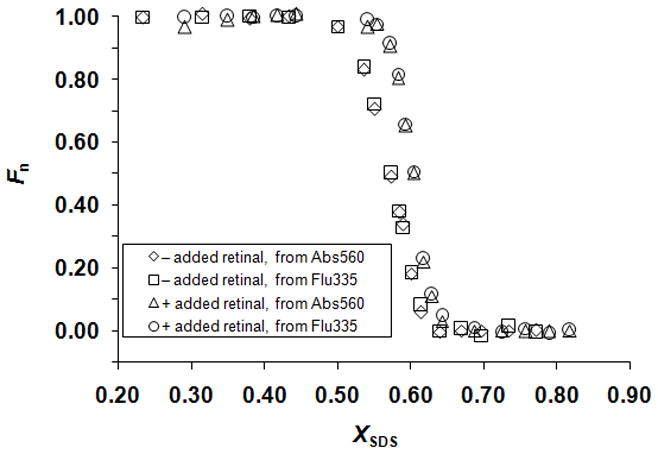
Wild-type bRf-to-bOu unfolding curve. Plot of the fraction of the native-state protein, Fn, derived by monitoring absorbance and fluorescence for the reactions without and with added RET. Superposition of the curves is consistent with a two-state model for SDS-induced unfolding of bRf to bOu. The transition shifts to higher SDS concentration in the presence of added RET, consistent with an equilibrium reaction that releases RET. Under both conditions with and without added RET, 3 μM of wild-type protein was included in the samples.
The ΔΔGu values obtained using the bRf-to-bOu transition and ΔΔGuapp values using the bRf-to-bRu transition were measured for 13 mutants and are listed in Table 1. We compare measurements at the center of the transition zones for the wild-type protein to minimize extrapolations outside of the observable range of fraction unfolded (XSDS = 0.572 for the bRf-to-bOu transition without added RET, XSDS = 0.611 for the bRf-to-bOu transition in the presence of 11.2 μM RET, and XSDS = 0.673 for the bRf-to-bRu transition). For 12 of the 13 mutants, the ΔΔGuapp and ΔΔGu values measured using the two transitions bRf-to-bRu and bRf-to-bOu, respectively, were generally within the experimental error. The correlation between the different measures of ΔΔGu for the 12 mutants is shown in Figure 5, illustrating the close correspondence between the two methods. An ideal correlation would have an intercept at 0 kcal/mol and a slope of 1.0. For the fitted line, the intercept is (−0.01 ± 0.12) kcal/mol and the slope is 0.98 ± 0.07.
Table 1.
ΔΔGU of bR variants tested from the bRf-to-bOu and bRf -to-bRu reactions at certain XSDS.
| Single Mutants | ΔΔaGU (bRf-to-bOu without added RET) | ΔΔaGU (bRf-to-bOu with 11.2 μM RET) | ΔΔGUa (bRf-to-bRu) | ||
|---|---|---|---|---|---|
| XSDS | 0.572b | 0.611b | 0.572 | 0.611 | 0.673b |
| K41A | - | −1.2 ± 0.3 | −1.4 ± 0.3 | −1.4 ± 0.3 | −1.4 ± 0.2 |
| F42A | −2.6 ± 0.5 | −2.2 ± 0.3 | −2.1 ± 0.3 | −2.1 ± 0.2 | −2.0 ± 0.2 |
| Y43A | −1.9 ± 0.3 | −2.1 ± 0.3 | −1.9 ± 0.4 | −1.9 ± 0.3 | −1.6 ± 0.2 |
| I45A | −2.2 ± 0.4 | −2.1 ± 0.2 | −2.1 ± 0.3 | −2.1 ± 0.3 | −1.9 ± 0.3 |
| T46A | - | −2.7 ± 0.4 | −2.3 ± 0.3 | −2.3 ± 0.3 | −2.2 ± 0.3 |
| T47A | −1.1 ± 0.3 | −0.9 ± 0.2 | −1.6 ± 0.3 | −1.4 ± 0.2 | −1.1 ± 0.2 |
| V49A | −0.3 ± 0.4 | −0.3 ± 0.3 | −0.7 ± 0.2 | −0.6 ± 0.2 | −0.3 ± 0.2 |
| I52A | −2.0 ± 0.3 | −1.6 ± 0.2 | −2.0 ± 0.2 | −1.9 ± 0.2 | −1.5 ± 0.1 |
| F54A | - | −0.9 ± 0.3 | −0.5 ± 0.2 | −0.4 ± 0.2 | −0.4 ± 0.1 |
| M56A | - | 1.6 ± 0.3 | 2.0 ± 0.2 | 1.9 ± 0.2 | 1.6 ± 0.1 |
| S59A | - | −0.1 ± 0.2 | −0.1 ± 0.2 | −0.1 ± 0.2 | −0.1± 0.1 |
| M60A | - | −1.0 ± 0.4 | −1.1 ± 0.3 | −1.1 ± 0.3 | −1.0 ± 0.2 |
| P50A | −1.1 ± 0.3 | −1.0 ± 0.2 | 0.7 ± 0.4 | 0.7 ± 0.3 | 0.6 ± 0.1 |
Unit of ΔΔGU: kcal · mol−1.
Cm of the wild-type bR for each reaction.
Figure 5.
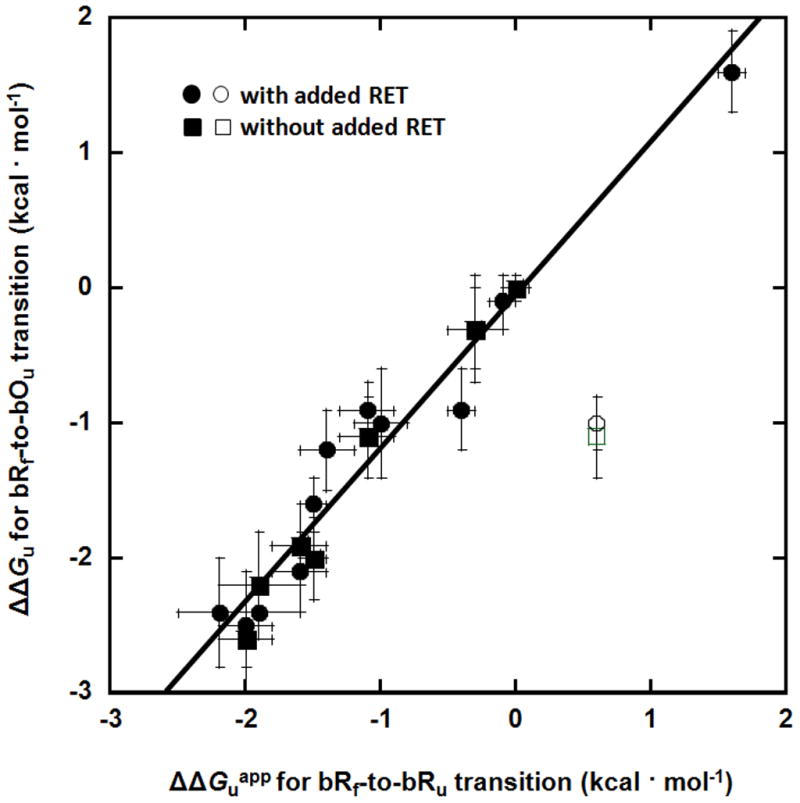
Correlation between ΔΔGuapp values measured for the bRf-to-bRu transition and the ΔΔGu values measured for the bRf-to-bOu transition. Square symbols refer to values measured without added RET and circle symbols refer to values measured with added RET. The open symbols refer to values for the P50A mutation, which is an outlier. The least squares fit line through all the filled symbols has a slope of 0.98 ± 0.07 and an intercept of −0.01 ± 0.12 kcal mol−1. The correlation coefficient is 0.96.
4. Discussion
While the bRf-to-bRu unfolding transition apparently reaches a steady state rapidly, RET hydrolysis and slow refolding precludes establishment of a true equilibrium under the conditions we have used. In contrast, the bRf-to-bOu equilibrium is stable. Nevertheless, when we compare the effects of 12 of the 13 mutations on the two reactions, very similar results are obtained for most mutations. The origin of the fortuitous congruence of the two measures is unclear. One possibility is that mutations largely alter ku, but not kf. This could happen if the mutations have large effects on the free energy of the native state, but minimal effects on the transition state or unfolded state free energies. The effects of one mutant, P50A, were very different when measured by the two methods. It was found to be significantly stabilizing in the bRf-to-bRu transition, but destabilizing in the bRf-to-bOu transition. P50 is in the center of kinked helix in the folded bR structure, so it is perhaps not surprising that there might be long-range effects imparted by this mutation that differentially alter unfolding transition state.
Booth and co-workers have found excellent correspondence between equilibrium and kinetic measurements [17,18]. Their conditions are slightly different than the ones we have used, however, employing CHAPS instead of CHAPSO and the CHAPS is used at a higher concentration. We have observed that increasing CHAPSO concentrations from 6 to 16 mM increases refolding rates (unpublished result), which could then lead to equilibrium for the bRf-to-bRu transition. Nevertheless, the bRf-to-bOu transition is the more reliable way to measure the effects of mutations on thermodynamic stability.
Highlights.
We re-examine a commonly used assay for measuring how mutants alter bacteriorhodopsin stability
We find the assay measures kinetic rather than thermodynamic stability
Nevertheless, for 12 of 13 mutants tested, the error in the equilibrium assumption is small
Thus, the free energy effects of most mutants may be mostly on the folded state
Acknowledgments
This work was supported by NIH grant R01GM063919 to JUB.
Footnotes
Publisher's Disclaimer: This is a PDF file of an unedited manuscript that has been accepted for publication. As a service to our customers we are providing this early version of the manuscript. The manuscript will undergo copyediting, typesetting, and review of the resulting proof before it is published in its final citable form. Please note that during the production process errors may be discovered which could affect the content, and all legal disclaimers that apply to the journal pertain.
References
- 1.Morin PE, Diggs D, Freire E. Thermal stability of membrane-reconstituted yeast cytochrome c oxidase. Biochemistry. 1990;29:781–788. doi: 10.1021/bi00455a028. [DOI] [PubMed] [Google Scholar]
- 2.Thompson LK, Miller AF, Buser CA, de Paula JC, Brudvig GW. Characterization of the multiple forms of cytochrome b559 in photosystem II. Biochemistry. 1989;28:8048–8056. doi: 10.1021/bi00446a012. [DOI] [PubMed] [Google Scholar]
- 3.Maneri LR, Low PS. Structural stability of the erythrocyte anion transporter, band 3, in different lipid environments. A differential scanning calorimetric study. J Biol Chem. 1988;263:16170–16178. [PubMed] [Google Scholar]
- 4.Chen GQ, Gouaux E. Reduction of membrane protein hydrophobicity by site-directed mutagenesis: introduction of multiple polar residues in helix D of bacteriorhodopsin. Protein Eng. 1997;10:1061–1066. doi: 10.1093/protein/10.9.1061. [DOI] [PubMed] [Google Scholar]
- 5.Kahn TW, Sturtevant JM, Engelman DM. Thermodynamic measurements of the contributions of helix-connecting loops and of retinal to the stability of bacteriorhodopsin. Biochemistry. 1992;31:8829–8839. doi: 10.1021/bi00152a020. [DOI] [PubMed] [Google Scholar]
- 6.Haltia T, Freire E. Forces and factors that contribute to the structural stability of membrane proteins. Biochim Biophys Acta. 1995;1241:295–322. doi: 10.1016/0304-4157(94)00161-6. [DOI] [PubMed] [Google Scholar]
- 7.Roman EA, Argüello JM, González Flecha FL. Reversible unfolding of a thermophilic membrane protein in phospholipid/detergent mixed micelles. J Mol Biol. 2010;397:550–559. doi: 10.1016/j.jmb.2010.01.045. [DOI] [PubMed] [Google Scholar]
- 8.Findlay HE, Rutherford NG, Henderson PJF, Booth PJ. Unfolding free energy of a two-domain transmembrane sugar transport protein. Proc Natl Acad Sci USA. 2010;107:18451–18456. doi: 10.1073/pnas.1005729107. [DOI] [PMC free article] [PubMed] [Google Scholar]
- 9.Lau FW, Bowie JU. A method for assessing the stability of a membrane protein. Biochemistry. 1997;36:5884–5892. doi: 10.1021/bi963095j. [DOI] [PubMed] [Google Scholar]
- 10.Renthal R. An Unfolding Story of Helical Transmembrane Proteins. Biochemistry. 2006;45:14559–14566. doi: 10.1021/bi0620454. [DOI] [PMC free article] [PubMed] [Google Scholar]
- 11.Huang KS, Bayley H, Liao MJ, London E, Khorana HG. Refolding of an integral membrane protein. Denaturation, renaturation, and reconstitution of intact bacteriorhodopsin and two proteolytic fragments. J Biol Chem. 1981;256:3802–3809. [PubMed] [Google Scholar]
- 12.Jirgensons B. Factors determining the reconstructive denaturation of proteins in sodium dodecyl sulfate solutions. Further circular dichroism studies on structural reorganization of seven proteins. J Protein Chem. 1982;1:71–84. [Google Scholar]
- 13.Jirgensons B, Capetillo S. Effect of sodium dodecyl sulfate on circular dichroism of some nonhelical proteins. Biochim Biophys Acta. 1970;214:1–5. doi: 10.1016/0005-2795(70)90064-4. [DOI] [PubMed] [Google Scholar]
- 14.Snel MM, Kaptein R, de Kruijff B. Interaction of apocytochrome c and derived polypeptide fragments with sodium dodecyl sulfate micelles monitored by photochemically induced dynamic nuclear polarization 1H NMR and fluorescence spectroscopy. Biochemistry. 1991;30:3387–3395. doi: 10.1021/bi00228a005. [DOI] [PubMed] [Google Scholar]
- 15.London E, Khorana HG. Denaturation and renaturation of bacteriorhodopsin in detergents and lipid-detergent mixtures. J Biol Chem. 1982;257:7003–7011. [PubMed] [Google Scholar]
- 16.Marti T. Refolding of bacteriorhodopsin from expressed polypeptide fragments. J Biol Chem. 1998;273:9312–9322. doi: 10.1074/jbc.273.15.9312. [DOI] [PubMed] [Google Scholar]
- 17.Curnow P, Booth PJ. Combined kinetic and thermodynamic analysis of alpha-helical membrane protein unfolding. Proc Natl Acad Sci USA. 2007;104:18970–18975. doi: 10.1073/pnas.0705067104. [DOI] [PMC free article] [PubMed] [Google Scholar]
- 18.Curnow P, Booth PJ. The transition state for integral membrane protein folding. Proc Natl Acad Sci USA. 2009;106:773–778. doi: 10.1073/pnas.0806953106. [DOI] [PMC free article] [PubMed] [Google Scholar]
- 19.Booth PJ, Flitsch SL, Stern LJ, Greenhalgh DA, Kim PS, Khorana HG. Intermediates in the folding of the membrane protein bacteriorhodopsin. Nat Struct Biol. 1995;2:139–143. doi: 10.1038/nsb0295-139. [DOI] [PubMed] [Google Scholar]
- 20.Faham S, Yang D, Bare E, Yohannan S, Whitelegge JP, Bowie JU. Side-chain contributions to membrane protein structure and stability. J Mol Biol. 2004;335:297–305. doi: 10.1016/j.jmb.2003.10.041. [DOI] [PubMed] [Google Scholar]
- 21.Yohannan S, Faham S, Yang D, Grosfeld D, Chamberlain AK, Bowie JU. A C alpha-H...O hydrogen bond in a membrane protein is not stabilizing. J Am Chem Soc. 2004;126:2284–2285. doi: 10.1021/ja0317574. [DOI] [PubMed] [Google Scholar]
- 22.Yohannan S, Faham S, Yang D, Whitelegge JP, Bowie JU. The evolution of transmembrane helix kinks and the structural diversity of G protein-coupled receptors. Proc Natl Acad Sci USA. 2004;101:959–963. doi: 10.1073/pnas.0306077101. [DOI] [PMC free article] [PubMed] [Google Scholar]
- 23.Yohannan S, Yang D, Faham S, Boulting G, Whitelegge J, Bowie JU. Proline substitutions are not easily accommodated in a membrane protein. J Mol Biol. 2004;341:1–6. doi: 10.1016/j.jmb.2004.06.025. [DOI] [PubMed] [Google Scholar]
- 24.Joh NH, Min A, Faham S, Whitelegge JP, Yang D, Woods VL, et al. Modest stabilization by most hydrogen-bonded side-chain interactions in membrane proteins. Nature. 2008;453:1266–1270. doi: 10.1038/nature06977. [DOI] [PMC free article] [PubMed] [Google Scholar]
- 25.Joh NH, Oberai A, Yang D, Whitelegge JP, Bowie JU. Similar energetic contributions of packing in the core of membrane and water-soluble proteins. J Am Chem Soc. 2009;131:10846–10847. doi: 10.1021/ja904711k. [DOI] [PMC free article] [PubMed] [Google Scholar]
- 26.Chen GQ, Gouaux E. Probing the folding and unfolding of wild-type and mutant forms of bacteriorhodopsin in micellar solutions: evaluation of reversible unfolding conditions. Biochemistry. 1999;38:15380–15387. doi: 10.1021/bi9909039. [DOI] [PubMed] [Google Scholar]
- 27.Cline SW, Doolittle WF. Efficient transfection of the archaebacterium Halobacterium halobium. J Bacteriol. 1987;169:1341–1344. doi: 10.1128/jb.169.3.1341-1344.1987. [DOI] [PMC free article] [PubMed] [Google Scholar]
- 28.Oesterhelt D, Stoeckenius W. Isolation of the cell membrane of Halobacterium halobium and its fractionation into red and purple membrane. Meth Enzymol. 1974;31:667–678. doi: 10.1016/0076-6879(74)31072-5. [DOI] [PubMed] [Google Scholar]
- 29.Cooper A, Dixon SF, Nutley MA, Robb JL. Mechanism of retinal Schiff base formation and hydrolysis in relation to visual pigment photolysis and regeneration: resonance Raman spectroscopy of a tetrahedral carbinolamine intermediate and oxygen-18 labeling of retinal at the metarhodopsin stage in photoreceptor membranes. Journal of the American Chemical Society. 1987;109:7254–7263. [Google Scholar]


