

Abstract
Context
Limited information is available of effects of rural-to-urban within-country migration on cardiovascular (CV) risk factors in low and middle income countries (LMIC).
Objective
We performed a systematic review of studies evaluating these effects and having rural and/or urban control groups.
Study Selection
Two teams of investigators searched observational studies in MEDLINE, Web of Science and Scopus until December 2010. Studies evaluating international migration were excluded.
Data Extraction
Three investigators extracted the information stratified by gender. We captured information on 17 known CV risk factors.
Results
Eighteen studies (n=58,536) were included. Studies were highly heterogeneous with respect to study design, migrant sampling frame, migrant urban exposure, and reported CV risk factors. In migrants, commonly reported CV risk factors –systolic and diastolic blood pressure, body mass index, obesity, total cholesterol, and LDL– were usually higher or more frequent than the rural group, and usually lower or less frequent than the urban group. This gradient was usually present in both genders. Anthropometric (waist-to-hip ratio, hip/waist circumference, triceps skinfolds) and metabolic (fasting glucose/insulin, insulin resistance) risk factors usually followed the same gradient, but conclusions are weak due to information paucity. Hypertension, HDL, fibrinogen and C-reactive protein did not follow any pattern.
Conclusions
In LMIC, most but not all CV risk factors have a gradient of higher or more frequent in migrants than in the rural groups but lower or less frequent than the urban groups. Such gradients may or may not be associated to differential CV events and long-term evaluations remain necessary.
Keywords: emigration and immigration, cardiovascular system, risk factors, income, meta-analysis as topic
INTRODUCTION
Non-communicable diseases (NCDs) kill people mostly in low- and middle-income countries (LMIC).[1] The Grand Challenges report highlights the need to study the impact of poverty and urbanization on NCDs.[2] Urbanization is occurring at a fast rate in LMIC, which may be associated with less physical activity, poorer nutritional habits, and rapidly growing prevalence of cardiovascular (CV) risk factors, CV disease (CVD) and other NCDs.[3] Rural-to-urban migration is one of the key larger drivers of urbanization in LMIC. Thus, the evaluation of the impact of rural to urban migration on CV risk factors is relevant due to its huge public health consequences.
The effect of international migration to developed countries on CV risk factors and CVD has been systematically studied.[4] As a result of the unique pattern and rate at which migration is occurring within LMIC, international migration results cannot be inferred to these settings. In LMIC, differences in design and patient characteristics make it difficult to reach a definitive conclusion on the effects on CV risk factors [5-9]. Also, it is not known whether the effect of rural to urban migration is uniform across CV risk factors and across LMIC. Finally, the effect on emerging CV risk factors such as fibrinogen, HOMA insulin resistance, or C-reactive protein could also be evaluated in the most recent studies.
We conducted a systematic review of observational studies evaluating the effect of rural-to-urban within-country migration on CV risk factors in LMIC. We hypothesized that migrants would have a worse CV risk profile than rural individuals and better CV risk profile than urban individuals.
METHODS
Study selection
A comprehensive literature search using PubMed-Medline, The Web of Science, and Scopus until December 31, 2010 was conducted. The following keywords were used: migration, emigration, immigration, residential mobility, transient and migrants, rural population, urban population, cardiovascular risk factors and cardiovascular disease. The search strategy of PubMed is available in the Appendix (Web only). We searched observational studies published in any language, performed in LMIC as defined by the World Bank.[10] We excluded studies of international migration or those from high income countries. A formal protocol was developed for this project.
Rural to urban migration was defined as the individual’s self-report or objective information of birth in a rural setting and, at the time of the study, self-report or objective ascertainment of urban residence. Three types of control groups were possible: a) a rural comparison group, where migrants originated from the same area, b) an urban comparison group, where migrants share the same urban environment and c) both a rural and an urban comparison group. This strategy excluded studies focusing only on differences between rural and urban settings. Sampling frames for migrants were classified as: i) random sample of migrants from urban population, ii) cohort of people born in a rural area who moved to an urban area and were traced, iii) rural individuals selected and their family members followed up in urban area (sib-pair); and iv) population level survey where migration was based on a retrospective question (“were you born here?”).
A list of retrieved articles was reviewed independently by 2 groups of investigators based in USA and Peru in order to choose potentially relevant articles, and disagreements were discussed and resolved. When multiple articles for a single study had been published, we used the most relevant publication and supplemented it, if necessary, with data from the other publications.
Data extraction
Data extraction was performed independently by 3 investigators (AVH, VP, AD). Disagreement was resolved by consensus. Using a standardized data extraction form, we collected information on lead author, year of study or publication year, study design, sample size, sampling frames for migrants, length of urban exposure, age of migration, average age, percentage of male participants, and 17 CV risk factors for migrants and control groups.
Outcomes
CV risk factors we collected were systolic blood pressure (SBP), diastolic blood pressure (DBP), hypertension; total cholesterol (TC), low density lipoprotein (LDL) cholesterol, high density lipoprotein (HDL) cholesterol; body mass index (BMI), obesity; triceps skinfolds thickness, waist circumference, hip circumference, waist-to-hip ratio (WHR); fibrinogen, C-reactive protein (CRP); fasting glucose, fasting insulin, and homeostasis model assessment (HOMA) scores, a validated measure of insulin resistance. Extracted information was stratified by gender. In the case of repeated measures, extracted information corresponded to the longest follow-up.
Study quality assessment
The order of quality of studies was considered as follows: 1) prospective cohort study, 2) retrospective cohort study, 3) case-control study, and 4) cross-sectional study. Also, we systematically assessed other key points of study quality proposed by the MOOSE collaboration.[11] These key points were: 1. clear identification of study population, 2. clear definition of outcome and outcome assessment, 3. independent assessment of outcome parameters (i.e. ascertainment of outcomes done by researchers other than the ones involved in the study), 4. selective loss during follow-up, and 5. important confounders and/or prognostic factors identified. Each point was rated as Yes/No. If the description was unclear, we considered that this as ‘no’.
Statistical analysis
Our systematic review followed the Preferred Reporting Items for Systematic Reviews and Meta-analyses (PRISMA) statement.[12] Differences between migrants and either rural or urban control groups are shown as absolute differences (i.e. migrant minus control) and its 95% Confidence Intervals (CI) for both continuous and categorical CV risk factors. Non-normally distributed risk factors were described in some studies as geometric means, and we extracted them as published.
A high degree of heterogeneity among studies was expected and therefore we did not combine all studies in a formal meta-analysis. Taking into account the sources of heterogeneity, three subgroup meta-analyses were pre-specified: 1. studies with similar characteristics including cross sectional design, random sampling frame, and >5 years of urban exposure; 2. cross-sectional studies; and 3. studies published after 1990. Subgroup meta-analyses were stratified by gender, as differences were expected between genders.
DerSimonian and Laird random effects models were used for meta-analyses.[13] For dichotomous CV risk factors, we used the Mantel-Haenzel (M-H) method to calculate pooled odds ratios (OR) and 95% CIs. For continuous CV risk factors, we used the Inverse Variance method to calculate Mean Differences (MD) and 95% CIs. Statistical heterogeneity was evaluated with the Cochran Chi-square (χ2) and the I2 statistics. Funnel plots were used to evaluate publication bias for the meta-analyses. All analyses were stratified by gender. We used Review Manager (RevMan 5.0, Oxford, UK; The Cochrane Collaboration, 2008).
RESULTS
Study Characteristics
A total of 394 citations were identified and screened, of which 80 were retrieved for detailed assessment. Of these, 62 did not fit our criteria (Figure 1). Thus, 18 studies were chosen in the qualitative synthesis,[5-9,14-26] including 58,536 individuals (Table 1). Studies included mostly adults, with very few individuals <15 years-old.
Figure 1.
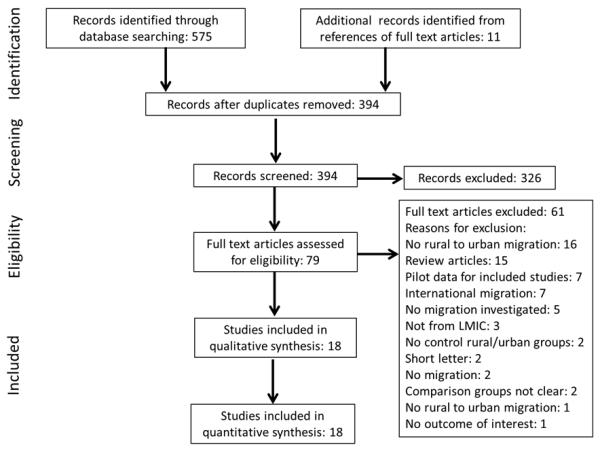
Search strategy profile of the systematic review.
Table 1.
Characteristics of studies included in the systematic review.
| Study, Publication year |
Years conducted, Country |
Total sample |
Mean age or age groups / % of young individuals |
% Male |
Migrant population |
Rural population |
Urban population |
Urban exposure |
Study design |
Sampling frame |
Reported CV risk factors |
|---|---|---|---|---|---|---|---|---|---|---|---|
| Cruz-Coke14, 1964 |
1962-1963, Chile |
179 | 32.9 6% <20 years-old and 2% <10 years-old |
47 | A group of Chilean Polynesian population who migrated to mainland Chile |
Isolated Chilean Polynesian population living in its own ecological niche |
N/A | Not reported |
Cross- Sectional |
Traced cohort |
DBP |
| Benyoussef15, 1974 |
1970, Senegal |
469 | ≤30y: 234 (49%); 31-40y: 113 (24%); >40y: 122 (26%) 22% <20 years-old |
52 | Random sample drawn from a census of native Serers, from a particular tribe, living in certain parts of Dakar |
A cluster-random sample of native Serers living in one of 65 villages in Niakhar county |
N/A | Not Reported |
Cross- Sectional |
Random Sample |
BP, cholesterol, weight, hematocrit, mental health |
| Nadim5, 1978 | 1976, Iran |
1428 | 40-49y: 815 (57%); 50-59y: 613 (43%) 0% <20 years-old |
40 | Cluster-random sample from East Azerbaijan living in West Teheran, Iran |
A cluster-random sample of rural areas of East Azerbaijan |
A cluster-random sample of non- migrants from East Azerbaijan, living in West Teheran |
Not reported |
Cross- Sectional |
Random Sample |
BP, hypertension, obesity (ponderal index) |
| Poulter16, 1984 |
1980, Kenya |
1171 | ≤34y: 571 (49%); 35-54y: 385 (33%); ≥55y: 215 (18%) 0% <20 years-old |
41 | Random sample of Luo Tribe members originated from Siaya District, Nyanza Province, Kenya, and now living in poor urban slums of Nairobi, Kenya drawn from a census |
A random sample of individuals living in Siaya District, Nyanza Province, Kenya |
N/A | Not Reported |
Cross- Sectional |
Traced cohort |
BP, BMI, weight, skinfolds |
| Poulter17, 1990 |
1981-1985, Kenya |
206 | <20y: 260 (41%); 20-29y: 288 (45%); ≥30y: 89 (4%) 1% <15 years-old |
60 | All individuals who had migrated from ruralWestern Kenya (Luo Tribe) to Nairobi (poor slum communities) on a permanent basis was identified and followed-up in Nairobi, Kenya |
Local controls, matched for age and sex, were selected from the same Luo tribe villages |
N/A | 2y | Prospective Cohort |
Traced cohort |
BP, weight, pulse rate, serum sodium, and potassium, urine sodium, potassium, and creatinine |
| He Migrant6, 1991 |
1989, China |
14505 | 32.7 0% <15 years-old |
61 | All Yi people who had migrated to the county seats (Butuo, Meigu and Zhaojue) or Xichang city 5 or more years prior to the survey |
A cluster-random sample of Liangshan Yi people from remote mountain districts of Sichuan province, Southwestern China for at least 5 years |
A cluster-random sample of Han people residing in Xichang city or Country seats (Butuo, Meigu, Zhaojue) |
Median: 10y, Mean: 14.9y |
Cross- Sectional |
Random Sample |
BP, hypertension, BMI, physical activity |
| He People18, 1991 |
1986-1988, China |
6618 | 31.1 0% <10 years-old |
53 | Yi People and their families employed at a power plant, paper mill, hospital, middle school, and the government agency, in Puge county seat |
A cluster-random sample of Liangshan Yi People living in remote mountain districts drawn from a census |
Han people and their families employed at a power plant, a paper mill, a hospital, a middle school, and the government agency in Puge county seat. |
Not reported |
Cross- Sectional |
Random Sample |
BP, BMI, heart rate, nutrient intake, electrolyte serum and urine concentrations |
| Yamauchi19, 2001 |
1994-1995, Papua New Guinea |
56 | 20-30y: 18 (32%); 30-40y: 25 (45%); >40y: 13 (23%) 0% <20 years-old |
52 | Volunteers from two villages in Tari Basin, comprising of almost the entire adult population |
N/A | Volunteers from three settlements in Port Moresby selected to match the age distribution of their village counterparts |
Average: 15y |
Cross- Sectional |
Traced cohort |
BMI, physical activity |
| Lindgarde20, 2004 |
N/A, Peru |
210 | 35.5 % of young individuals not available |
0 | Women of indigenous Andean ascent (Quechua) who had been residing in northern suburbs of Lima, Peru |
Convenience sample of women residing in small rural villages at high altitude in the Cuzco region |
N/A | 89% for >20y |
Cross- Sectional |
Random Sample |
BP, BMI, waist circumference, % body fat, body fat mass, glucose, insulin, HOMA index, leptin |
| Hollenberg21, 2005 |
1999, Panama |
458 | 38.3 0% < 18 years-old |
43 | Random sample drawn from a census of people of Kuna origin (O positive blood) and long term residents (≥ 5 years) of Abayala, Panama city |
Kuna Amerinds residing in their indigenous home in the island of Ailigandi (Caribbean island off the coast of Panama) |
N/A | >5 y | Cross- Sectional |
Random Sample |
BP, BMI, weight, mental health |
| Ramirez- Zea7, 2005 |
1969-2004, Guatemala |
1311 | 32.3 0% <18 years-old |
45 | People living in Guatemala City and who were participants of a longitudinal growth and development study (1969 and 1977) and born in rural East Guatemala |
People residing in or near their native villages and who were participants of a longitudinal growth and development study (1969 and 1977) and born in rural East Guatemala |
N/A | Not Reported |
Prospective cohort |
Traced cohort |
BP, BMI, waist circumference, plasma glucose, total cholesterol, triglycerides, LDL, HDL, skinfolds, waist/hip ratio, abdomen/hip ratio, body fat, physical activity |
| McCullough22, 2006 |
1999, Panama |
311 | 37.4 0% <18 years-old |
39 | A random sample of Kuna families residing in Vera Cruz, Panama City drawn from a census |
Kuna Amerinds residing in their indigenous home in the island of Ailigandi (Caribbean island off the coast of Panama) |
N/A | Average: 20y |
Cross- Sectional |
Random Sample |
BP, BMI, weight, cholesterol, urinary electrolytes (urea, sodium, potassium, calcium, magnesium) |
| Unwin23, 2006 |
N/A, Tanzania |
323 | 29.2 0% <15 years-old |
48 | Individuals living in the rural district of Morogoro, Tanzania, who migrated to Dar es Salaam for at least 6 months |
For each migrant, an age and sex matched non-migrant was identified in Morogoro, Tanzania |
N/A | 6 mo | Prospective Cohort |
Traced cohort |
BP, BMI, weight, waist, cholesterol, triglycerides, LDL, HDL, HbA1c |
| Szklarska24, 2008 |
2006, Poland |
863 | 43 0% <16 years-old |
43 | Convenience sample of people living in Wroclaw, Poland who migrated after the age of 16y and recruited during a health screening program |
N/A | Convenience sample of people living in Wroclaw, Poland, those who were born in Wroclaw or migrated before 16 years of age |
Not Reported |
Cross- Sectional |
Population Survey |
BP, BMI, waist/hip ratio, skinfolds, cholesterol, HDL, LDL, triglycerides, glucose |
| Khan25, 2009 |
2004, Bangladesh |
2807 | 30.7 12% <20 years-old and 0% <10 years-old |
0 | Women who had moved from countryside or town to urban center, or who lived in country-side town when <12y-old |
N/A | Women who were living in an urban area when<12-old, and did not move to urban city |
Not reported |
Cross- Sectional |
Population Survey |
Overweight, Obesity |
| Ebrahim8, 2010 |
2005-2007, India |
6510 | 41.1 0% <17 years-old |
58 | Factory workers for 4 cities and their coresident spouses were recruited. They were rural-urban migrants using employer records as a sampling frame |
Each migrant worker and spouse invited one nonmigrant full sibling of the same sex and closest to them in age still residing in their rural place of origin |
A 25% random sample of nonmigrants invited to participate. Nonmigrants were also asked to invite a sib who resided in the same city but did not work in the factory |
86% for >10y |
Cross- Sectional |
Sib-Cohort | BMI, waist/hip ratio, % body fat, BP, cholesterol, triglycerides, blood glucose, fasting insulin, HOMA score, fat intake, metabolic equivalent tasks (METs) |
| Lu26, 2010 |
1997-2000, Indonesia |
20122 | 29.7 0% <18 years-old |
46 | Identified from the 1997 and 2000 waves of the Indonesia Family Life Survey, representing 83% of the population |
Identified from the 1997 and 2000 waves of the Indonesia Family Life Survey, representing 83% of the population |
N/A | Not Reported |
Retrospective Cohort |
Population Survey |
Hypertension, mental health |
| Miranda9, 2010 |
2007, Peru |
989 | 48 0% <30 years-old |
47 | Stratified random sample of individuals born in Ayacucho but now residing in urban shanty town of Lima, Peru, drawn from updated census |
Stratified random sample of local residents of San Jose de Secce in Ayacucho was drawn from an updated census |
Stratified random sample of individuals born and permanently living in urban shanty town of Lima, Peru |
Average: 32y |
Cross- Sectional |
Random Sample |
BP, hypertension, BMI, skinfolds, waist-to-hip ratio, fasting glucose, diabetes, lipoprotein profile, hypercholesterol emia C-reactive protein, fibrinogen |
Fourteen studies were cross-sectional, one was a retrospective cohort,[26] and three were prospective cohorts.[7,17,23] Studies were heterogeneous with respect to several characteristics. These studies were reported between 1964 and 2010. Fifteen studies compared the migrant group to the rural control group, and nine studies reported the years of urban exposure for the migrant group (urban exposure ≥ 6 months, and mostly >5 years). Sampling frames for migrants were also heterogeneous: random sampling in eight studies, a traced cohort in six studies, a population survey in three studies, and a sib-pair strategy in one study.
All studies clearly identified the study population and defined the outcome and outcome assessment (Table 1w, Web only). None of studies independently assessed the outcomes, and four studies had a selective loss of patients during follow-up.[7,17,23,26] Six studies identified important confounders or prognostic factors[6,8,9,18,25,26] and adjusted the association between migration and the CV risk factors.
The most commonly reported CV risk factors were SBP (13 studies), DBP (13 studies), hypertension (11 studies), BMI (11 studies), obesity (four studies), TC (six studies), LDL (five studies) and HDL (four studies). Hypertension was defined as BP ≥140/90 in only six studies, all of them published after 1990. Other CV risk factors including WHR, waist and hip circumference, triceps skinfolds, fasting glucose and insulin, HOMA scores, fibrinogen and CRP, were reported by fewer studies.
Effect of rural-to-urban migration on commonly reported CV risk factors
In most of the studies, values or rates in migrants were higher than the rural group, and lower than the urban group. Nine out of 12 studies showed higher SBP levels in migrants vs. rural (range 0.9 to 11.9 mmHg, significant differences in seven), and five out of six studies shower lower SBP in migrants vs. urban (range −0.2 to −8.3 mmHg, significant differences in two) (Table 2). Ten out of 12 studies reported higher DBP in migrants vs. rural (range 1.5 to 13.9 mmHg, significant differences in nine), and three out of five studies showed lower DBP in migrants vs. urban (range −1.2 to −4.9 mmHg, significant differences in two) (Table 3). Eight out of nine studies showed higher hypertension rates for migrants vs. rural (range 2.3% to 25.3%, significant differences in five), and two out of four studies reported non-significant lower hypertension rates for migrants vs. urban (range −0.7% to −16.6%) (Table 2w, Web only).
Table 2.
Systolic Blood Pressure (SBP) in mmHg for the migrant, rural and urban groups
| Study | SBP Migrants Mean (SD) [n] |
SBP Rural Mean (SD) [n] |
SBP Urban Mean (SD) [n] |
Absolute difference M vs. R (95% CI) |
Absolute difference M vs. U (95% CI) |
||||||
|---|---|---|---|---|---|---|---|---|---|---|---|
|
| |||||||||||
| Male | Female | All | Male | Female | All | Male | Female | All | |||
| Nadim5 | 134.9 (23.1)[278] |
141.8 (24.9)[414] |
138.1 (24.6)[692] |
119.7 (20.2)[176] |
127.9 (26.2)[203] |
126.2 (23.7)[379] |
137.3 (21.1)[117] |
136.5 (23.1)[240] |
138.4 (24.1)[357] |
11.90 (8.89,14.91) |
−0.30 (−3.40,2.80) |
| Poulter16 | 128.2 (15.2)[220] |
119.5 (13.7)[90] |
124.7 (14.7)[310] |
122.1 (18.3)[264] |
120.0 (18.3)[597] |
121.4 (18.7)[861] |
- | - | - | 3.30 (1.24,5.36) |
- |
| Poulter17 | 125.6 (10.9)[43] |
113.7 (9.9)[20] |
121.0 (13.3)[63] |
117.0 (11.4)[82] |
106.2 (9.2)[61] |
112.2 (12.1)[143] |
- | - | - | 8.80 (4.96,12.64) |
- |
| He Migrant6 | 113 (14)[1656] |
106 (12.8)[919] |
111.0 (13.6)[2575] |
110.8 (12.3)[5023] |
111.2 (12.6)[3218] |
110.8 (12.5)[8241] |
114.5 (14.6)[2173] |
108.1 (15.3)[1516] |
112.2 (15.2)[3689] |
0.20 (−0.39,0.79) |
−1.20 (−1.92,−0.48) |
| He People | 107.3 (11.6)[316] |
101.6 (13.0)[201] |
105.7 (12.6)[517] |
101.2 (9.7)[2522] |
101.1 (9.4)[2436] |
101.1 (9.5)[4958] |
108.3 (12.1)[638] |
102.1 (11.2)[505] |
105.0 (12.4)[1143] |
4.60 (3.48,5.72) |
0.70 (−0.60,2.00) |
| Lindgarde20 | - | 96 (11)[105] |
96 (11) [105] |
- | 97 (10) [105] |
97 (10)[105] |
- | - | - | −1.00 (−3.84,1.84) |
- |
| Hollenberg21 | 115[146] | 100.5[179] | 107.0 (17.7)[325] |
104.4[51] | 95.2[82] | 98.7 (13.8)[133] |
- | - | - | 8.30 (5.27,11.33) |
- |
| Ramirez- Zea7 |
118.4 (11.6)[143] |
113.0 (15.3)[202] |
115.4 (13.7)[345] |
116 (11)[424] |
107 (12)[542] |
111.3 (12.1)[966] |
- | - | - | 4.10 (2.47,5.73) |
- |
| McCullough22 | - | - | 102 (14.7)[178] |
- | - | 98.2 (13.8)[133] |
- | - | - | 3.80 (0.61,6.99) |
- |
| Unwin23 | - | - | 116.2 (21.3)[153] |
- | - | 118.9 (18.9)[170] |
- | - | - | −2.70 (−7.11,1.71) |
- |
| Szklarska24 | 128.3 (15.6)[99] |
115.2 (16.2)[178] |
120.9 (17.8)[277] |
- | - | - | 128.6 (16.1)[268] |
118.3 (16.8)[318] |
123.1 (17.8)[586] |
- | −2.20 (−4.74,0.34) |
| Ebrahim8* | 125.1 (17.1)[1127] |
118.9 (16.0)[985] |
122.7 (17.0)[2112] |
122.9 (15.6)[1459] |
118.9 (16.9)[652] |
121.8 (16.2)[2111] |
125.7 (17.7)[1201] |
119.4 (16.8)[1086] |
122.9 (17.8)[2287] |
0.90 (−0.10,1.90) |
−0.20 (−1.23,0.83) |
| Miranda9 | 123.5 (14.9) [280] |
116.6 (16.9)[309] |
119.9 (16.4)[589] |
125.2 (17.4)[95] |
117.1 (19.1)[106] |
120.9 (18.7)[201] |
132.2 (23.2)[92] |
124.7 (22.2)[107] |
128.2 (22.9)[199] |
−1.00 (−3.90,1.90) |
−8.30 (−11.75,−4.85) |
adjusted for occupation, age, age group, and factory including a random effect of sibling pair.
Table 3.
Diastolic Blood Pressure (DBP) in mmHg for the migrant, rural and urban groups
| Study | DBP Migrants Mean (SD) [n] |
DBP Rural Mean (SD) [n] |
DBP Urban Mean (SD) [n] |
Absolute difference M vs. R (95% CI) |
Absolute difference M vs. U (95% CI) |
||||||
|---|---|---|---|---|---|---|---|---|---|---|---|
|
| |||||||||||
| Male | Female | All | Male | Female | All | Male | Female | All | |||
| Cruz-Coke14 | - | - | 86.8 (12.2)[50] |
- | - | 84.2 (9.4)[129] |
- | - | - | 2.60 (−1.15,6.35) |
- |
| Nadim5 | 83.5 (15.3)[278] |
87.1 (16.3)[414] |
86.0 (16.0)[692] |
71.5 (14.2)[176] |
73.6 (15.2)[203] |
72.1 (13.7)[379] |
85.5 (15.6)[117] |
84.7 (16.0)[240] |
84.7 (15.3)[357] |
13.90 (12.08,15.72) |
1.30 (−0.68,3.28) |
| Poulter16 | 70.8 (14.5)[220] |
67.2 (11.4)[90] |
70.1 (13.0)[310] |
68.1 (11.4)[264] |
66.8 (11.2)[597] |
67.4 (11.3)[861] |
- | - | - | 2.70 (1.07,4.33) |
- |
| Poulter17 | 66.3 (14.0)[43] |
61.7 (9.3)[20] |
65.7 (10.0)[63] |
53.1 (12.2)[82] |
54.9 (9.6)[61] |
53.5 (11.7)[143] |
- | - | - | 12.20 (9.07,15.33) |
- |
| He Migrant6 | 70.9 (11.6)[1656] |
65.2 (10.1)[919] |
68.7 (11.6)[2575] |
66.3 (12)[5023] |
65.8 (11.8)[3218] |
66.1 (12.1)[8241] |
72.6 (10.4)[2173] |
67.7 (10.3)[1516] |
70.4 (10.5)[3689] |
2.60 (2.08,3.12) |
−1.70 (−2.26,−1.14) |
| He People18 | 69.6 (10.1)[316] |
63.2 (8.8)[201] |
67.2 (10.1)[517] |
63.0 (7.2)[2522] |
62.5 (7.0)[2436] |
62.6 (7.1)[4958] |
69.2 (9.1)[638] |
63.4 (7.6)[505] |
66.6 (9.0)[1143] |
4.60 (3.71,5.49) |
0.60 (−0.42,1.62) |
| Lindgarde20 | - | 66 (6) [105] |
66 (6) [105] |
- | 59 (9) [105] |
59 (9) [105] |
- | - | - | 7.00 (4.93,9.07) |
- |
| Hollenberg21 | 74.2[146] | 64.9[179] | 69.1 (13.7)[325] |
61.7[51] | 57.9[82] | 59.4 (6.9)[133] |
- | - | - | 9.70 (7.80,11.60) |
- |
| Ramirez- Zea7 |
73.7 (10.5)[143] |
71.5 (11.0)[202] |
72.4 (10.4)[345] |
72 (9)[424] |
69 (9)[542] |
70.9 (9.3)[966] |
- | - | - | 1.50 (0.26,2.74) |
- |
| McCullough22 | - | - | 64 (16) [178] |
- | - | 58.4 (8.1)[133] |
- | - | - | 5.60 (2.88,8.32) |
- |
| Unwin23 | - | - | 70.3 (12.0)[153] |
- | - | 73.2 (10.0)[170] |
- | - | - | −2.90 (−5.32,−0.48) |
- |
| Szklarska24 | 82.2 (9.5)[99] |
75.5 (10)[178] |
78.8 (9.6)[277] |
- | - | - | 84.8 (11.2)[268] |
77.6 (10.6)[318] |
80.0 (12.1)[586] |
- | −1.20 (−2.70,0.30) |
| Miranda9 | 74 (9.2)[280] |
69 (8.7)[309] |
71.3 (9.3)[589] |
76.1 (8.9)[95] |
72.5 (9.2)[106] |
74.2 (9.2)[201] |
79.1 (11.8)[92] |
73.7 (10.6)[107] |
76.2 (11.5)[199] |
−2.90 (−4.38,−1.42) |
−4.90 (−6.67,−3.13) |
Nine out of 10 studies reported higher BMI values in migrants vs. rural (range 0.2 to 3.8 kg/m2, significant differences in six), and all of the four studies showed significant lower BMI values in migrants vs. urban (range −0.3 to −1.3 kg/m2) (Table 4). Two studies showed higher obesity rates in migrants vs. rural (range 0.2% to 18.1%, one with significant differences), and two studies showed significant lower obesity rates in migrant vs. urban (range −3.9% to −13.1%) (Table 3w, web only).
Table 4.
Body mass index (BMI) in Kg/m2 for the migrant, rural, and urban groups
| Study | BMI Migrants Mean (SD) [n] |
BMI Rural Mean (SD) [n] |
BMI Urban Mean (SD) [n] |
Absolute difference M vs. R (95% CI) |
Absolute difference M vs. U (95% CI) |
||||||
|---|---|---|---|---|---|---|---|---|---|---|---|
|
| |||||||||||
| Male | Female | All | Male | Female | All | Male | Female | All | |||
| Poulter16 | 20.5 (2.6)[220] |
21.8 (3.0)[90] |
20.8 (2.9)[310] |
20.0 (2.9)[264] |
20.1 (3.0)[597] |
20.2 (3.0)[861] |
- | - | - | 0.60 (0.22,0.98) |
- |
| He People18 | 20.2 (2.3)[316] |
20.9 (2.6)[201] |
20.3 (2.5)[517] |
18.9 (2.3)[2522] |
18.9 (2.5)[2436] |
18.9 (2.4)[4958] |
20.5 (2.3)[638] |
20.6 (2.3)[505] |
20.6 (2.4)[1143] |
1.40 (1.17,1.63) |
−0.30 (−0.56,−0.04) |
| Yamauchi19 | 26.4 (3.3)[14] |
25.5 (3.1)[15] |
25.9 (4.0)[29] |
24.8 (1.6)[11] |
23.2 (3)[9] |
24.4 (2.2)[20] |
- | - | - | 1.50 (−0.25,3.25) |
- |
| Lindgarde20 | - | 25.1 (4.7)[105] |
25.1 (4.7)[105] |
- | 24.6 (3.9)[105] |
24.6 (3.9)[105] |
- | - | - | 0.50 (−0.67,1.67) |
- |
| Hollenberg21 | 22.6[146] | 23.6[179] | 23.1[325] | 22.4[51] | 22.5[82] | 22.5[133] | - | - | - | 0.6** | - |
| Ramirez- Zea7 |
26.0 (4.0)[143] |
27.0 (3.8)[202] |
26.5 (3.8)[345] |
24.3 (3.4)[424] |
26.8 (4.9)[542] |
25.4 (4.6)[966] |
- | - | - | 1.10 (0.61,1.59) |
- |
| McCullough22 | - | - | 23.4 (4)[178] |
- | - | 22.6 (3.5)[133] |
- | - | - | 0.80 (−0.04,1.64) |
- |
| Unwin23 | - | - | 24.0 (1.6)[153] |
- | - | 23.6 (1.0)[170] |
- | - | - | 0.40 (0.11,0.69) |
- |
| Szklarska24 | 26.9 (3.1)[99] |
24.4 (4.4)[178] |
25.1 (4.1)[277] |
- | - | - | 27.2 (4.1)[268] |
24.5 (4.8)[318] |
25.9 (4.5)[586] |
- | −0.80 (−1.40,−0.20) |
| Ebrahim8* | 24 (3.4)[1127] |
25.2 (3.2)[985] |
24.6 (3.4)[2112] |
21.9 (3.9)[1459] |
22.5 (3.9)[652] |
22.0 (4.0)[2111] |
24.3 (3.5)[1201] |
25.9 (3.4)[1086] |
25.0 (3.5)[2287] |
2.60 (2.38,2.82) |
−0.40 (−0.60,−0.20) |
| Miranda9 | 25.9 (3.5)[280] |
28 (4.7)[309] |
27 (4.3)[589] |
22.9 (2.1)[95] |
23.5 (3.2)[106] |
23.2 (2.7)[201] |
26.8 (4)[92] |
29.5 (6.1)[107] |
28.3 (5.4)[199] |
3.80 (3.29,4.31) |
−1.30 (−2.13,−0.47) |
adjusted for occupation, age, age group, and factory including a random effect of sibling pair.
No standard errors available for groups.
All of the five studies showed higher TC levels in migrants vs. rural (range 4.0 to 35.1 mg/dL, significant differences in four); all of the three studies showed non-significant lower TC levels in migrants vs. urban (range −1.9 to −4.1 mg/dL) (Table 4w, Web only). Three out of four studies reported significantly higher LDL levels in migrants vs. rural (range 5.3 to 30.3 mg/dL); two out of three studies reported non-significant lower LDL levels in migrants vs. urban (range −1.0 to −3.9 mg/dL) (Table 5w, Web only). Finally, two out of three studies showed lower HDL levels in migrants vs. rural (range −0.1 to −1.8 mg/dL, one significant difference); one out of two studies showed lower HDL levels in migrants vs. urban (absolute difference 1.2 mg/dL) (Table 6w, Web only).
Effect of rural-to-urban migration on uncommonly reported CV risk factors
In two studies[8,9] WHR values in migrants were significantly higher than in the rural and urban (range 0.01 to 0.06, and −0.01, respectively). Three studies[7,9,20] showed larger waist circumference levels in migrants vs. rural (range 0.6 to 12.0 cm, significant differences in two); one study[9] showed shorter waist circumference levels in migrants vs. urban (difference −3.3 cm, 95% CI −1.4 to −5.2). In one study,[9] a significant larger hip circumference was shown in migrants vs. rural (difference 7.0 cm, 95% CI 6.1-8.0) and significant shorter hip circumference in migrants vs. urban (difference −4.5 cm, 95% CI −2.9 to −6.1). Two studies[9,16] showed larger triceps skinfolds thickness in migrants vs. rural (range 0.1 to 10.9 mm, one significant difference); one study reported significantly shorter triceps skinfolds thickness in migrants vs. urban (difference −8.9 mm, 95% CI −5.5 to −12.3).
Two out of three studies[7,9,20] reported higher mean or geometric mean glucose values in migrants vs. rural; two studies[9,24] reported lower mean or geometric mean glucose values in migrants vs. urban. Three studies[8,9,20] showed higher mean or geometric mean fasting insulin levels in migrants vs. rural; two of the studies[8,9] also showed lower fasting insulin levels in migrants vs. urban. The mean or geometric means of HOMA scores were significantly higher in migrants vs. rural in two studies;[9,20] in one study[9] the geometric mean of the HOMA score was significantly lower in migrants vs. urban. Geometric means of fibrinogen and CRP in migrants were significantly higher vs. rural, and similar to the values in urban.[9]
The observed gradient for most of commonly and uncommonly reported CV risk factors among migrants, rural and urban groups was found in both males and females separately.
Meta-analyses in subgroups of studies
Due to limited availability of CV risk factors, we only included SBP, DBP, and BMI in these meta-analyses. Substantial heterogeneity of effects among studies and no evidence of publication bias were seen in all three sets of meta-analyses.
Five studies[6,92,20-22] fulfilled our first pre-specified criteria of being cross-sectional studies, with a random sampling frame for migrants, and with at least 5 years of urban exposure for migrants. No differences were found between migrants and rural individuals in terms of SBP, DBP or BMI. A pattern of significantly lower SBP (MD −3.5 mmHg, 95% CI −5.6 to −1.4) and lower DBP (MD −3.0 mmHg, 95% CI −4.2 to −1.72) in migrants vs. urban was seen overall and for both males and females.
Fourteen studies were cross-sectional (Table 1) fulfilling our second pre-specified criteria, and thirteen studies were published after 1990 (Table 1) fulfilling our third criteria. Gradients were similar to the overall results for SBP, DBP and BMI on these subgroups.
DISCUSSION
Main findings
Studies conducted in LMIC evaluating the effect of within-country migration on CV risk factors showed substantial heterogeneity with respect to design, sample size, time of urban exposure, migrant sampling frame, and reported CV risk factors between migrants and rural or urban individuals. In general, when observing the absolute differences between migrants and comparison groups, a gradient for most of the commonly reported CV risk factors was noted: higher values or rates in migrants in comparison to rural individuals, and lower values or rates in migrants in comparison to urban individuals. This gradient was also seen in most of the studies when evaluating males and females separately. Nevertheless, against our hypothesis, some CV risk factors such as hypertension rates, HDL, fibrinogen and CRP levels did not follow any gradient.
What the current literature reports
The effect of international migration to developed countries on CV risk factors has been systematically studied by McKay et al.[4] These migrants are exposed not only to increased consumption of saturated fats and sugars and sedentary behavior but also to stressful life conditions. International migrants have poorer health and more disadvantaged CV risk factor profile than non-migrants, and this profile may worsen with increasing duration of stay in the urban environment.
Rural-to-urban within-country migration is a very common phenomenon in LMIC countries,[5] largely due to economic reasons. Its effects on CV risk factors have been poorly studied,[26] mostly for blood pressure/hypertension and BMI/obesity. Even less information is available for lipid profiles[27] or emerging and newer CV risk factors (e.g. CRP, fasting insulin, HOMA scores, fibrinogen).[9]
In the context of LMIC, urban-rural comparisons are of limited relevance in examining the effects of urban migration as the urbanization process in these countries is due to growth of existing urban populations, expansion of urban boundaries, and rural-to-urban migration.[28] Also particular genetic, cultural and life-style backgrounds of migrants and urban individuals further limit the value of urban-rural comparisons. However, several urban-rural comparisons of CV risk factors have been published in the literature. Comparisons of urban and rural areas in sub-Saharan Africa[29] and India[30] showed higher rates of hypertension, obesity and adverse lipid profiles for urban individuals; however, no differences between urban and rural areas for these risk factors have lately been found in China.[31]
What our study adds to current literature
We hypothesized that there would be a gradient with worse CV profile for the urban individuals than for migrants and worse for migrants than for rural individuals. This was the case for most of the CV risk factors; in most cases reported differences were significant. Some CV risk factors such as hypertension rates, HDL, fibrinogen and CRP levels did not follow any gradient. It seems implausible that these CV risk factors are not modified by migration given significant modifications of major risk factors, but recent reports, at least for blood pressure levels, suggest that the patterns of change following migration are very complex and do not necessarily follow the expected gradient.[23,32] An alternative explanation may include the scarcity of studies. Our chosen studies did not evaluate the effect of modified CV risk factors on CV events, and the gradients may or may not be associated to differential CV events across groups in the future. Thus, long-term longitudinal evaluations are necessary.
The gradient urban-migrant-rural for most of CV risk factors seems relevant in the context of studies with substantial heterogeneity. Recognizing the sources of heterogeneity, we secondarily analyzed three subgroups of studies. Cross-sectional and after 1990 subgroups of studies showed similar gradients between urban, migrant and rural as seen in all studies. The subgroup of cross-sectional studies with random sampling of migrants and at least 5 years of urban exposure for migrants showed lower SBP and DBP for migrants in comparison to urban individuals and non-significant differences between migrants and rural individuals. Although subgroup results should be taken with caution as heterogeneity of effects remained significant in all three subgroups of studies, they may highlight potential changes of gradient with longer urban exposure for migrants.
There was a notorious paucity of information on other important anthropometric risk factors (e.g. WHR, hip circumference, triceps skinfolds thickness) or metabolic and inflammation risk factors (e.g. glucose, fasting insulin, insulin resistance scores, fibrinogen, CRP). Our conclusions for these infrequently reported risk factors are weak at this moment and deserve further reevaluation in the future.
Only 6 studies[6,8,9,18,25,26] provided adjusted values of CV risk factors or adjusted estimates of the differences between migrants and controls. Adjusters included age, BMI, gender, socioeconomic status, education, occupation, marital status, physical activity, initial health status, and altitude. Most of these studies were published in 2009 and 2010, with the exception of the Yi Migrant[6] and Yi People[18] studies. Our main and secondary analyses were based on unadjusted values of CV risk factors, and therefore some bias may be present in our association measures between migration groups. Combination of adjusted metrics was not possible given the different sets of confounders adjusted for, the heterogeneity of studies, and the limited number of studies.
Limitations
First, we included studies that were heterogeneous with respect to several characteristics and therefore a meta-analysis of all studies was not possible. Pre-specified subgroups of more homogeneous studies also showed significant heterogeneity and subgroup results should be taken with caution. Second, we evaluated unadjusted differences between groups, as only unadjusted values were published by authors for most of the studies. Few recent studies provided adjusted values for a few of the CV risk factors we used in our analyses. Third, publication bias is always a concern in a systematic review; however we decreased it in our study by having no language restrictions, by using a comprehensive study search strategy in 4 literature engines, and by involving 2 groups of investigators with at least 2 researchers in each group. Fourth, we expect some differences on the effect of within-country migration on CV risk factors across different countries and continents. We could not explore this hypothesis given the few numbers of studies available. Finally, the scarcity of reporting of several metabolic and inflammatory risk factors did not allow reaching stronger conclusions of the effect of migration on them.
Conclusions
Studies investigating the effect of rural-to-urban within-country migration on CV risk factors in LMIC are highly heterogeneous. Most of CV risk factors in migrants follow a gradient: higher or more frequent than in the rural groups, and lower or less frequent than the urban groups. Furthermore, some CV risk factors, such as hypertension rates, HDL, fibrinogen and CPR levels did not follow a pattern. Such gradients may or may not be associated to differential CV events across groups and long-term longitudinal evaluations of such associations remain necessary.
Supplementary Material
Acknowledgments
FUNDING STATEMENT The CRONICAS Center of Excellence in Chronic Diseases at UPCH is funded by the National Heart, Lung and Blood Institute (NHLBI), under contract No. HHSN268200900033C. The funders had no role in study design; data collection, analysis, or interpretation; in writing the report, or in the decision to submit the article for publication. The researchers are all independent from the funding source.
Footnotes
COMPETING INTERESTS None for all authors
AUTHOR CONTRIBUTIONS Conception and design: AVH, JJM
Analysis and interpretation of data: AVH, VP, AD, AB-O, JJM
Drafting of the article: AVH, JJM
Critical revision of the article for intellectual content: AVH, VP, AD, AB-O, JJM
Final approval of the article: AVH, VP, AD, AB-O, JJM
Statistical expertise: AVH
Collection and assembly of data: VP, AD, AVH
REFERENCES
- 1.World Health Organization . Preventing chronic diseases: A vital investment. World Health Organization; Geneva: 2005. WHO Global Report. [Google Scholar]
- 2.Daar AS, Singer PA, Persad D Leah, et al. Grand challenges in chronic non-communicable diseases. Nature. 2007;450:494–96. doi: 10.1038/450494a. [DOI] [PubMed] [Google Scholar]
- 3.Patel RB, Burke TF. Urbanization --An Emerging Humanitarian Disaster. N Engl J Med. 2009;361:741–3. doi: 10.1056/NEJMp0810878. [DOI] [PubMed] [Google Scholar]
- 4.McKay L, Macintyre S, Ellaway A. Migration and health: a review of the international literature. Medical Research Council, Social & Public Health Sciences Unit, University of Glasgow; Glasgow: 2003. Occasional paper No. 12. [Google Scholar]
- 5.Nadim A, Amini H, Malek-Afzali H. Blood pressure and rural-urban migration in Iran. Int J Epidemiol. 1978;7:131–8. doi: 10.1093/ije/7.2.131. [DOI] [PubMed] [Google Scholar]
- 6.He J, Klag MJ, Whelton PK, et al. Migration, blood pressure pattern, and hypertension: The Yi Migrant Study. Am J Epidemiol. 1991;134:1085–101. doi: 10.1093/oxfordjournals.aje.a116012. [DOI] [PubMed] [Google Scholar]
- 7.Ramirez-Zea M, Melgar P, Flores R, et al. Physical fitness, body composition, blood pressure and blood metabolic profile among young Guatemalan adults. Food Nutr Bull. 2005;26:S88–S97. doi: 10.1177/15648265050262S109. [DOI] [PubMed] [Google Scholar]
- 8.Ebrahim S, Kinra S, Bowen L, et al. The effect of rural-to-urban migration on obesity and diabetes in India: a cross-sectional study. PLoS Med. 2010;7:e1000268. doi: 10.1371/journal.pmed.1000268. [DOI] [PMC free article] [PubMed] [Google Scholar]
- 9.Miranda JJ, Gilman RH, Smeeth L. Differences in cardiovascular risk factors in rural, urban and rural-to-urban migrants in Peru. Heart. 2011;97:787–96. doi: 10.1136/hrt.2010.218537. [DOI] [PMC free article] [PubMed] [Google Scholar]
- 10. http://data.worldbank.org/about/country-classifications/country-and-lending-groups Accessed on July 31, 2010 .
- 11.Stroup DF, Berlin JA, Morton SC, et al. Meta-analysis of observational studies in epidemiology. A proposal for reporting. Meta-analysis Of Observational Studies in Epidemiology (MOOSE) group. JAMA. 2000;283:2008–12. doi: 10.1001/jama.283.15.2008. [DOI] [PubMed] [Google Scholar]
- 12.Moher D, Liberati A, Tetzlaff J, et al. Preferred Reporting Items for Systematic Reviews and Meta-analyses: The PRISMA statement. PLoS Med. 2009;6:e1000097. doi: 10.1371/journal.pmed.1000097. [DOI] [PMC free article] [PubMed] [Google Scholar]
- 13.DerSimonian R, Laird N. Meta-analysis in clinical trials. Control Clin Trials. 1986;7:177–88. doi: 10.1016/0197-2456(86)90046-2. [DOI] [PubMed] [Google Scholar]
- 14.Cruz-Coke R, Etcheverry R, Nagel R. Influence of migration on blood-pressure of easter islanders. Lancet. 1964;1:697–9. doi: 10.1016/s0140-6736(64)91521-1. [DOI] [PubMed] [Google Scholar]
- 15.Benyoussef A, Cutler JL, Levine A, et al. Health effects of rural-urban migration in developing countries-Senegal. Soc Sci Med. 1974;8:243–4. doi: 10.1016/0037-7856(74)90093-6. [DOI] [PubMed] [Google Scholar]
- 16.Poulter N, Khaw KT, Hopwood BEC, et al. Blood pressure and its correlates in an African tribe in urban and rural environments. J Epidemiol Community Health. 1984;38:181–6. doi: 10.1136/jech.38.3.181. [DOI] [PMC free article] [PubMed] [Google Scholar]
- 17.Poulter NR, Khaw KT, Hopwood BEC, et al. The Kenyan Luo migration study: observations on the initiation of a rise in blood pressure. BMJ. 1990;300:967–72. doi: 10.1136/bmj.300.6730.967. [DOI] [PMC free article] [PubMed] [Google Scholar]
- 18.He J, Tell GS, Tang Y-C, et al. Effect of migration on blood pressure: The Yi People Study. Epidemiology. 1991;2:88–97. doi: 10.1097/00001648-199103000-00002. [DOI] [PubMed] [Google Scholar]
- 19.Yamauchi T, Umezaki M, Ohtsuka R. Influence of urbanisation on physical activity and dietary changes in Huli-speaking population: a comparative study of village dwellers and migrants in urban settlements. Br J Nutr. 2001;85:61–73. doi: 10.1079/bjn2000208. [DOI] [PubMed] [Google Scholar]
- 20.Lindgarde F, Ercilla M Benavente, Correa L Retamozo, et al. Body adiposity, insulin, and leptin in subgroups of Peruvian Amerindians. High Alt Med Biol. 2004;5:27–31. doi: 10.1089/152702904322963663. [DOI] [PubMed] [Google Scholar]
- 21.Hollenberg NK, Mohres E, Meinking T, et al. Stress and blood pressure in Kuna amerinds. J Clin Hypertens. 2005;7:714–20. doi: 10.1111/j.1524-6175.2005.04717.x. [DOI] [PMC free article] [PubMed] [Google Scholar]
- 22.McCullogh ML, Chevaux K, Jackson L, et al. Hypertension, the Kuna, and the epidemiology of flavanols. J Cardiovasc Pharmacol. 2006;47(Suppl 2):S103–S109. doi: 10.1097/00005344-200606001-00003. [DOI] [PubMed] [Google Scholar]
- 23.Unwin N, McLarty D, Machibya H, et al. Changes in blood pressure and lipids associated with rural to urban migration in Tanzania. J Hum Hypertens. 2006;20:704–6. doi: 10.1038/sj.jhh.1002056. [DOI] [PubMed] [Google Scholar]
- 24.Szklarska A, Lipowicz A, Lopuszanska M, et al. Biological condition of adult migrants and nonmigrants in Wroclaw, Poland. Am J Hum Biol. 2008;20:139–45. doi: 10.1002/ajhb.20691. [DOI] [PubMed] [Google Scholar]
- 25.Khan MMH, Kraemer A. Factors associated with being underweight, overweight and obese among ever-married non-pregnant urban women in Bangladesh. Singapore Med J. 2009;50:804–13. [PubMed] [Google Scholar]
- 26.Lu Y. Rural-urban migration and health: Evidence from longitudinal data in Indonesia. Soc Sci Med. 2010;70:412–19. doi: 10.1016/j.socscimed.2009.10.028. [DOI] [PMC free article] [PubMed] [Google Scholar]
- 27.He J, Klag MJ, Wu Z, et al. Effect of migration and related environmental changes on serum lipid levels in southwestern Chinese men. Am J Epidemiol. 1996;144:839–48. doi: 10.1093/oxfordjournals.aje.a009018. [DOI] [PubMed] [Google Scholar]
- 28.Lyngdoh T, Kinra S, Shlomo YB, et al. Sib-recruitment for studying migration and its impact on obesity and diabetes. Emerg Themes Epidemiol. 2006;3:2. doi: 10.1186/1742-7622-3-2. [DOI] [PMC free article] [PubMed] [Google Scholar]
- 29.Addo J, Smeeth L, Leon DA. Hypertension in Sub-Saharan Africa: a systematic review. Hypertension. 2007;50:1012–8. doi: 10.1161/HYPERTENSIONAHA.107.093336. [DOI] [PubMed] [Google Scholar]
- 30.Reddy SK, Shah B, Varghese C, et al. Responding to the threat of chronic diseases in India. Lancet. 2005;366:1744–9. doi: 10.1016/S0140-6736(05)67343-6. [DOI] [PubMed] [Google Scholar]
- 31.Wang Y, Mi J, Shan XY, et al. Is China racing an obesity epidemic and the consequences? The trends of obesity and chronic disease in China. Int J Obes. 2007;31:177–88. doi: 10.1038/sj.ijo.0803354. [DOI] [PubMed] [Google Scholar]
- 32.Unwin N, James P, McLarty D, et al. Rural to urban migration and changes in cardiovascular risk factors in Tanzania: a prospective cohort study. BMC Public Health. 2010;10:272. doi: 10.1186/1471-2458-10-272. [DOI] [PMC free article] [PubMed] [Google Scholar]
Associated Data
This section collects any data citations, data availability statements, or supplementary materials included in this article.