

Abstract
The characterisation of stem cells is of vital importance to regenerative medicine. Failure to separate out all stem cells from differentiated cells before therapies can result in teratomas – tumours of multiple cell types. Typically, characterisation is performed in a destructive manner with fluorescent assays. A truly non-invasive method of characterisation would be a major breakthrough in stem cell-based therapies. Raman spectroscopy has revealed that DNA and RNA levels drop when a stem cell differentiates into other cell types, which we link to a change in the relative sizes of the nucleus and cytoplasm. We also used Raman spectroscopy to investigate the biochemistry within an early embryo, or blastocyst, which differs greatly from colonies of embryonic stem cells. Certain cell types that differentiate from stem cells can be identified by directly imaging the biochemistry with CARS microscopy; examples presented are hydroxyapatite – a precursor to bone, and lipids in adipocytes.
Keywords: Raman spectroscopy, CARS microscopy, stem cells, live cells, differentiation
Introduction
In stem cell biology and regenerative medicine, two significant challenges[1,2] are the control of differentiation and reprogramming of stem cells, and ensuring the purity of isolated cells for clinical applications. Both can be tackled by careful monitoring and characterisation of the cells. Stem cell differentiation is normally measured by immunocytochemistry[3,4] – labelling with fluorescent[5,6] antibodies, which is often destructive, or at least greatly perturbs the cell. There is a need for a non-invasive, label-free technique which is able to rapidly monitor the behaviour of stem cells, especially the degree of differentiation. Fluorescent biomarkers have shortcomings: photobleaching prohibits longterm studies of differentiation and causes an increase in toxicity; and saturating the cell membrane with antibodies will affect the cell’s surface biochemistry. Mass spectrometry and reverse transcription polymerase chain reaction (rtPCR) are two other widely used cell characterisation techniques, but both these alternatives are destructive. If all cells are not measured to be fully differentiated into the desired cell type before clinical use, a cancer-like growth called a teratoma[7] could result from any remaining stem cells. A non-destructive test – in which cells that have been analysed can later be used in clinical applications – may then serve to facilitate the translation of approaches in regenerative medicine to use.
Raman spectroscopy is a form of vibrational spectroscopy using visible or near-infrared light, which has two main advantages over infrared spectroscopy. Firstly, the far shorter wavelengths enable sub-cellular resolution; and secondly, water strongly absorbs infrared light in cells. In Raman spectroscopy,[8] alaser is focussed onto a biomolecule, which causes some excitation photons to be frequency-shifted after exciting a vibrational mode. The frequencies of vibration within molecules and of different molecular species are well characterised. A cell contains a large variety of molecules, so a spectrum of the light gives a fingerprint of the biochemical composition of the cell. The laser power can be maintained at a level where photodamage is not an issue,[9] so the technique can be considered to be non-invasive as well as being label-free. The only drawback with Raman spectroscopy is its long acquisition time, which has until very recently prevented any Raman microscopy on live cells. Instead of acquiring a spectrum at each pixel, new systems[10,11] achieve Raman microscopy of live cells by illuminating a line and collecting a set of spectra from all points along this line, in parallel.
Coherent anti-Stokes Raman scattering (CARS) microscopy[12–17] is around five orders of magnitude faster than Raman spectroscopy. Raman spectroscopy uses a high frequency laser to excite a low frequency vibration, so these molecular bonds are not resonantly excited and the signal levels are low. CARS microscopy uses two lasers operating at different frequencies, whose beat (or difference) frequency is matched to the required vibrational frequency of a particular molecular bond. This far more resonantly excites the vibrational bond, achieving pixel dwell times in the microsecond range, but in standard CARS microscopy only one type of vibration can be excited at a time. Multiplex CARS microscopy[18,19] uses one laser with a broad spectral range to excite many vibrations at once. Ultra-broadband multiplex CARS[20–24] is able to excite all vibrations at the same time, but with a pixel dwell time of around 50 ms, it is only as fast as Raman microscopy with line illumination.
The sensitivity of Raman spectroscopy is extremely high when applied to live cells,[25] including monitoring of subtleties of cell behaviour such as viability,[26] various diseases[27] and cancer.[28]
Raman spectroscopy is non-invasive: it has been proven that for continuous-wave (CW) lasers, ‘the amount of damage depends on the total laser light dose only and not on the intensity of the laser light. This agrees with the observation mentioned earlier that total laser irradiation dose on a cell seems to be the parameter determining cell survival and not the intensity of the laser light. Therefore the influence of two or multiphoton absorption processes is considered to be negligible’.[29] Heating has been measured in live cells, with 100 mW of 1064 nm radiation: a temperature rise of less than 1 °C was observed.[9] In CARS microscopy, photodamage[30,31] can occur at lower powers because of the increased likelihood of multi-photon absorption with picosecond pulsed lasers. Despite extensive deployment on various samples, we never observed any visible photodamage in CARS microscopy of live cells, using the powers in Figs 7 and 8.
Figure 7.

CARS microscopy of ADSCs differentiated (7 days) into adipocytes (fat cells). Left: transmitted light image; centre: CARS image; right: CARS image in green, superimposed on transmitted light image. The CARS frequency was tuned to 2845 cm−1 (C–H2 stretch, dominated by lipids) with 12 mW of average laser power at the sample at 817.0 nm, and 8 mW at 1064.4 nm. The image size is 60 μm, and the pixel dwell time is 410 μs (512 × 512 pixels, 120 s total).
Figure 8.

CARS microscopy of ADSCs differentiated (7 days) into confluent osteoblasts (bone cells). Left: transmitted light image; centre: CARS image; right: CARS image in green, superimposed on transmitted light image. The frequency was tuned to 960 cm−1 (dominated by hydroxyapatite), with 12 mW of average laser power at the sample at 965.7 nm, and 8 mW at 1064.4 nm. The image size is 100 μm, and the pixel dwell time is 410 μs (512 × 512 pixels, 120 s total).
Raman Spectroscopy of Stem Cells
Raman spectroscopy has been applied to the study of stem cells and their differentiated cells[32,33]. Notingher et al.[34] used Raman spectroscopy to examine live murine embryonic stem cells over the course of 16 days of differentiation. They measured a decrease in the intensity of the O–P–O stretch vibration associated with RNA (813 cm−1) by 75% and a decrease of 50% in the DNA peak intensity (cytosine ring vibration, 788 cm−1). They also produced a principal component spectrum, which is a measure of the variances between spectra of the stem cell group and differentiated cell group. This principal component spectrum shares many similarities with the spectrum of RNA, and confirms that a reduction in RNA levels dominates the changes in biochemistry during the process of cell differentiation.
Chan et al.[35] used Raman spectroscopy to examine live human embryonic stem cells (hESCs) during differentiation into cardiomyocytes. They distinguished hESCs from cardiomyocytes differentiated from hESCs with an accuracy of 66%. They also observed that the RNA peak (811 cm−1) and DNA peaks (785, 1090 cm−1) dropped in intensity during differentiation, thereby confirming the observation by Notingher et al.[34]. Recently, Schulze et al.[36] used Raman spectroscopy to distinguish hESCs from cells which had been spontaneously differentiated. Results were displayed either as principal component spectra or as the ratios of protein (757 or 853 cm−1) to DNA (784 cm−1) bands. In either case, distinguishing ten cells of each cell type from each other was perfectly achieved, and both methods had similar sensitivities.
We performed Raman spectroscopy with a Renishaw InVia system (785 nm, 40 mW at the sample), with a 0.75 numerical aperture lens on an inverted microscope. The illuminating beam underfills the objective, resulting in a 0.25 numerical aperture of illumination. This corresponds to a spot size of ~2 μm laterally and ~20 μm axially. Cells are grown on quartz coverslips (SPI supplies), but as adhesion is poor for many cell types grown directly onto quartz or glass, a coating of polylysine – or for embryonic stem cells, Matrigel (BD Biosciences) – is required for adhesion. Live cells on quartz are transferred to a holder, topped up with culture media, sealed and placed on the Raman microscope. Exposure to the laser causes no visible changes to cell morphology, and cells survive for several hours at room temperature without CO2.
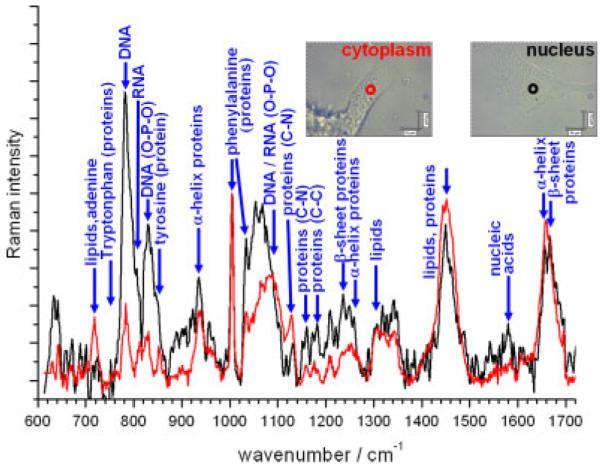
Figure 1 shows a phase contrast image of a colony of live embryonic stem cells. The cell line is RCM-1, acquired from the UK Stem Cell Bank, which was cultured in mTeSR1 (Stem Cell Technologies) without antibiotics or fungicides. There are significant differences between spectra from the nucleus and cytoplasm because of a vastly different biochemical composition. This has not been measured in previous studies of live embryonic stem cells which were averaged over at least three cells[36] or around ten cells.[34] The cytoplasm contains higher levels of protein and glycogen in the cytoplasm – as expected – and far lower levels of RNA. Spectra acquired from two different nuclei on the same sample, shown in blue and red in Fig. 1, have a high similarity and reproducibility. Minor differences are in part due to noise levels, and in part to the slightly different chemical compositions of different cells.
Figure 1.

Full Raman spectra of live hESCs (cell line RCM-1, Roslin Cells). Red and blue curves were acquired from the nucleus of different cells, and the black curve was acquired from the cytoplasm (regions being defined from phase contrast images inset). All spectra were acquired in two accumulations of 500 s and had the spectrum of the quartz substrate removed and the baseline subtracted manually to flatten the spectra. Intensities of both spectra were normalised to the level of phenylalanine (1004 cm−1).
The cells away from the tightly packed colonies do not retain the pluripotency of the stem cells within the colony (i.e. will not divide again); and some cells away from the colonies undergo terminal differentiation. In Fig. 2, we compare the spectra acquired on the embryonic stem cells to the lone (differentiating) cells, and observe a number of differences. The embryonic cells have higher peaks of DNA (around 784 cm−1) and RNA (811 cm−1) than the lone cells, which are most likely no longer pluripotent (or ‘stem cell-like’). This compares well with the findings discussed earlier of Schulze et al.[36] and Notingher et al.[34]
Figure 2.
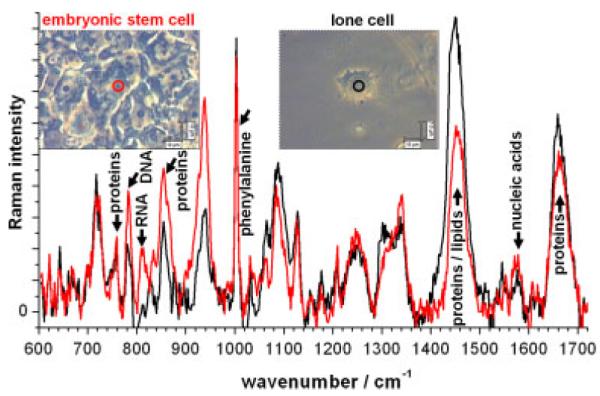
Raman spectra from a live human embryonic cell (red curve, from the centre of the colony) and a darker ‘lone’ live cell (black curve) which is not connected to a colony (so should be in the process of differentiation). Both Raman spectra were acquired in four accumulations of 800 s and had the spectrum of the quartz substrate removed and the baseline subtracted manually to flatten the spectra.
We next investigated a murine blastocyst, which is an E3.5 early stage embryo (extracted at 3.5 days) containing tens of cells. This inner cell mass is contained around a fluid-filled volume called the blastocoel. We acquired spectra from the centre and from the outer part of the blastocyst. These are shown in Fig. 3, with the laser position indicated by a blue or red circle. The fluid-filled region produces a spectrum with few peaks, and very little similarity to the black curve – the colonies of embryonic stem cells from Fig. 2. Analysis of the peaks reveals the contents to be mainly nucleic acid bases and lipids, with virtually no protein, DNA or RNA. The fluid region will not contain a nucleus or structural proteins, so it is no surprise that these peaks are missing. Analysis of the biochemistry of the fluid in the blastocoel shows it contains amino acids[37] and lipids.[38]
Figure 3.

Raman spectra on fixed mouse blastocyst (E3.5, extracted 3.5 days after fertilisation) acquired at the centre (red curve) and focussing on the upper part of the inner cell mass (blue curve). The blastocyst was stored in phosphate buffered saline, and the spectrum of the quartz substrate was removed from both spectra. In addition, the baseline was subtracted manually to flatten the spectra. Both curves were acquired for four accumulations of 800 s, with 40 mW of laser power at 785 nm, and are compared with the spectrum (black curve) from a colony of live embryonic stem cells (line RCM-1).
The spectrum of the inner cell mass (blue curve in Fig. 3) contains all the features of the red curve. Because of the large axial extent of the focal spot (estimated at 20 μm), the laser spot is sensing both an inner cell and some fluid. The rest of the blue curve contains several peaks seen in other cells, such as the phenylalanine band at 1004 cm−1. But there are significant differences between the inner cell and the embryonic stem cells: the inner cells of the blastocyst contain almost no protein (1662 cm−1) and DNA (1096 cm−1). We have probed a wide variety of cell types with Raman spectroscopy (including breast cancer cell lines, fibroblasts, kidney cells and macrophages) and all of these possess a large, broad peak around 1662 cm−1, dominated by proteins. One study measured very low protein levels in the early blastocyst coating.[39]
We progressed to acquire spectra on human mesenchymal stem cells, which are shown in Fig. 4. We acquired separate spectra within the nucleus (black curve) and the cytoplasm (red curve) to distinguish between these two biochemically contrasting regions. The nucleus contains large peaks at 785, 811 and 828 cm−1 (related to DNA and RNA), and these peaks are at very low levels in the cytoplasm. Hence, when the DNA and RNA levels are observed to drop during differentiation,[34,36] this means that either the concentration of DNA and RNA is reducing in the nucleus, or that the nucleus/cytoplasm ratio is decreasing during differentiation. It is well known that the nucleus/cytoplasm volume ratio is high in embryonic stem cells,[40] so this is the most likely interpretation of the reduction in DNA and RNA levels: namely, the nucleus to cytoplasm ratio is decreasing during differentiation.
Figure 4.

A fixed human mesenchymal stem cell probed with Raman spectroscopy in the nucleus (black curve) and cytoplasm (red curve). All spectra have been corrected for the quartz substrate and the baseline has been subtracted manually to flatten the spectra. The same cell line was differentiated into osteoblasts, and a spectrum from a fixed cell is presented (blue curve). All spectra were acquired for 300 s, using a 785 nm laser with 40 mW of power (visible as a yellow spot). Both samples were fixed in paraformaldehyde and stored in phosphate buffered saline.
Live human adipose-derived stem cells (ADSCs) are investigated in Fig. 5. The Raman spectra from the nucleus and cytoplasm regions exhibit significant differences. As expected, higher levels of DNA, RNA and nucleic acids are found in the nucleus, and higher levels of protein are found within the cytoplasm. This may not be clear from the spectra in Fig. 5, which were normalised to the level of phenylalanine (1004 cm−1), but is apparent when considering the relative noise levels of each spectrum. Both the nuclear and cytoplasmic regions have corresponding spectra which differ significantly from their counterparts in the hESCs in Fig. 1 and from the human mesenchymal stem cells in Fig. 4. Thus, each cell type has its own characteristic ‘fingerprint’ spectrum, which can be used to identify the cell type.
Figure 5.
Raman spectra of live ADSCs. The red and black curves were acquired from the cytoplasm and nucleus of different cells (regions being defined from phase contrast images inset). All spectra were acquired in two accumulations of 800 s and had the spectrum of the quartz substrate removed and the baseline subtracted manually to flatten the spectra.
Monitoring Differentiation with Raman Spectroscopy
The human mesenchymal stem cells in Fig. 4 were differentiated for 7 days into osteoblasts (bone cells), and one is probed by Raman spectroscopy in the blue curve. The part of the osteoblast probed seems to be outside the nucleus, judging by the lack of DNA and RNA peaks. A characteristic peak relating to phosphate (mineralisation in the form of calcium hydroxyapatite [Ca5(PO4)3·H2O] is observed at 960 cm−1[41] which is produced in the extracellular matrix. Collagen is also present at 879 and 952 cm−1,[42] and a peak at 1067 cm−1 is attributed to carbonate.[43] Sensitive quantitative chemical analysis of bone and cells involved in bone formation can be performed[44] by calculating the mineral to matrix ratio, and carbonate to phosphate ratio from Raman spectra. The cell fixation process has been shown to have a relatively small effect on the Raman spectrum,[45] so findings from Figs 3 and 4 acquired on fixed cells are equally applicable to live cells.
In Fig. 6, we took human ADSCs (Stempro human ADSC kit, Invitrogen) and differentiated them into osteoblasts (with Stempro osteogenesis differentiation kit, Invitrogen) and into adipocytes (with Stempro adipogenesis differentiation kit, Invitrogen). The morphology changes substantially in both cases, as observed in the phase contrast images. The Raman spectra from all cell types are significantly different, which enables the application of Raman spectroscopy to non-invasive characterisation of cell culture and to monitor the stage of differentiation. The ADSC spectrum is dominated by proteins and lipids, which is true of most cell lines. ADSCs were differentiated into osteoblasts for 16 days, and two representative spectra from different regions are shown in the red and black curves. The two spectra contain different peaks: the black curve contains significant amounts of collagen and phosphate (in hydroxyapatite) and a smaller amount of carbonate. The red curve appears to contain no mineralisation, which suggests that it is concentrated into nodules dispersed across the sample. ADSCs were also differentiated into adipocytes for 7 days, which results in large lipid droplets which are visible in the phase contrast image (inset). As a result, the Raman spectrum is dominated by lipids, which dwarf the reference protein-only peak (phenylalanine, at 1004 cm−1). The peak around 1660 cm−1 is far sharper than those in the other figures, which are a mixture of proteins and lipids, as the vibration is of the C=C bond which is present in both. However, proteins have a lower energy and a higher energy peak – relating to α-helix and β-sheet conformations, respectively – giving rise to a broad peak. Lipids, on the other hand, produce a far sharper peak such as the one in the adipocytes in Fig. 6. Further differentiation results in even larger droplets, and the spectrum is even more dominated by lipids.
Figure 6.

Raman spectra of live ADSCs (top), and their two derivatives: live osteoblasts (centre) and live adipocytes (bottom). The colour-coded curves relate to the regions highlighted in the phase contrast images (inset). Spectra were acquired from ADSCs in two accumulations of 500 s and from adipocytes and osteoblasts in eight accumulations of 400 s. All spectra had the spectrum of the quartz substrate removed and the baseline subtracted manually to flatten the spectra.
Monitoring Differentiation with Cars Microscopy
Raman spectroscopy is relatively slow; in our system, several minutes are required for a good quality spectrum, though a higher power laser, shorter excitation wavelength or a higher throughput spectroscopy system can reduce this time to seconds. Raman microscopy, which requires a spectrum to be acquired at each imaging pixel, is normally far too slow to capture the dynamic behaviour of a live cell in an image. Only a few systems have recently been able to perform live-cell Raman microscopy.[10,11,46] CARS microscopy is a much faster imaging modality, but lacks the subtlety of a full Raman spectrum; in normal operation, only one vibrational frequency is excited in one CARS image.
CARS microscopy was applied to live murine embryonic stem cells by Konorov et al.[47] but the optical arrangement of pulsed lasers only permitted pixel dwell times of 300 ms, compared with the microseconds which is typical in standard CARS microscopy.[13–15] Hence the image quality was poor – probably as a result of the movement of the cells during slow imaging. The authors were unable to distinguish individual cells or features when imaging at DNA or RNA frequencies. However, their CARS spectroscopy did show a significant drop in the intensity of the RNA peak (811 cm−1) in the differentiated cells, which agrees with observations by standard Raman spectroscopy.[34,36]
Our CARS microscope[15] has been used to acquire CARS images of live cells in seconds, and has capabilities of two-photon fluorescence (for simultaneous immunofluorescence imaging), and second-harmonic generation (for tissue imaging). We used CARS microscopy to investigate the chemical structure within adipocytes (fat cells) and osteoblasts (bone cells), differentiated from the same stem cell line. ADSCs were cultured in complete Mesenpro RS medium (Invitrogen) according to the supplier protocol, and used at passage 2. Wells from a Ibidi eight-well microslide were seeded at a cell density of 104 cells/cm2 with 300 μl of cell solution. Cells were induced at 90% confluency towards osteoblasts and adipocytes, respectively, with an osteogenesis and adipogenesis differentiation medium (Invitrogen). The plates were fixed in 4% paraformaldehyde at day 7. In adipocytes, we wanted to investigate the appearance of lipids; and in osteoblasts we searched for the existence of mineralisation.
Figure 7 shows transmitted light and CARS images of adipocytes, tuned to the frequency dominated by lipids – the C–H2 stretch (2845 cm−1). The droplets are visible in the CARS image with extremely high contrast, and are also visible in the transmitted light image due to the high refractive index of lipids (around 1.51 compared with 1.33 for water, and an average of 1.37 for cells). Droplets in neighbouring cells are seen to be at an earlier stage of development, so do not produce as strong a CARS signal. In the early stages of differentiation, some cells start to produce lipid droplets before others. The two neighbouring cells may differentiate later, or not at all.
Figure 8 shows the transmitted light and CARS images of osteoblasts tuned to the frequency of hydroxyapatite mineralisation (960 cm−1). The nodules are visible in the CARS image with good contrast, and are also visible in the transmitted light image – again due to the high refractive index of the material (which for bone is around 1.65). Interestingly, not all the nodules visible in the transmitted light image give a signal of hydroxyapatite in the CARS image (irrespective of their size). These may be collagen or carbonate in origin.
In future, stimulated Raman scattering (SRS) microscopy[48–50] or heterodyne CARS microscopy[51] should be used to remove any non-resonant (background) CARS signal and to acquire a signal that is linearly proportional to concentration. In standard CARS microscopy, the signal level is proportional to the square of the concentration, so the technique is not sensitive to low levels of chemistry. As mentioned earlier, the ratio of the intensities of Raman peaks of tryptophan (853 cm−1) to DNA (784 cm−1) was found to be just as sensitive as the use of the full Raman spectrum in distinguishing stem cells from differentiated cells.[36] This offers the prospect of ratiometric imaging of these two vibrational frequencies by SRS or heterodyne CARS microscopy in future to image the degree of differentiation at a speed far higher than standard Raman microscopy.
Conclusion
Raman spectroscopy is highly sensitive to changes in biochemistry and is applicable to live-cell characterisation as it is non-invasive and label-free. It has been used with extremely high specificity to distinguishing individual stem cells from their derivatives. Raman spectroscopy is well suited to the analysis of cell cultures by averaging a single spectrum acquired over a large area by rastering the sample through the laser spot (or vice versa).
DNA and RNA levels drop during stem cell differentiation, and we related this to the change in size of the nucleus. We were also able to measure the Raman spectra in blastocysts, and measured the biochemistries of both the inner cells and the fluid volume. Both parts of the blastocyst were biochemically very different from each other as well as from the embryonic cell culture.
We were able to non-invasively monitor differentiation from both mesenchymal stem cells and ADSCs into osteoblasts, which produced clear signals of mineralisation after just 7 days. CARS microscopy provided a fast method of imaging the distribution of mineralisation in osteoblasts and of lipids in adipocytes. Both of these cell types were differentiated from ADSCs.
A full Raman spectrum gives an accurate analysis, but in future ratiometric imaging of two vibrational frequencies with heterodyne CARS or stimulated Raman microscopy may potentially be just as sensitive in characterising stem cell culture and differentiation – with the benefit of the high-speed imaging required for live-cell analysis.
Acknowledgements
The authors would like to thank the EPSRC and MRC for funding research projects that contributed to this work (EP/EO07864/1 and G0802632). They would also like to thank Kathy Niakan (University of Cambridge) for the blastocysts and Brendon Noble (University Campus Suffolk) for the mesenchymal stem cells. AD was partly supported by an RCUK fellowship.
Footnotes
This article is part of the Journal of Raman Spectroscopy special issue entitled “Proceedings of the 9th European Conference on Nonlinear Optical Spectroscopy (ECONOS), Bremen, Germany, June 21-23, 2010” edited by Peter Radi (PSI, Villigen, Switzerland) and Arnulf Materny (Jacobs University, Bremen, Germany).
References
- [1].Segers V, Lee R. Nature. 2008;451:937. doi: 10.1038/nature06800. [DOI] [PubMed] [Google Scholar]
- [2].Langer R. Tissue Eng. 2007;13:1. doi: 10.1089/ten.2006.0219. [DOI] [PubMed] [Google Scholar]
- [3].Hoffman L, Carpenter M. Nat. Biotech. 2005;23:699. doi: 10.1038/nbt1102. [DOI] [PubMed] [Google Scholar]
- [4].Nagano K, Yoshida Y, Isobe T. Proteomics. 2008;8:4025. doi: 10.1002/pmic.200800073. [DOI] [PubMed] [Google Scholar]
- [5].Fukuda H, Takahashi J, Watanabe K, Hayashi H, Morizane A, Koyanagi M, Sasai Y, Hashimoto N. Stem Cells. 2006;24:763. doi: 10.1634/stemcells.2005-0137. [DOI] [PubMed] [Google Scholar]
- [6].Pruszak J, Sonntag K, Aung M, Sanchez-Pernaute R, Isacson O. Stem Cells. 2007;25:2257. doi: 10.1634/stemcells.2006-0744. [DOI] [PMC free article] [PubMed] [Google Scholar]
- [7].Blum B, Bar-Nur O, Golan-Lev T, Benvenisty N. Nat. Biotech. 2009;27:281. doi: 10.1038/nbt.1527. [DOI] [PubMed] [Google Scholar]
- [8].Raman C, Krishnan K. Nature. 1928;121:501. [Google Scholar]
- [9].Liu Y, Sonek G, Berns M, Tromberg B. Biophys. J. 1996;71:2158. doi: 10.1016/S0006-3495(96)79417-1. [DOI] [PMC free article] [PubMed] [Google Scholar]
- [10].Hamada K, Fujita K, Smith NI, Kobayashi M, Inouye Y, Kawata S. Proc. SPIE. 2007;6443:64430Z. [Google Scholar]
- [11].Harada Y, Ota T, Ping D, Yamaoka Y, Hamada K, Fujita K, Takamatsu T. Proc. SPIE. 2008;6853:685308. [Google Scholar]
- [12].Maker P, Terhune R. Phys. Rev. 1965;137:A801. [Google Scholar]
- [13].Zumbusch A, Holtom G, Xie X. Phys. Rev. Lett. 1999;82:4142. [Google Scholar]
- [14].Evans C, Potma E, Puoris’haag M, Côté D, Lin C, Xie X. PNAS. 2005;102:16807. doi: 10.1073/pnas.0508282102. [DOI] [PMC free article] [PubMed] [Google Scholar]
- [15].Downes A, Mouras R, Elfick A. J. Raman Spectrosc. 2009;40:757. doi: 10.1002/jrs.2975. [DOI] [PMC free article] [PubMed] [Google Scholar]
- [16].Cheng J-X, Xie X. J. Phys. Chem. B. 2004;108:827. [Google Scholar]
- [17].Heinrich C, Hofer A, Ritsch A, Ciardi C, Bernet C, Ritsch-Marte M. Opt. Express. 2008;16:2699. doi: 10.1364/oe.16.002699. [DOI] [PubMed] [Google Scholar]
- [18].Müller M, Schins J. J. Phys. Chem. B. 2002;106:3715. [Google Scholar]
- [19].Cheng J, Volkmer A, Book L, Xie X. J. Phys. Chem. B. 2002;106:8493. [Google Scholar]
- [20].Kano H, Hamaguchi H. Opt. Express. 2006;14:2798. doi: 10.1364/oe.14.002798. [DOI] [PubMed] [Google Scholar]
- [21].Kano H, Hamaguchi H. J. Raman Spectrosc. 2006;37:411. [Google Scholar]
- [22].Paulsen H, Hilligse K, Thøgersen J, Keiding S, Larsen J. Opt. Lett. 2003;28:1123. doi: 10.1364/ol.28.001123. [DOI] [PubMed] [Google Scholar]
- [23].von Vacano B, Meyer L, Motzkus M. J. Raman Spectrosc. 2007;38:916. [Google Scholar]
- [24].Kee T, Cicerone K. Opt. Lett. 2004;29:2701. doi: 10.1364/ol.29.002701. [DOI] [PMC free article] [PubMed] [Google Scholar]
- [25].Downes A, Elfick A. Sensors. 2007;10:1871. doi: 10.3390/s100301871. [DOI] [PMC free article] [PubMed] [Google Scholar]
- [26].Notingher I. Sensors. 2007;7:1343. [Google Scholar]
- [27].Krafft C, Steiner G, Beleites C, Salzer R. J. Biophoton. 2009;2:13. doi: 10.1002/jbio.200810024. [DOI] [PubMed] [Google Scholar]
- [28].Keller M, Kanter E, Mahadevan-Jansen A. Spectroscopy. 2006;21:33. [Google Scholar]
- [29].Puppels G, Olminkhof J, Segers-Nolten G, Otto C, de Mul F, Greve J. Exp. Cell Res. 1991;195:361. doi: 10.1016/0014-4827(91)90385-8. [DOI] [PubMed] [Google Scholar]
- [30].Fu Y, Wang H, Shi R, Cheng J-X. Opt. Express. 2006;14:3942. doi: 10.1364/oe.14.003942. [DOI] [PubMed] [Google Scholar]
- [31].Nan X, Potma E, Xie X. Biophys. J. 2006;91:728. doi: 10.1529/biophysj.105.074534. [DOI] [PMC free article] [PubMed] [Google Scholar]
- [32].Downes A, Mouras R, Elfick A. J. Biomed. Biotech. 2010;2010:101864. doi: 10.1155/2010/101864. [DOI] [PMC free article] [PubMed] [Google Scholar]
- [33].Chan J, Lieu D. J. Biophoton. 2009;2:656. doi: 10.1002/jbio.200910041. [DOI] [PubMed] [Google Scholar]
- [34].Notingher I, Bisson I, Bishop A, Randle W, Polak J, Hench L. Anal. Chem. 2004;76:3185. doi: 10.1021/ac0498720. [DOI] [PubMed] [Google Scholar]
- [35].Chan J, Lieu D, Huser T, Li R. Anal. Chem. 2009;81:1324. doi: 10.1021/ac801665m. [DOI] [PMC free article] [PubMed] [Google Scholar]
- [36].Schulze H, Konorov S, Caron N, Piret J, Blades M, Turner R. Anal. Chem. 2010;82:5020. doi: 10.1021/ac902697q. [DOI] [PubMed] [Google Scholar]
- [37].Gopichandran N, Leese H. Reproduction. 2006;126:299. doi: 10.1530/rep.0.1260299. [DOI] [PubMed] [Google Scholar]
- [38].Henry J, Wray G, Raff R. Develop. Growth Differ. 1991;33:317. doi: 10.1111/j.1440-169X.1991.00317.x. [DOI] [PubMed] [Google Scholar]
- [39].Morgan P, Kane M. J. Reprod. Fertil. 1993;97:101. doi: 10.1530/jrf.0.0970101. [DOI] [PubMed] [Google Scholar]
- [40].Pralong D, Verma P. Methods Mol. Biol. 2006;348:269. doi: 10.1007/978-1-59745-154-3_19. [DOI] [PubMed] [Google Scholar]
- [41].Crane N. Spectroscopy. 2009;24:9. [Google Scholar]
- [42].Wang Y, Galiotis C, Bader DJ. Biomechanics. 2000;33:483. doi: 10.1016/s0021-9290(99)00194-3. [DOI] [PubMed] [Google Scholar]
- [43].Gourion-Arsiquaud S, Burket J, Havill L, DiCarlo E, Doty S, Mendelsohn R, van der Meulen M, Boskey A. J. Bone Min. Res. 2009;24:1271. doi: 10.1359/JBMR.090201. [DOI] [PMC free article] [PubMed] [Google Scholar]
- [44].Timlin J, Carden A, Morris M. Appl. Spectrosc. 1999;53:1429. [Google Scholar]
- [45].Chan J, Taylor D, Thompson D. Biopolymers. 2009;91:132. doi: 10.1002/bip.21094. [DOI] [PubMed] [Google Scholar]
- [46].Meister K, Niesel J, Schatzschneider U, Metzler-Nolte N, Schmidt DA, Havenith M. Angew. Chem. 2010;49:3310. doi: 10.1002/anie.201000097. [DOI] [PubMed] [Google Scholar]
- [47].Konorov S, Glover C, Piret J, Bryan J, Schulze H, Blades M, Turner R. Anal. Chem. 2007;79:7221. doi: 10.1021/ac070544k. [DOI] [PubMed] [Google Scholar]
- [48].Freudiger C, Min W, Saar B, Lu S, Holtom G, He C, Tsai J, Kang J, Xie X. Science. 2008;322:1857. doi: 10.1126/science.1165758. [DOI] [PMC free article] [PubMed] [Google Scholar]
- [49].Nandakumar P, Kovalev A, Volkmer A. New J. Phys. 2009;11:033026. [Google Scholar]
- [50].Saar B, Freudiger C, Reichman J, Stanley C, Holtom G, Xie X. Science. 2010;330:1368. doi: 10.1126/science.1197236. [DOI] [PMC free article] [PubMed] [Google Scholar]
- [51].Potma E, Evans C, Xie X. Opt. Lett. 2006;31:241. doi: 10.1364/ol.31.000241. [DOI] [PubMed] [Google Scholar]