Errors in Figures. In the Article by Villarruel et al titled “A Randomized Controlled Trial Testing an HIV Prevention Intervention for Latino Youth,” published in the August issue of the Archives (2006;160: 772–777), errors occurred in the symbol keys of Figures 2, 3, and 4 on page 775. The keys should have indicated that the squares represent the health-promotion group and the diamonds represent the human immunodeficiency virus (HIV) risk-reduction group. The corrected figures are reprinted here with their legends.
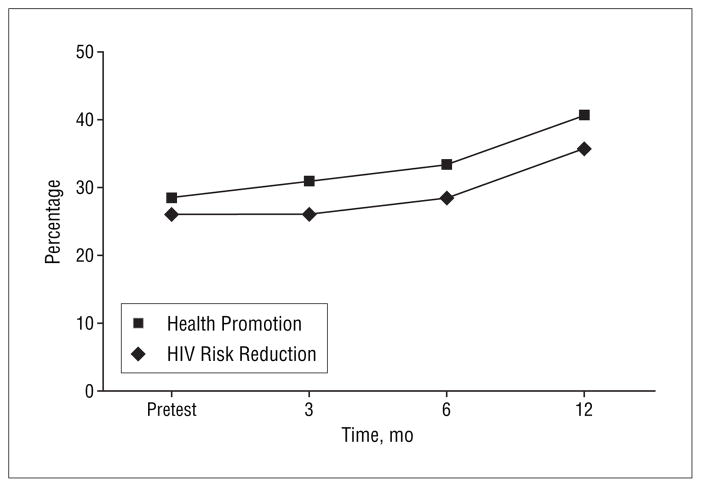
Figure 2.
Self-report of sexual intercourse in the past 3 months. This graph does not represent results of generalized estimation equation analyses. The percentage (SE) was calculated for the outcome variable; unadjusted scores are presented for each time period. Values for the human immunodeficiency virus (HIV) risk-reduction group are as follows: pretest, 25.9% (0.44%); 3 mo, 26.0% (0.44%); 6 mo, 28.4% (0.45%); and 12 mo, 35.7% (0.48%). Values for the health-promotion group are as follows: pretest, 28.4% (0.45%); 3 mo, 31.0% (0.46%); 6 mo, 33.3% (0.47%); and 12 mo, 40.7% (0.49%).
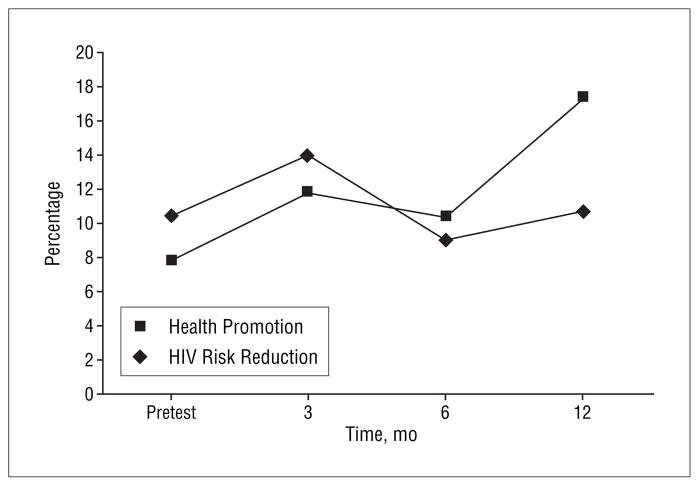
Figure 3.
Self-report of multiple partners in the past 3 months. This graph does not represent results of generalized estimation equation analyses. The percentage (SE) was calculated for the outcome variable; unadjusted scores are presented for each time period. Values for the human immunodeficiency virus (HIV) risk-reduction group are as follows: pretest, 10.4% (0.31%); 3 mo, 14.0% (0.35%); 6 mo, 9.0% (0.29%); and 12 mo, 10.7% (0.31%). Values for the health-promotion group are as follows: pretest, 7.8% (0.27%); 3 mo, 11.7% (0.32%); 6 mo, 10.3% (0.30%); and 12 mo, 17.3% (0.38%).
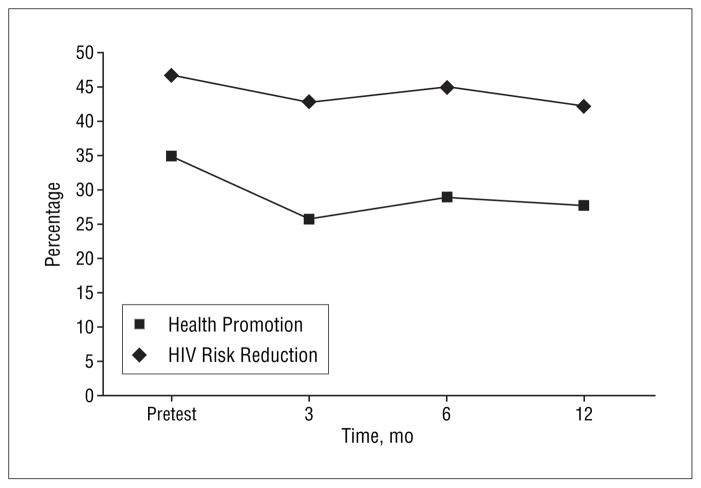
Figure 4.
Consistent condom use in the past 3 months. This graph does not represent results of generalized estimation equation analyses. The percentage (SE) was calculated for the outcome variable; unadjusted scores are presented for each time period. Scores were calculated only for participants who were sexually active at baseline (human immunodeficiency virus [HIV] risk-reduction group [n=106], health-promotion group [n=127]). Values for the HIV risk-reduction group are as follows: pretest, 46.8% (0.50%); 3 mo, 42.6% (0.50%); 6 mo, 44.8% (0.50%); and 12 mo, 42.2% (0.50%). Values for the health-promotion group are as follows: pretest, 34.8% (0.48%); 3 mo, 25.7% (0.44%); 6 mo, 28.8% (0.46%); and 12 mo, 27.6% (0.45%).


