

Abstract
Different neocortical regions are functionally specialized, but whether this specialization is reflected in the forms of plasticity present during developmental critical periods (CPs) is largely unknown. In rodent visual cortex, we recently showed that a form of intrinsic plasticity [LTP of intrinsic excitability (LTP-IE)] in the monocular region of the primary visual cortex (V1M) plays an important role in modulating cortical responsiveness following visual deprivation. Here we ask whether LTP-IE is present and similarly regulated by visual experience in the binocular region of the primary visual cortex (V1B), where inputs from the two eyes compete during the CP. In contrast to V1M, where LTP-IE is present throughout the CP, in V1B LTP-IE was only transiently expressed at the onset of the CP. Also distinct from V1M, brief monocular deprivation (MD) was unable to modulate LTP-IE magnitude in V1B, and even binocular deprivation (the equivalent of MD in V1M) could only influence LTP-IE expression during a narrow time window at the peak of the CP. Finally, we asked whether these differences depend on differences in sensory activation of the two areas during development. MD of ipsilateral inputs from before eye opening (to reduce competitive interactions) did not affect the pattern of LTP-IE expression in V1B. Further, the differences in plasticity in the two cortical areas persisted when animals were reared in the dark to remove all patterned visual input. Thus neocortical LTP-IE expression shows dramatic regional and temporal differentiation, and these differences are not driven by differences in sensory experience.
Introduction
During mammalian postnatal development, critical periods (CPs) occur when the visual cortex is especially sensitive to changes in visual experience (Hubel and Wiesel, 1970; Fagiolini et al., 1994; Gordon and Stryker, 1996). Disruption of visual experience during these CPs can cause impairments of visual function, including loss of visual responsiveness throughout the primary visual cortex (V1), and shifts in ocular dominance (OD) in V1B (Hubel et al., 1977; Shatz and Stryker, 1978; LeVay et al., 1980; Frenkel and Bear, 2004; Kaneko et al., 2008). Most studies have attributed these changes to synaptic plasticity mechanisms (Hensch, 2005; Smith et al., 2009), but we recently showed that plasticity of intrinsic excitability also contributes to experience-dependent changes in layer 5 (L5) of the V1M (Nataraj et al., 2010). In rodent V1M, brief monocular deprivation (MD) suppresses baseline excitability of L5 pyramidal neurons and enhances LTP of intrinsic excitability (LTP-IE) during a CP that closely parallels the classical rodent visual system CP. Here we ask whether LTP-IE is also present and similarly regulated by visual experience in V1B, where inputs from the two eyes compete during the CP.
V1M and V1B are generally assumed to be homogeneous in terms of intracortical connectivity and cellular plasticity mechanisms, and to differ only by virtue of the presence or absence of competitive interactions between inputs from the two eyes. For example, MD reduces visual responsiveness in both regions, but drives OD shifts and spine elimination only where inputs from the two eyes compete (Fagiolini et al., 1994; Gordon and Stryker, 1996; Mataga et al., 2004; Mrsic-Flogel et al., 2007; Kaneko et al., 2008). However, very few studies have directly compared the cellular plasticity mechanisms present in these two regions of V1, so it is largely an open question whether these two closely related cortical areas have evolved to express distinct cellular plasticity mechanisms.
In this study, we directly compared the developmental expression of LTP-IE in V1M and V1B, and the ability of visual experience to modulate LTP-IE magnitude. We found that LTP-IE expression in V1B is limited to a very narrow time window at the end of the third postnatal week, while in V1M it persists into adulthood. Also distinct from V1M, brief MD was unable to modulate LTP-IE magnitude in V1B, and even binocular deprivation (BD) was only able to influence LTP-IE expression during a narrow time window at the peak of the CP. Finally, we asked whether these differences in LTP-IE expression depend on differences in sensory activation of the two areas during development. MD of ipsilateral inputs from before eye opening (to reduce competitive interactions) was unable to convert the pattern of LTP-IE expression in V1B into that of V1M. Further, the differences in plasticity persisted when animals were reared in the dark to remove all patterned visual input. Thus neocortical LTP-IE expression shows dramatic regional and temporal differentiation, and these differences are unlikely to arise purely from differences in sensory experience.
Materials and Methods
All experimental procedures used in this study were approved by the Institutional Animal Care and Use Committee at Brandeis University and followed the guidelines of the National Institutes of Health.
Lid sutures.
Long–Evans rats (male and female) were anesthetized with a mixture of ketamine, xylazine, and acepromazine as previously described (Maffei et al., 2004). For short deprivation (2–3 d), eyelids were sutured as previously described (Maffei et al., 2004). For long deprivation (1–2 weeks), we used eyelid trimming in combination with lid sutures. Aseptic techniques were used for all surgical procedures. Briefly, the area surrounding the eyelids (surgical area) was shaved and disinfected with three courses of sterile saline and dilute betadine. Approximately 1–2 mm of upper and lower eyelid margins were trimmed using fine ophthalmologist scissors. The trimmed edges were cleaned with sterile saline. The trimmed eyelids were sutured together (3–5 mattress sutures) using sterile 7-0 silk sutures (Ethicon) and the surgical area was cleaned again. To avoid infections, a topical antibiotic (Mycitracin, Webster Veterinary) was applied to the surgical area immediately after surgery and twice daily for 2 additional days. For analgesia, animals received two doses of meloxicam (1–2 mg/kg, s.c., Webster Veterinary) with the first dose administered at the start of surgery and the second 24 h later. The animals were allowed to recover completely from the effects of anesthesia before returning to their cages. Sutures were monitored every day. If sutures were not maintained or if the surgical area showed any signs of infection, the animals were not used. For the sham condition, the animals were anesthetized but without any form of deprivation.
Dark rearing.
For dark-rearing (DR) experiments, animals were raised on a normal light/dark (12 h/12 h) cycle until P12. At P12, the entire litter (with the mother) was moved into a light-tight dark box and raised in complete darkness until the day of the experiment, when the rats were anesthetized and decapitated in the dark.
Solutions.
Brain slices were perfused with ACSF (ACSFIntrinsic) that contained 126 mm NaCl, 3 mm KCl, 2 mm MgCl2, 1 mm NaH2PO4, 25 mm NaHCO3, 2 mm CaCl2, 25 mm dextrose, 50 μm APV, 20 μm DNQX, and 20 μm picrotoxin. Solution inside the recording pipette (InternalReg) contained 20 mm KCl, 100 mm K-gluconate, 10 mm HEPES, 4 mm Mg-ATP, 0.3 mm Na-GTP, 10 mm Na-phosphocreatine, and 0.2% biocytin.
Slice preparation and electrophysiology.
Coronal brain slices (300 μm) containing the V1 were obtained as described previously (Maffei et al., 2004, 2006; Maffei and Turrigiano, 2008). The V1M and V1B regions of the V1 were identified as previously described (Maffei et al., 2010). Briefly, V1M and V1B were identified using the rat brain atlas after adjusting for the lambda–bregma distance for age. Additionally, the shape and morphology of the white matter were used to identify V1M and V1B. Care was taken to record from neurons located in the center of each region to avoid neurons on the boundaries. Whole-cell patch-clamp recordings were obtained after visualizing L5 pyramidal neurons in V1B and V1M using infrared differential interference contrast optics. The morphology and location of neurons were verified by processing the slices for biocytin. The morphology of cells included both thin- and thick-tufted neurons (Hattox and Nelson, 2007) and results, similar for both types, were combined. Whole-cell recordings in current-clamp mode were obtained using a MultiClamp 700B (Molecular Devices). The recordings were filtered (at 2–3 kHz) and digitized (at 10 kHz). Data were acquired and analyzed using in-house programs written in IgorPro (Wavemetrics). The basic parameters (membrane potential, Vm; input resistance, Rin; membrane capacitance, Cm; series resistance, Rs; membrane time constant, τm) were probed with 400 ms hyperpolarizing pulse (−10 to −25 pA) at the beginning of every stimulus for the entire recording. For analysis, neurons were excluded if Vm > −60 mV, if Rs > 25 MΩ, or if Rs varied by >25% of its initial value during the experiment. All recordings were performed at 33–35°C. For LTP-IE and firing rate versus current curve (F–I curve) experiments, we injected a small amount of bias current to keep the interstimulus membrane potential at −70 mV. For LTP-IE recordings, intrinsic excitability was measured with a depolarizing pulse (duration, 500 ms; amplitude, 0.1–0.35 nA; interstimulus interval, 15 s). The amplitude was selected such that the firing rate of action potentials (APs) was 6–10 Hz (3–5 APs) and, once determined, fixed for the duration of the experiment. Ten to 15 min of baseline (preinduction) was recorded before inducing LTP-IE. LTP-IE was induced by making the neurons fire at high frequencies (15 spikes at 40 Hz) using a train of short duration DC pulses (4 ± 1 ms, 1–2 nA) to elicit a train of precisely timed single spikes. This pattern was presented every 4 s for a total duration of 10 min. Only neurons with postinduction recordings ≥40 min were included. The strength of LTP-IE was calculated as the ratio of firing rate during the last 10 min of postinduction to the baseline. F–I curves were obtained at the end of baseline and at the end of postinduction recording. To arrive at a scalar measure (F–I index) of intrinsic excitability, we averaged the firing rates of the four highest current injections (e.g., 0.3–0.45 nA in Fig. 3D). For V1B, the data from sensory-deprived (MD, BD) animals were compared with sham animals. For V1M, the data from the deprived hemisphere (contralateral to sutured eye) were compared with the data from the control hemisphere (contralateral to open eye), and for the DR experiments, the DR data were compared with data from matched sham or control hemispheres.
Figure 3.

MDSh does not affect LTP-IE expression, but BDSh has varied effects on LTP-IE expression in V1B with age. For MDSh, V1B recordings were obtained from the hemisphere contralateral to the sutured eye. A, Diagram illustrating the developmental timeline of visual cortex with timing and duration of MDSh and BDSh. B, C, Average time course of LTP-IE expression of neurons from V1B in sham (white circles), MDSh (gray circles), and BDSh (black circles) conditions at P20/P21 (B) and P27/P28 (C). D, E, Average F–I curves of neurons from V1B in sham (white circles), MDSh (gray circles), and BDSh (black circles) conditions at P20/P21 (D) and P27/P28 (E). F, The effects of MDSh and BDSh on LTP-IE magnitude at different developmental ages in V1B (black bars). The numbers denote the sample size. To facilitate comparison of V1B data with published data from V1M, the hatched bars illustrate the average effect of MDSh on LTP-IE magnitude in V1M (from Nataraj et al., 2010).
Statistical analysis.
Unless otherwise indicated, all data are expressed as mean ± SEM for the number of neurons indicated. For within-cell comparisons, paired two-tailed Student's t tests were used. For across-condition comparisons, unpaired two-tailed Student's t tests, ANOVA followed by a post hoc Tukey test, or the nonparametric Kolmogorov–Smirnov and Mann–Whitney tests were used, as appropriate.
Results
LTP-IE expression in V1M is strongly developmentally regulated, and the ability of visual deprivation to enhance LTP-IE magnitude exhibits a CP (Nataraj et al., 2010). This study suggested that in V1M ongoing sensory drive keeps L5 pyramidal neurons in an excitable state, and that brief loss of visual drive could reversibly reduce L5 excitability by preventing the induction of LTP-IE. Here we asked whether LTP-IE plays a similar role in V1B, where most neurons receive input from both eyes.
LTP-IE expression is confined to a narrow developmental window in V1B
In V1M, LTP-IE expression is absent before eye opening (P14/P15), begins to turn on at P18/P19, peaks at P20/P21, and remains at a high level through P34/P35, the oldest age tested (Nataraj et al., 2010) (gray-shaded region in Fig. 1F). If LTP-IE expression is independent of the source of visual drive, the developmental profile of LTP-IE expression in V1B and V1M should be similar. To test this, we obtained slices from V1 of animals at various ages and probed the developmental profile of LTP-IE expression in V1B. Whole-cell recordings were obtained from L5 pyramidal neurons in both V1B and V1M, and LTP-IE was induced by making neurons fire 15 spikes at 40 Hz every 4 s for 10 min, a protocol that is saturating for LTP-IE induction (Nataraj et al., 2010). Before eye opening (P14/P15, Fig. 1C), there was no expression of LTP-IE in V1B. At P20/P21 (Fig. 1A,B), we observed a similar degree of LTP-IE expression in V1B and V1M. Surprisingly, at later ages the expression of LTP-IE diverged between V1M and V1B. At P24/P25, P27/P28, and P34/P35, we could not induce LTP-IE in V1B (Fig. 1C,D,F), in sharp contrast to the robust expression of LTP-IE in V1M (Nataraj et al., 2010) (Fig. 1F). To further verify this difference, we simultaneously recorded L5 pyramidal neurons from V1M and V1B in the same slice. In these pairs of neurons, we obtained no LTP-IE in V1B but robust expression in V1M (Fig. 1E). Thus, the expression of LTP-IE in V1B appears to be restricted to a narrow developmental time window at the very beginning of the classical CP.
Figure 1.

LTP-IE expression in V1B is restricted to the end of the third postnatal week. A, Example of LTP-IE induction in a single neuron from V1B at P20/P21 showing evoked firing rate (top) and Rin (bottom) versus time. The insets show evoked responses (black) and stimulus (gray) before, during, and after LTP-IE induction (not shown at same timescale). B, Average time course of LTP-IE expression (top) and Rin (bottom) of neurons from V1B and V1M at P20/P21. C, D, Average time course of LTP-IE expression of neurons from V1B at P14/P15 (C) and V1B and V1M at P27/P28 (D). E, Average time course of LTP-IE from simultaneously recorded neurons from V1B and V1M at P27/P28. F, LTP-IE magnitude in V1B neurons at different developmental ages. The numbers denote the sample size. The gray area (diagram) represents the average LTP-IE magnitude in V1M at different developmental ages, from data in B and C and from Nataraj et al. (2010). Dotted vertical lines indicate the onset and offset of induction in this and subsequent figures.
Intrinsic excitability of V1B and V1M L5 pyramidal neurons are similar
Our previous work showed that the magnitude of LTP-IE is inversely related to intrinsic excitability levels (Nataraj et al., 2010). This raised the possibility that the lack of LTP-IE in V1B at later ages (>P20/P21) is because intrinsic excitability is higher than in V1M and LTP-IE is thus close to saturation. To test this, we compared intrinsic excitability between V1B and V1M at various developmental ages. F–I curves were obtained in the presence of synaptic blockers from a membrane potential of −70 mV. Interestingly, there were no significant differences in the intrinsic excitability of neurons between V1B and V1M at any age tested (Fig. 2A,C; p > 0.1 at all ages tested). Similarly, there were only minor differences in passive membrane properties (Vm, Rin, Cm, and τm probed with a short duration hyperpolarizing pulse from rest in the presence of synaptic blockers) of L5 neurons in V1B and V1M at some developmental ages (Fig. 2B). However, none of these differences correlated with the ability or inability to induce LTP-IE. These data demonstrate that differences in LTP-IE expression between V1B and V1M cannot be explained by differences in baseline intrinsic excitability.
Figure 2.

Passive membrane properties and intrinsic excitability (F–I curves) of L5 pyramidal neurons are mostly similar between V1B and V1M during early development. A, F–I curves of neurons from V1B and V1M at P20/P21, P27/P28, and P34/P35 (top to bottom). B, Vm, Rin, Cm, and τm (top to bottom) of neurons from V1B and V1M at different developmental ages. The number in each bar (Vm) represents the sample size. C, Examples of evoked responses of neurons from V1B (top) and V1M (middle) to current injection (bottom) at different developmental ages [P20/P21, P27/P28, and P34/P35 (left to right)]. Asterisk denotes a statistical significance of p < 0.05 in this figure and in subsequent figures.
Brief deprivation modulates LTP-IE differently in V1B and V1M
In V1M, short MD (2–3 d, MDSh) enhances LTP-IE magnitude during a CP by reducing intrinsic excitability and moving neurons farther from LTP-IE saturation (data from Nataraj et al., 2010) (hatched bars in Fig. 3F). In V1B, the equivalent manipulation would be a short binocular lid suture (BDSh). To determine whether LTP-IE expression in V1B is modulated by sensory experience, we performed either MDSh or BDSh at different ages (Fig. 3A). Removing the strong contralateral visual drive (MDSh) did not affect the magnitude of LTP-IE in V1B at any age tested (P20/P21, P24/P25, P27/P28, and P34/P35; Fig. 3B,C,F). These data suggest that the intact weak ipsilateral visual drive may be sufficient to maintain neuronal excitability and prevent the enhancement of LTP-IE in V1B. If so, then BDSh in V1B should enhance LTP-IE, similarly to MDSh in V1M. Surprisingly, BDSh at P20/21 enhanced baseline excitability (Fig. 3D) and suppressed, rather than enhanced, LTP-IE in V1B (P20/P21; Fig. 3B,F; V1B sham, n = 9; V1B BDSh, n = 3; p < 0.05). In contrast, at P27/28, when no LTP-IE is detectible in sham V1B neurons, BDSh reduced baseline excitability (Fig. 3E) and unmasked moderate LTP-IE (P27/P28; Fig. 3C,F; V1B sham, n = 6; V1B BDSh, n = 9; p < 0.05). This ability of BD to reduce intrinsic excitability and unmask LTP-IE was confined to a small developmental window at the height of the classical CP, as it was absent at P24/25 and again at P34/35 (Fig. 3F). These data demonstrate that V1B neurons have not irrevocably lost the ability to express LTP-IE at P27/28, but that unmasking LTP-IE requires extreme sensory deprivation, and the graded deprivation induced by MDSh is not sufficient.
A comparison of the effects of brief visual deprivation (MD for V1M and BD for V1B) on LTP-IE magnitude reveals significant divergence between V1M and V1B (Fig. 3F). At P20/21, visual deprivation maximally enhanced LTP-IE in V1M, but suppressed it in V1B. At P27/28, both regions of cortex showed enhancement of LTP-IE; interestingly, although the absolute magnitude of LTP-IE was greater in V1M than in V1B, the difference between control and deprived was similar for both cortical regions (∼30%, Fig. 3F). At P34/35, neither region shows enhanced LTP-IE after visual deprivation, even though LTP-IE persists in V1M at this age. Together, these data show that during the classical CP (between P20 and P35), LTP-IE is dramatically downregulated in V1B relative to V1M, and can only be unmasked by extreme sensory deprivation at the height of the classical CP (P27/28).
Prolonged deprivation of ipsilateral inputs does not unmask LTP-IE expression in V1B
The difference in expression of LTP-IE in V1M and V1B could arise from experience-independent, genetically encoded differences between the two areas. Alternatively, competitive interactions between inputs from the two eyes might modify LTP-IE expression in V1B. If the latter is the case, then eliminating the weak ipsilateral inputs after eye opening (to reduce competition) should make LTP-IE expression more similar in the two cortical regions. Further, we reasoned that brief binocular suture following prolonged monocular suture in V1B might mimic the effects of brief MD in V1M. To test this, we sutured one eyelid from before eye opening (P14/P15) to the day of recordings (P20/P21 or P27/P28), and measured the magnitude of LTP-IE in V1B ipsilateral to the sutured eye (MDLo); additionally, in a subset of experiments, we sutured the remaining eye for 2–3 d before recording (MDLo + BDSh, Fig. 4A). In contrast to our hypothesis, MDLo had no impact on LTP-IE expression in V1B at either age (Fig. 4B–D), nor did it alter intrinsic excitability (data not shown). Further, MDLo + BDSh resembled the effects of BDSh (Fig. 3B,F), as it increased baseline excitability and suppressed LTP-IE (Fig. 4B,D; V1B sham, n = 9; V1B MDLo + BDSh, n = 5; p < 0.05). Thus, preventing patterned visual drive from the weak ipsilateral inputs does not convert the expression pattern of LTP-IE in V1B into that of V1M.
Figure 4.
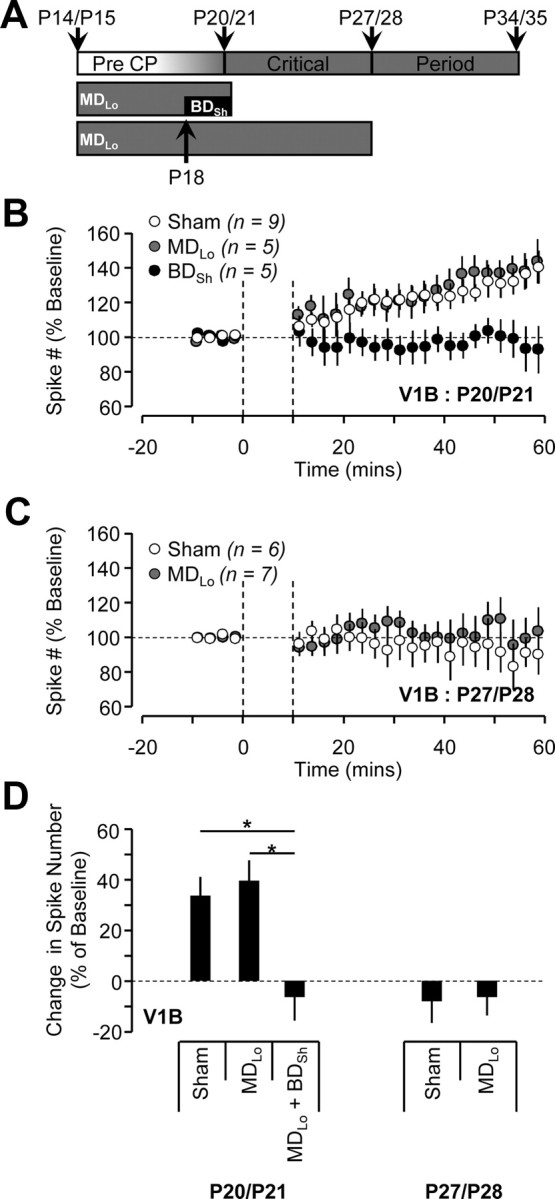
MDLo does not affect LTP-IE expression in V1B. For MDLo, V1B recordings were obtained from the hemisphere ipsilateral to the sutured eye. A, Diagram illustrating the developmental timeline of visual cortex with timing and duration of activity manipulations. B, C, Average time course of LTP-IE expression of neurons in V1B from sham (white circles), MDLo (gray circles), and BDSh (black circles) conditions at P20/P21 (B) and P27/P28 (C). D, The effects of MDLo and MDLo + BDSh on LTP-IE magnitude at different developmental ages in V1B.
In V1M, MDSh enhances LTP-IE at P27/28 (Fig. 3F). To compare this to MDLo, we performed lid suture from just before eye opening and recorded in V1M contralateral to the deprived eye. MDLo enhanced LTP-IE expression at P27/P28 to a similar degree as MDSh (MDSh, n = 5; V1M MDLo, n = 6; p > 0.05). Together with the previous results of brief MD and BD, these data indicate that V1B and V1M respond to similar manipulations of sensory experience quite differently, and suggest that the differences in LTP-IE between these two cortical areas is not determined by the pattern of sensory input from the two eyes.
LTP-IE expression is differentially regulated by DR in V1M and V1B
To further explore the role of sensory drive in regulating the expression of LTP-IE in V1B and V1M, we examined the effect of DR (Fig. 5A) on LTP-IE expression. DR differs from lid suture by (1) providing a uniform deprivation to both V1B and V1M and (2) eliminating all light-driven retinal activity (patterned or unpatterned). To compare the effect of DR between V1B and V1M, we recorded from both regions in slices from the same animals. In V1B, LTP-IE was abolished by DR at P20/P21 (Fig. 5B,D; DR, n = 12; sham, n = 09; p < 0.05) and remained undetectable at P27/P28 (Fig. 5C,D; DR, n = 8; sham, n = 6; p > 0.05). In striking contrast, DR in V1M increased the magnitude of LTP-IE at both ages (Fig. 5E–G; at P20/P21 control; n = 5; DR; n = 14; p < 0.05; P27/P28 control, n = 5; DR, n = 7; p < 0.05), in a manner that resembled the response to MDSh (Fig. 3F). Thus preventing all visually driven activity does not cause both cortical areas to revert to a common state in terms of LTP-IE expression. Rather, DR has opposite effects on this form of plasticity in the two cortical regions. Together, our results clearly show that LTP-IE expression has a dramatically different developmental profile in V1B and V1M, and is modulated differently by the same manipulations of sensory experience.
Figure 5.

DR (1–2 weeks) blocks LTP-IE expression in V1B but enhances the magnitude of LTP-IE in V1M. A, Diagram illustrating the developmental timeline of visual cortex with timing and duration of DR. B, C, Average time course of LTP-IE expression of neurons in V1B from control (white circles) and DR (black circles) conditions at P20/P21 (B) and P27/P28 (C). D, The effects of DR on LTP-IE magnitude at different developmental ages in V1B. E, F, Average time course of LTP-IE expression of neurons in V1M from control (white circles) and DR (black circles) conditions at P20/P21 (E) and P27/P28 (F). G, The effects of DR on LTP-IE magnitude at different developmental ages in V1M.
Discussion
V1B and V1M are generally thought to share similar cytoarchitectural properties and neural plasticity mechanisms, and to differ principally in terms of the source of visual drive (bilateral or unilateral), and thus the absence or presence of competitive interactions between inputs from the two eyes. Here we asked whether V1M and V1B are homogenous in terms of their expression of intrinsic plasticity, and its regulation by visual experience during the classical visual system CP. We show that the developmental acquisition and modulation by visual experience of an important form of intrinsic plasticity (LTP-IE) shows remarkable differences between V1B and V1M: in V1M, LTP-IE turns on during and remains present throughout the classical CP, while in V1B, LTP-IE is turned off at the beginning of the CP. Further, these differences do not arise from differences in visual experience. These data suggest that the visual system CP is not a single unified state, but rather that there are regional and temporal differences in the expression of the cellular plasticity mechanisms that comprise these CPs. Overall, our data suggest that these two closely related visual cortical areas express unique patterns of plasticity, which likely confer region-specific advantages for the maturation and maintenance of visual responses.
Because V1B and V1M are closely related cortical structures that receive similar thalamic drive and have similar visual response properties, we expected V1B and V1M to have a similar developmental profile of LTP-IE expression. Instead, we found remarkable differences in the developmental expression of LTP-IE between V1B and V1M. In both regions, LTP-IE is absent just after eye opening (during the pre-CP), then turns on and has a similar magnitude at P20/P21, the very beginning of the classical CP. However, whereas in V1M expression levels remain elevated throughout the CP, in V1B LTP-IE is immediately downregulated and remains so throughout the CP. The mechanistic and functional reasons for this downregulation remain unclear. Our data suggest that these differences are not a simple consequence of saturation of LTP-IE in the binocular cortex (due perhaps to stronger visual drive or a lower threshold for induction), as (1) neurons are not more excitable in V1B than V1M, and (2) visual deprivation (which should prevent LTP-IE induction and move neurons farther from saturation) generally was not able to unmask LTP-IE in V1B, with the specific exception of BD at P27/28. Instead, our data suggest that the molecular induction or expression pathways for LTP-IE are downregulated in V1B immediately after the opening of the CP. Why this would be advantageous is unclear. Previously, we postulated that LTP-IE might improve the signal-to-noise ratio in monocular cortex by reversibly turning down the gain of inactive neurons while boosting the gain of active neurons (Nataraj et al., 2010). In the binocular cortex, unlike the monocular cortex, properties such as orientation preference must be matched for the two eyes during the CP, and this process requires visual experience (Wang et al., 2010). Perhaps this matching process requires that baseline neuronal excitability stay relatively constant during this period, so that LTP-IE would be counterproductive until this matching is complete.
Cortical networks can respond to various challenges to sensory experience by recruiting a variety of plasticity mechanisms, the choice of which depends on age and the nature of the sensory challenge (Frenkel and Bear, 2004; Kotak et al., 2005; Maffei et al., 2008, 2010; Nelson and Turrigiano, 2008; Breton and Stuart, 2009; Feldman, 2009; Nataraj et al., 2010). In V1B, BD exerted a bidirectional influence on intrinsic excitability and LTP-IE as a function of age. BD increased intrinsic excitability and reduced LTP-IE at the opening of the CP, but reduced intrinsic excitability and increased LTP-IE at the height of the CP. Both synaptic and intrinsic plasticity mechanisms come in homeostatic (Desai et al., 1999, 2002; Turrigiano and Nelson, 2004; Brager and Johnston, 2007; Pratt and Aizenman, 2007; Breton and Stuart, 2009) and nonhomeostatic (Aizenman et al., 2003; Nelson et al., 2003; Sourdet et al., 2003; Cudmore and Turrigiano, 2004; Maffei et al., 2006; Nelson and Turrigiano, 2008) forms. Our data suggest that BD homeostatically increases intrinsic excitability and occludes LTP-IE expression before the CP, but induces an experience-dependent decrease of intrinsic excitability and unmasks moderate LTP-IE at the height of the CP. Interestingly, this later effect was only evident at P27/28. Why BD has such strongly temporally regulated effects on LTP-IE induction remains unclear.
In both V1M and V1B, MD leads to a loss of visual responsiveness over the first 2–3 d (Frenkel and Bear, 2004; Mrsic-Flogel et al., 2007; Kaneko et al., 2008), suggesting that similar plasticity mechanisms might underlie this process in both cortical areas. We were therefore surprised to find that MD had dramatically different effects on LTP-IE induction in V1M and V1B. While MD reduced excitability and enhanced LTP-IE induction during the CP in V1M (Nataraj et al., 2010), MD had no effect on either parameter in V1B. This strongly suggests that the mechanisms by which brief MD induces loss of visual responsiveness in L5 differ between V1B and V1M. This is the first clear demonstration of differences in sensory-evoked cellular plasticity mechanisms between these closely related neocortical areas, and raises the question of how this difference arises. Based on two lines of evidence, our data suggest that these plasticity differences during the CP are not due to the absence or presence of competitive visual experience during development. First, prolonged suturing of the ipsilateral eye to remove patterned visual input from the weak ipsilateral projection to V1B failed to make the pattern of LTP-IE expression more akin to that in V1M. Second, when all visual drive (patterned and unpatterned) was removed by raising animals in the dark from before eye opening, the differences between the two cortical areas persisted. These data strongly suggest either (1) that there are intrinsic, input-independent differences between the two neocortical areas, or (2) that visual experience-independent influences from the ipsilateral eye are critical in differentiating them; for example, the magnitude of drive from spontaneous retinal waves might differ between the monocular and the binocular cortex.
A fundamental difference between V1B and V1M is that the V1B processes the bilateral visual drive while the V1M processes the contralateral visual drive. Thus, they each likely have region-specific specializations to process this information. For example, in the binocular but not the monocular cortex, competitive mechanisms exist that modulate OD and drive dendrite remodeling and spine elimination (Fagiolini et al., 1994; Gordon and Stryker, 1996; Mataga et al., 2004; Mrsic-Flogel et al., 2007; Kaneko et al., 2008; Chen et al., 2011). Additionally, in the binocular cortex, callosal interactions from the contralateral hemisphere play an important role in modulating binocularity and ocular dominance plasticity (Restani et al., 2009; Cerri et al., 2010). However, very little is known about the region-specific specializations in cellular plasticity mechanisms that might underlie similarities and differences in experience-dependent circuit refinement in these two areas. In tree shrews, activation of mAChRs potentiates layer 4 to layer 2/3 synapses in V1B but depresses them in V1M (McCoy et al., 2008), while in rodents there is some evidence for molecular divergence of potentiation mechanisms between the two regions (Spolidoro et al., 2011). On the other hand, inhibitory plasticity in L4 is similar in the two regions (Maffei et al., 2004, 2006, 2010). Our data extend the idea that V1B and V1M are functionally different in important ways by showing that one form of intrinsic plasticity, LTP-IE, displays a distinct developmental profile and differential sensitivity to sensory experience in these two closely related neocortical areas. These data raise the possibility that regional and temporal specificity of intrinsic plasticity mechanisms confers unique region-specific advantages in the maintenance of neuronal responsiveness and the maturation of developing circuits.
Footnotes
This work was supported by National Institutes of Health Grant R01EY014439 (G.T.).
The authors declare no competing financial interests.
References
- Aizenman CD, Akerman CJ, Jensen KR, Cline HT. Visually driven regulation of intrinsic neuronal excitability improves stimulus detection in vivo. Neuron. 2003;39:831–842. doi: 10.1016/s0896-6273(03)00527-0. [DOI] [PubMed] [Google Scholar]
- Brager DH, Johnston D. Plasticity of intrinsic excitability during long-term depression is mediated through mGluR-dependent changes in I(h) in hippocampal CA1 pyramidal neurons. J Neurosci. 2007;27:13926–13937. doi: 10.1523/JNEUROSCI.3520-07.2007. [DOI] [PMC free article] [PubMed] [Google Scholar]
- Breton JD, Stuart GJ. Loss of sensory input increases the intrinsic excitability of layer 5 pyramidal neurons in rat barrel cortex. J Physiol. 2009;587:5107–5119. doi: 10.1113/jphysiol.2009.180943. [DOI] [PMC free article] [PubMed] [Google Scholar]
- Cerri C, Restani L, Caleo M. Callosal contribution to ocular dominance in rat primary visual cortex. Eur J Neurosci. 2010;32:1163–1169. doi: 10.1111/j.1460-9568.2010.07363.x. [DOI] [PubMed] [Google Scholar]
- Chen JL, Lin WC, Cha JW, So PT, Kubota Y, Nedivi E. Structural basis for the role of inhibition in facilitating adult brain plasticity. Nat Neurosci. 2011;14:587–594. doi: 10.1038/nn.2799. [DOI] [PMC free article] [PubMed] [Google Scholar]
- Cudmore RH, Turrigiano GG. Long-term potentiation of intrinsic excitability in LV visual cortical neurons. J Neurophysiol. 2004;92:341–348. doi: 10.1152/jn.01059.2003. [DOI] [PubMed] [Google Scholar]
- Desai NS, Rutherford LC, Turrigiano GG. Plasticity in the intrinsic excitability of cortical pyramidal neurons. Nat Neurosci. 1999;2:515–520. doi: 10.1038/9165. [DOI] [PubMed] [Google Scholar]
- Desai NS, Cudmore RH, Nelson SB, Turrigiano GG. Critical periods for experience-dependent synaptic scaling in visual cortex. Nat Neurosci. 2002;5:783–789. doi: 10.1038/nn878. [DOI] [PubMed] [Google Scholar]
- Fagiolini M, Pizzorusso T, Berardi N, Domenici L, Maffei L. Functional postnatal development of the rat primary visual cortex and the role of visual experience: dark rearing and monocular deprivation. Vision Res. 1994;34:709–720. doi: 10.1016/0042-6989(94)90210-0. [DOI] [PubMed] [Google Scholar]
- Feldman DE. Synaptic mechanisms for plasticity in neocortex. Annu Rev Neurosci. 2009;32:33–55. doi: 10.1146/annurev.neuro.051508.135516. [DOI] [PMC free article] [PubMed] [Google Scholar]
- Frenkel MY, Bear MF. How monocular deprivation shifts ocular dominance in visual cortex of young mice. Neuron. 2004;44:917–923. doi: 10.1016/j.neuron.2004.12.003. [DOI] [PubMed] [Google Scholar]
- Gordon JA, Stryker MP. Experience-dependent plasticity of binocular responses in the primary visual cortex of the mouse. J Neurosci. 1996;16:3274–3286. doi: 10.1523/JNEUROSCI.16-10-03274.1996. [DOI] [PMC free article] [PubMed] [Google Scholar]
- Hattox AM, Nelson SB. Layer V neurons in mouse cortex projecting to different targets have distinct physiological properties. J Neurophysiol. 2007;98:3330–3340. doi: 10.1152/jn.00397.2007. [DOI] [PubMed] [Google Scholar]
- Hensch TK. Critical period plasticity in local cortical circuits. Nat Rev Neurosci. 2005;6:877–888. doi: 10.1038/nrn1787. [DOI] [PubMed] [Google Scholar]
- Hubel DH, Wiesel TN. The period of susceptibility to the physiological effects of unilateral eye closure in kittens. J Physiol. 1970;206:419–436. doi: 10.1113/jphysiol.1970.sp009022. [DOI] [PMC free article] [PubMed] [Google Scholar]
- Hubel DH, Wiesel TN, LeVay S. Plasticity of ocular dominance columns in monkey striate cortex. Philos Trans R Soc Lond B Biol Sci. 1977;278:377–409. doi: 10.1098/rstb.1977.0050. [DOI] [PubMed] [Google Scholar]
- Kaneko M, Stellwagen D, Malenka RC, Stryker MP. Tumor necrosis factor-alpha mediates one component of competitive, experience-dependent plasticity in developing visual cortex. Neuron. 2008;58:673–680. doi: 10.1016/j.neuron.2008.04.023. [DOI] [PMC free article] [PubMed] [Google Scholar]
- Kotak VC, Fujisawa S, Lee FA, Karthikeyan O, Aoki C, Sanes DH. Hearing loss raises excitability in the auditory cortex. J Neurosci. 2005;25:3908–3918. doi: 10.1523/JNEUROSCI.5169-04.2005. [DOI] [PMC free article] [PubMed] [Google Scholar]
- LeVay S, Wiesel TN, Hubel DH. The development of ocular dominance columns in normal and visually deprived monkeys. J Comp Neurol. 1980;191:1–51. doi: 10.1002/cne.901910102. [DOI] [PubMed] [Google Scholar]
- Maffei A, Turrigiano GG. Multiple modes of network homeostasis in visual cortical layer 2/3. J Neurosci. 2008;28:4377–4384. doi: 10.1523/JNEUROSCI.5298-07.2008. [DOI] [PMC free article] [PubMed] [Google Scholar]
- Maffei A, Nelson SB, Turrigiano GG. Selective reconfiguration of layer 4 visual cortical circuitry by visual deprivation. Nat Neurosci. 2004;7:1353–1359. doi: 10.1038/nn1351. [DOI] [PubMed] [Google Scholar]
- Maffei A, Nataraj K, Nelson SB, Turrigiano GG. Potentiation of cortical inhibition by visual deprivation. Nature. 2006;443:81–84. doi: 10.1038/nature05079. [DOI] [PubMed] [Google Scholar]
- Maffei A, Lambo ME, Turrigiano GG. Critical period for inhibitory plasticity in rodent binocular V1. J Neurosci. 2010;30:3304–3309. doi: 10.1523/JNEUROSCI.5340-09.2010. [DOI] [PMC free article] [PubMed] [Google Scholar]
- Mataga N, Mizuguchi Y, Hensch TK. Experience-dependent pruning of dendritic spines in visual cortex by tissue plasminogen activator. Neuron. 2004;44:1031–1041. doi: 10.1016/j.neuron.2004.11.028. [DOI] [PubMed] [Google Scholar]
- McCoy P, Norton TT, McMahon LL. Layer 2/3 synapses in monocular and binocular regions of tree shrew visual cortex express mAChR-dependent long-term depression and long-term potentiation. J Neurophysiol. 2008;100:336–345. doi: 10.1152/jn.01134.2007. [DOI] [PMC free article] [PubMed] [Google Scholar]
- Mrsic-Flogel TD, Hofer SB, Ohki K, Reid RC, Bonhoeffer T, Hübener M. Homeostatic regulation of eye-specific responses in visual cortex during ocular dominance plasticity. Neuron. 2007;54:961–972. doi: 10.1016/j.neuron.2007.05.028. [DOI] [PubMed] [Google Scholar]
- Nataraj K, Le Roux N, Nahmani M, Lefort S, Turrigiano G. Visual deprivation suppresses L5 pyramidal neuron excitability by preventing the induction of intrinsic plasticity. Neuron. 2010;68:750–762. doi: 10.1016/j.neuron.2010.09.033. [DOI] [PMC free article] [PubMed] [Google Scholar]
- Nelson AB, Krispel CM, Sekirnjak C, du Lac S. Long-lasting increases in intrinsic excitability triggered by inhibition. Neuron. 2003;40:609–620. doi: 10.1016/s0896-6273(03)00641-x. [DOI] [PubMed] [Google Scholar]
- Nelson SB, Turrigiano GG. Strength through diversity. Neuron. 2008;60:477–482. doi: 10.1016/j.neuron.2008.10.020. [DOI] [PMC free article] [PubMed] [Google Scholar]
- Pratt KG, Aizenman CD. Homeostatic regulation of intrinsic excitability and synaptic transmission in a developing visual circuit. J Neurosci. 2007;27:8268–8277. doi: 10.1523/JNEUROSCI.1738-07.2007. [DOI] [PMC free article] [PubMed] [Google Scholar]
- Restani L, Cerri C, Pietrasanta M, Gianfranceschi L, Maffei L, Caleo M. Functional masking of deprived eye responses by callosal input during ocular dominance plasticity. Neuron. 2009;64:707–718. doi: 10.1016/j.neuron.2009.10.019. [DOI] [PubMed] [Google Scholar]
- Shatz CJ, Stryker MP. Ocular dominance in layer IV of the cat's visual cortex and the effects of monocular deprivation. J Physiol. 1978;281:267–283. doi: 10.1113/jphysiol.1978.sp012421. [DOI] [PMC free article] [PubMed] [Google Scholar]
- Smith GB, Heynen AJ, Bear MF. Bidirectional synaptic mechanisms of ocular dominance plasticity in visual cortex. Philos Trans R Soc Lond B Biol Sci. 2009;364:357–367. doi: 10.1098/rstb.2008.0198. [DOI] [PMC free article] [PubMed] [Google Scholar]
- Sourdet V, Russier M, Daoudal G, Ankri N, Debanne D. Long-term enhancement of neuronal excitability and temporal fidelity mediated by metabotropic glutamate receptor subtype 5. J Neurosci. 2003;23:10238–10248. doi: 10.1523/JNEUROSCI.23-32-10238.2003. [DOI] [PMC free article] [PubMed] [Google Scholar]
- Spolidoro M, Putignano E, Munafo C, Maffei L, Pizzorusso T. Inhibition of matrix metalloproteinases prevents the potentiation of nondeprived-eye responses after monocular deprivation in juvenile rats. Cereb Cortex. 2011 doi: 10.1093/cercor/bhr158. [DOI] [PubMed] [Google Scholar]
- Turrigiano GG, Nelson SB. Homeostatic plasticity in the developing nervous system. Nat Rev Neurosci. 2004;5:97–107. doi: 10.1038/nrn1327. [DOI] [PubMed] [Google Scholar]
- Wang BS, Sarnaik R, Cang J. Critical period plasticity matches binocular orientation preference in the visual cortex. Neuron. 2010;65:246–256. doi: 10.1016/j.neuron.2010.01.002. [DOI] [PMC free article] [PubMed] [Google Scholar]