

Abstract
Conflicting information regarding expression of GLUT3 protein in the human placenta has been reported and the localization and pattern of expression of GLUT3 protein across gestation has not been clearly defined. The objective of this study was characterization of syncytial GLUT3 protein expression across gestation. We hypothesized that GLUT3 protein is present in the syncytial microvillous membrane and that its expression decreases over gestation. GLUT3 protein was measured in samples from a range of gestational ages (first to third trimester), with human brain and human bowel used as a positive and negative control respectively. As an additional measure of specificity, we transfected BeWo choriocarcinoma cells, a trophoblast cell line expressing GLUT3, with siRNA directed against GLUT3 and analyzed expression by Western blotting. GLUT3 was detected in the syncytiotrophoblast at all gestational ages by immunohistochemistry. Using Western blotting GLUT3 was detected as an integral membrane protein at a molecular weight of ~50kDa in microvillous membranes from all trimesters but not in syncytial basal membranes. The identity of the primary antibody target was confirmed by demonstrating that expression of the immunoblotting signal in GLUT3 siRNA-treated BeWo was decreased to 18 ± 6% (mean ± SEM) of that seen in cells transfected with a non-targeting siRNA. GLUT3 expression in microvillous membranes detected by Western blot decreased through the trimesters such that expression in the second trimester (wks 14–26) was 48 ± 7% of that in the first trimester and by the third trimester (wks 31–40) only 34 ± 10% of first trimester expression. In addition, glucose uptake into BeWo cells treated with GLUT3 siRNA was reduced to 60% of that measured in cells treated with the non-targeting siRNA. This suggests that GLUT3-mediated uptake comprises approximately 50% of glucose uptake into BeWo cells. These results confirm the hypothesis that GLUT3 is present in the syncytial microvillous membrane early in gestation and decreases thereafter, supporting the idea that GLUT3 is of greater importance for glucose uptake early in gestation.
Keywords: glucose, transport, GLUT3, trophoblast, placenta, human
1. Introduction
Glucose is the primary substrate for fetal metabolism. In the absence of fetal gluconeogenesis [1], the maternal circulation is the only source of supply and thus the mechanisms for placental uptake and transfer of glucose are of major importance. Glucose is important not only for fetal metabolism but also for the placenta itself. The rate of placental glucose consumption obtained from in vivo measurements is ≥ 3-fold greater than the rate of fetal glucose consumption [2]. This is substantially higher than estimates for muscle, cardiac or whole body glucose consumption, demonstrating the extremely high rate of placental glucose metabolism. Thus one of the vital functions of the placenta is in ensuring that the glucose supply is adequate for both placenta and fetus.
Glucose transport across the syncytiotrophoblast, the transporting epithelial layer in the human placenta, occurs via sodium-independent facilitated diffusion down a concentration gradient through glucose transporters (the GLUT family). GLUT1 is expressed in a wide variety of human tissues including muscle, adipose, blood brain barrier and endothelium; its ubiquitous expression means that it has been assigned the role as the basic “housekeeping” glucose transporter. The GLUT1 transporter has very high expression and is regarded as the primary glucose transporter in human placenta [3–5]. Our prior studies revealed that the concentration of GLUT1 protein increases as gestation advances. These changes in expression are responsible, in part, for the significant increase in glucose uptake and consumption which parallels the increases in fetal growth in the third trimester [4]. GLUT1 is embedded in both the microvillous and basal membranes of the syncytiotrophoblast. The asymmetric arrangement of transporters between the two opposing faces of the syncytium (microvillous >> basal) means that the intrasyncytial concentration of glucose remains close to that of the intervillous blood [4, 6]. This maximizes the glucose gradient driving transport across the basal membrane, the rate limiting step in maternofetal transfer [7]. Intracellular glucose within the trophoblast or placenta does not seem to be compartmentalized between metabolic and transport pools since acute effects which alter cellular glucose consumption produce reductions in transepithelial or transplacental transport [7]. Alterations in placenta glucose transport have been implicated in adverse perinatal conditions such as intrauterine growth restriction (IUGR), fetal hypoxia and diabetes in pregnancy. In IUGR and fetal hypoxia, excess placental consumption of glucose may be responsible for a decreased rate of transport to the fetus [2, 8]. In conditions of chronic hypoxia, the expression of GLUT1 on the basal, rate-limiting face of the syncytium is decreased by ~40% [9]. Conversely, basal membrane GLUT1 is increased in women with pregestational and gestational diabetic pregnancies compared to controls [10].
Little is known of other glucose transporters in the syncytiotrophoblast. The presence of GLUT12 has been reported in first trimester syncytium but not at term [11]. GLUT9 has also been described in syncytial cells [12], however neither of these isoforms are thought to make significant contributions to maternofetal flux. Studies regarding GLUT 3 expression in human placenta have produced conflicting results. Initial studies performed by our laboratory were unable to demonstrate GLUT 3 protein in syncytiotrophoblast microvillous or basal membranes, a finding confirmed by other studies [13, 14]. Later studies showed that GLUT3 mRNA was present in syncytial and other cells of chorionic villous tissue [15, 16]. Studies have demonstrated the presence of GLUT3 protein in placental homogenates or mixed membrane preparations [13, 17] but this has been ascribed to GLUT3 present in fetal endothelial cells [14]. GLUT3 protein has, however, been reported in choriocarcinoma cells derived from first trimester placenta, such as JAR, JEG-3 and BeWo [18, 19].
Ogura et al examined the localization of GLUT1 and GLUT3 in human chorionic villi at 8 weeks gestation using confocal immunofluorescence microscopy [20]. They demonstrated that GLUT1 was localized to the plasma membrane of syncytiotrophoblast and cytotrophoblast but they found that GLUT3 was expressed also, primarily in the cytotrophoblast, with little staining in the syncytiotrophoblast, a finding later confirmed by Korgun et al [21]. In other studies GLUT3 was also reported to be present in cyto- and syncytiotrophoblast cells in first trimester tissues [22, 23], although neither study looked for GLUT3 protein expression later in gestation. In view of the apparent temporal differences in trophoblast GLUT3 expression we decided to clarify its expression in human placenta across gestation. Because of the conflicting results in earlier reports we made special efforts to ensure that the signals observed were due to the GLUT3 transporter protein.
We hypothesized that the GLUT 3 transporter protein is present in first trimester trophoblast, that expression decreases as gestation advances and is absent in term placenta. The basis for our hypothesis is rooted in the kinetic properties of GLUT 3, properties that would make it an ideal transporter in the first trimester. Compared to the other common isoforms, GLUT3 has a higher affinity for glucose compared to the ubiquitous GLUT1 [24], making it a key transporter for conditions where glucose concentrations are below those normally found in the circulation or for tissues where glucose is the primary metabolic substrate, such as the brain. Under conditions of either high glucose demand and/or hypoglycemia, the expression of GLUT 3 in the brain may be required to successfully utilize glucose where concentrations close to neurons are below levels in the circulation. The maternal circulation through the placenta must be established to provide nutrients to the growing fetus. In the early first trimester this circulation is limited as the trophoblast must first break into maternal vessels in the decidua before establishing intervillous blood flow [25]. The placenta must therefore draw substrate from the lacunae and limited circulatory pools present prior to the full development of the maternal circulation. An efficient glucose transporter such as GLUT3 could play a significant role in these circumstances, by ensuring that the placenta is able to take up the glucose from these limited sources, rendering it available for transport to the fetus.
2. Materials and Methods
2.1 Tissue and cells
This study was approved by the Institutional Review Board of the UMDNJ-New Jersey Medical School. Human first (8–13 weeks) and second (14–17 weeks) trimester placental samples were obtained from voluntary interruption of pregnancy by curettage. There were no known medical or obstetric complications at the time that the tissue was obtained. Term placental samples (39 weeks) were obtained from normal, uncomplicated pregnancies obtained at cesarean delivery. Adult liver, bowel, and heart sections for immunohistochemistry (IHC) were obtained as pathological discard samples. Archival samples were used for syncytial microvillous membranes from preterm, diabetic and chronic hypoxic placental tissue as well as post mortem adult brain specimens. All of these archival/pathological materials were utilized with IRB approval.
BeWo choriocarcinoma cells (b30 clone) were cultured in DMEM/F12/10% FBS and used in experiments to knock down GLUT3 using GLUT3 siRNA and in experiments measuring glucose uptake using [3H] 2-deoxy-D-glucose.
Syncytial microvillous and basal membranes were prepared by standard methods [9]. As a consequence of the small tissue volumes obtained following voluntary interruption of pregnancy only microvillous membranes were prepared were prepared from these samples. Placental tissue was homogenized in 250 mM sucrose, 10 mM Hepes/Tris, pH 7.4 containing a protease inhibitor mix (Sigma Chemical Company, S. Lois, MO). The homogenate was centrifuged at 10,000 × g for 15 min and the supernatant retained, brought to 12 mM MgCl2 and incubated on ice for 20 min. After incubation the mixture was centrifuged at 2,500 × g for 10 min, the supernatant removed and centrifuged at 75,000 × g for 30 min and the resultant pellet resuspended to produce the microvillous membrane fraction (MVM), which was frozen at −80°C until use. In the late second and third trimester samples the pellet from the magnesium precipitation step was resuspended and layered over a sucrose step gradient, centrifuged for 60 min at 100,000 × g and a basal membrane fraction was obtained from the material recovered at the interface between the two sucrose steps. This material was diluted and centrifuged at 75,000 × g for 30 min; the resultant pellet was resuspended to produce the basal membrane fraction which was frozen at −80°C.
2.2 Choice of antibody
The antibody used throughout these procedures was a polyclonal anti-rabbit IgG made against a peptide sequence from the C terminus of GLUT3. This antibody was selected because it was recommended by the manufacturer for both Western blotting and immunohistochemistry in formalin-fixed, paraffin-embedded tissue. Important also was knowledge of the antigen peptide amino acid sequence, since we wished to ensure specificity by blocking antibody binding using the antigenic peptide. A peptide with this sequence (SGKDGVMEMNSIEPAKETT) was synthesized by the NJMS Molecular Resource Facility. The manufacturer noted also that this antibody was tested by Western blotting in a cell type normally lacking GLUT3 which was subsequently transfected with human GLUT3 resulting in the appearance of a signal.
2.3 Immunohistochemistry
Tissue samples were fixed in buffered formalin for 24 hr then dehydrated through a series of graded ethanol concentrations to xylene, embedded in paraffin, cut into 5 μm sections and mounted onto slides. When ready for use, paraffin was removed in xylene and the tissue sections were rehydrated in a graded series of ethanol and placed in distilled H2O for 5 minutes. After rehydration, the following steps were done in a humidified chamber at room temperature. The slides were incubated for 20 minutes with Proteinase K (Dako USA, Carpinteria, CA) for antigen retrieval then washed in TBST (Tris-buffered saline containing 0.05% Tween-20) and blocked in goat serum (Vectastain Elite ABC Kit, Vector Laboratories, Burlingame, CA) for 1 hour. After washing with TBST, the slides were incubated with a polyclonal GLUT 3 primary antibody (rabbit IgG, affinity purified, 10 μg/ml; IBL-America Co., Minneapolis, MN) for 2 hours at room temperature. Specific staining of the antibody was verified by omission of the primary antibody. A more rigorous means of demonstrating specificity was also used. Antibody was pre-incubated for 30 min with a 20-fold excess of the peptide antigen used to generate the antibody (SGKDGVMEMNSIEPAKETT, synthesized by the NJMS Molecular Resource Facility) prior to staining the slides. Following incubation with primary antibody (in the presence or absence of peptide antigen), the sections were washed with TBST and incubated with biotinylated secondary anti rabbit antibody diluted in TBS (Vectastain Elite ABC Kit). Sections were washed again with TBST and secondary antibodies were detected using an ABC reagent for 30 minutes. To visualize the antigen-antibody complex, slides were incubated with Vector NovaRED substrate for 20 minutes (Vector Laboratories), washed, dehydrated and mounted.
2.4 Western Blotting
MVM from first, second and third trimester placentas as well as brain samples (20 μg membrane protein) were separated by SDS-PAGE using 10% gels and transferred to nitrocellulose membranes (Hybond ECL, GE Healthcare Life Sciences, Piscataway, NJ). After transfer, the membranes were rinsed with TBST and then blocked using StartingBlock buffer (Pierce Biotechnology, Rockford, IL) for 60 minutes. Blotting was performed by incubation of the membranes with a polyclonal anti GLUT3 antibody (IBL; 2 μg/ml in TBST) overnight at 4°C Specific staining of the antibodies was verified by omission of the primary antibody or by preincubation of the GLUT3 antibody with 20-fold excess of the peptide antigen. After incubation with the primary antibody, membranes were washed with TBST and incubated with the secondary antibody (anti-rabbit IgG-HRP or anti-mouse IgG-HRP; 1:20,000 in TBST; Sigma Chemical Co.) for 30 minutes. The membranes were washed again in TBST and the signal was visualized on film by chemiluminescence (SuperSignal West Femto, Pierce Biotechnology). Blots stained for GLUT3 were stripped using Restore Western Blot Stripping Buffer (Pierce Biotechnology), washed with TBST and reprobed using a monoclonal antibody against β-actin (clone AC15, Sigma Chemical Co.; 1:20,000 in TBST) for 2 hr at room temperature. Blot density was quantified using ImageJ (NIH, v1.34). Each gel contained three different pooled standards, which were used to normalize GLUT3 and β-actin measurements between gels. GLUT3 expression was then normalized to the expression of β-actin in the same sample.
2.5 GLUT3 siRNA
For determination of GLUT3 following siRNA treatment, BeWo cells were plated at ~50% confluence, washed with antibiotic-free, DMEM/F12 containing 0.5% BSA then incubated for 6 hr in the same medium containing 0.4 μl/ml of DharmaFect2 transfection reagent alone or complexed with 25 nM SMARTpool ON-TARGET plus siRNA directed against human GLUT3 or 25 nM siGENOME Non-Targeting Control siRNA #1 (Dharmacon, Thermo Scientific). After 6 hr, the transfection medium was replaced with standard growth medium (DMEM/F12/10% FBS) for a further 42 hr of incubation. After 48 hr, cells were extracted with RIPA buffer and utilized for Western blotting of GLUT3 as described above or utilized for measurements of glucose uptake.
2.6 Glucose uptake
Glucose uptake following treatment with GLUT3 siRNA or Non-Targeting Control siRNA was performed by measurement of the uptake of [3H] 2-deoxy-D-glucose ([3H] 2DG; Moravek Biochemicals). For determination of glucose uptake using [3H] 2DG following siRNA treatment (as described above), cells cultured in 12 well plates were washed and preincubated in DMEM/10% FBS containing 5.5 mM D-glucose for 6 hr before incubation in the same medium containing [3H] 2DG (1 μCi/mL). Following incubation, cells were washed twice with cold HBSS and extracted with RIPA buffer. Extracts were counted in a scintillation counter (Beckman LS6000IC). In addition to an untreated control, the Non-Targeting Control- and GLUT3 siRNA-treated cells, uptake was measured in another group of wells in which the cells were preincubated (15 min) in DMEM/5 mM D-glucose/10% FBS containing 10 μM cytochalasin B, an inhibitor of glucose uptake, which was also added to the medium in the uptake experiments. Before the uptake measurements relative cell number was assessed by measurements of cellular DNA using the DNA-intercalating dye Hoechst 33342 (2 μg/mL; Invitrogen) according to the manufacturer's instructions. These values were used to normalize the [3H] 2DG uptake measurements to account for differences in cell numbers between the wells.
2.7 Statistical analysis
Data are presented as mean ± SEM. Statistical analysis was performed using the Graphpad Instat software package (v3.0b). Data from the gestational age Western blotting experiments were measured by analysis of variance using the Tukey-Kramer multiple comparisons post hoc test. Data from the siRNA Western blotting experiments was measured using a paired t test. Glucose uptake data was analyzed by repeated measures analysis of variance with the Tukey-Kramer multiple comparisons post hoc test. A value of p < 0.05 was taken as significant. For the purposes of comparison data are presented graphically as percent of the appropriate control.
3. Results
3.1 Immunohistochemical controls
We observed widespread GLUT3 staining of human brain tissue sections, our positive control, as expected (Figure 1A, 1C), and when the primary antibody was pre-incubated with an excess of peptide antigen prior to blotting, no staining was obtained (Figure 1B, 1D), demonstrating both the positive control and specificity of the primary antibody. Strong GLUT1 staining of the brain sections was also observed (Figure 1E). We also stained sections of human bowel (known to be devoid of GLUT3) and heart (minimal expression) with GLUT3 and found little or no staining (Figure 1F, 1G), demonstrating the immunohistochemical negative controls.
Figure 1.

Immunohistochemical controls. Controls for GLUT3 immunohistochemical staining. GLUT3 staining of adult brain tissue with and without primary antibody at 40 × magnification (A, B) and 200 × magnification (C, D). GLUT1 staining of adult brain (E), GLUT3 staining of human bowel (F) and heart (G).
3.2 Placental GLUT3 immunohistochemical staining
In sections obtained from first trimester placenta (gestational weeks 8–12), GLUT 3 protein expression was detected throughout the syncytiotrophoblast (Figure 2A, 2B). In some areas it appeared that there was also staining of the underlying cytotrophoblast however the contiguous nature of syncytial and cytotrophoblastic staining makes clear distinction difficult. No endothelial staining was apparent. Second trimester placental villi (gestational weeks 14–18) showed a similar pattern of GLUT3 staining in the syncytium and cytotrophoblast (Figure 2C, 2D). GLUT3 staining of late second/early third trimester villi (gestational weeks 22–26) also revealed expression in the syncytiotrophoblast (Figure 2E, 2F). A cytotrophoblastic layer was not visualized clearly and the cytotrophoblastic staining of GLUT 3 could not be assessed; some endothelial staining was noted in these samples. At term, staining was syncytial with minimal staining of cytotrophoblast and no endothelial staining (Figure 2G, 2H). No staining was demonstrated in any of the control sections either as a result of omission of the primary antibody or following preincubation with the peptide antigen (Figure 2 I, J). Because of the difficulty in ascertaining the border between syncytiotrophoblast and cytotrophoblast, we elected to assess staining only in the syncytiotrophoblast through (blinded) visual observation by three observers. The results of the blinded assessment of immunohistochemical staining did not show significant differences in syncytial GLUT3 protein expression over gestation.
Figure 2.

GLUT3 staining of human placenta. GLUT3 syncytial staining is apparent in sections from placentae (40 ×, 200 × magnification) obtained at 10 weeks (A, B), 16 weeks (C, D), 26 weeks (E, F) and 40 weeks (G, H). GLUT3 staining in sections (40 × magnification) where the primary antibody was omitted (I) or where primary antibody was pre-incubated with an excess of peptide antigen (J).
3.3 Western blotting
Initial experiments showed that GLUT3 could be detected adequately by Western blotting using the polyclonal GLUT3 antibody at a concentration of 2 μg/ml. GLUT3 signals were normalized to β-actin expression, measured using a monoclonal antibody. GLUT3 was detected in microvillous membranes but not in basal membranes as shown in Figure 3A. Microvillous membrane extracts of first, second and third trimester placenta were subjected to Western blotting and the results demonstrated the presence of GLUT 3 protein in the full range of samples, from 8 to 39 weeks gestation (Figure 3B). No bands were apparent when membranes were incubated with primary antibody plus peptide antigen or with omission of the primary antibody. GLUT3 in placental samples was detected as multiple bands with two major bands at approximate molecular weights of 48 and 50 kDa, similar to the positive control brain samples. Treatment of microvillous membranes with 1 mM sodium carbonate as described previously [4] or 1% CHAPS did not alter the expression of GLUT3 (data not shown). GLUT3 expression was assessed in samples from different gestational ages, normalized to β-actin expression and grouped by trimester as shown in Figure 3C. GLUT3 expression (GLUT3/beta-actin) in the second trimester decreased to 48 ± 7% (n=8; p < 0.01) of the expression observed in the first trimester (n=8) and to 34 ± 10% in the third trimester (n=6; p < 0.01).
Figure 3.

Western blot measurements of GLUT3. (A) Example of a GLUT3 blot of microvillous and basal membranes isolated from term placenta. (B) Example of GLUT3 and the corresponding β-actin Western blots of microvillous membrane samples from a range of gestational ages. (C) GLUT3 protein expression, normalized to β-actin, for microvillous samples obtained from placentae collected during the first trimester (8–13 weeks, n=8), second trimester (14–26 weeks, n=8) and third trimester (31–40 weeks, n=6). The second and third trimester expression levels are significantly lower than the first trimester (p < 0.01, ANOVA).
3.4 GLUT siRNA
Experiments investigating the knockdown of GLUT3 were performed to provide further verification of the specificity of the GLUT3 antibody; if human GLUT3 siRNA was able to knock down the signal produced by the anti-GLUT3 antibody, this would provide additional verification that the antibody was binding to GLUT3. BeWo cells treated with GLUT3 siRNA or Non-Targeting Control siRNA #1 were assayed for expression of GLUT3 protein by Western blotting. The results from three separate experiments for the BeWo cells showed that expression in cells treated with the GLUT3 siRNA was 80% less than cells treated with the Non-Targeting Control siRNA (Figure 4). These results confirm that the signal detected by the anti-GLUT3 antibody used in the experiments described above are in fact detecting GLUT3, since the use of a pool of human GLUT3 siRNA causes a substantial reduction in the signal detected by this antibody.
Figure 4.

Effect of GLUT3 siRNA on BeWo GLUT3 protein expression. (A) Western blotting of BeWo cells for GLUT3 and ß-actin after treatment with Non-Targeting Control siRNA (NTC, lanes 1) or GLUT3 siRNA (GLUT3, lanes 2). (B) Expression of GLUT3 protein normalized to ß-actin for samples from Non-Targeting Control siRNA- and GLUT3 siRNA-treated BeWo cells, expressed as a percentage of the Non-Targeting Control siRNA-treated value(n=3, p < 0.05, paired t test).
3.5 Glucose uptake
A second purpose for the GLUT3 knockdown experiments was to provide a means of assessing the relative contribution of GLUT3 to cellular glucose uptake. Having shown that treatment of trophoblast cells with GLUT3 siRNA produces a major decrease in GLUT3 protein expression, we asked whether this change could be used to assess the relative importance of GLUT3 for cellular uptake of glucose. In these experiments we compared glucose uptake in BeWo cells treated with either GLUT3 siRNA or Non-Targeting Control siRNA. Glucose uptake measured by the uptake of [3H] 2DG, was expressed as a percentage of the uptake in Non-Targeting Control-treated cells. As shown in Figure 5, compared to Non-Targeting Control-treated cells (100 ± 16%; n=3), uptake in the cells treated with GLUT3 siRNA was 59 ± 3% (p < 0.05) and 29 ± 3% in Non-Targeting Control siRNA plus cytochalasin B-treated cells (p < 0.01).
Figure 5.
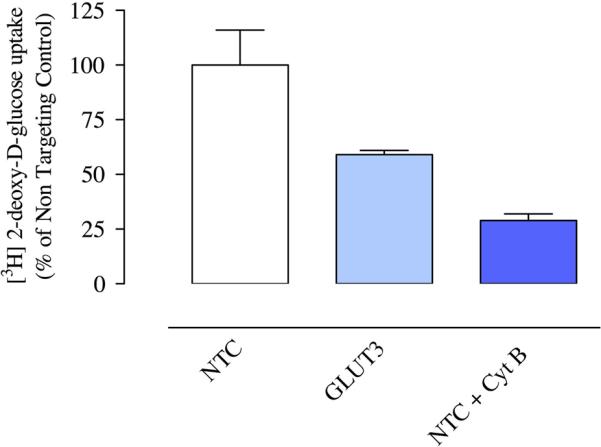
Effect of GLUT3 siRNA on glucose uptake in trophoblast cells. Measurements of [3H] 2-deoxy-D-glucose uptake into Non-Targeting Control-treated, GLUT3 siRNA-treated and Non-Targeting Control/cytochalasin B-treated (10 μM) BeWo cells, normalized to measurement of cell number and expressed as a percentage of uptake into the Non-Targeting Control-treated cells (n=3, ANOVA).
4. Discussion
Using immunohistochemistry and Western blotting, we are able to demonstrate that the GLUT3 protein is expressed in the human placenta from the first, second and third trimesters of pregnancy. The specificity of the GLUT3 antibody used in these studies was confirmed by peptide antigen blocking and by GLUT3 siRNA depletion. Immunohistochemical evidence localizes GLUT3 expression primarily to the syncytiotrophoblast although there is also expression in the cytotrophoblast and to some degree in the endothelium. Western blotting shows that GLUT3 is expressed in the microvillous but not basal membranes of the syncytium. Microvillous expression of GLUT3 decreases substantially in the second and third trimesters such that the level at term is only 34% of that observed in the first trimester. These findings are contradictory to previous reports describing the expression of human placental GLUT3, which described first trimester expression in cyto- but not syncytiotrophoblast cells and an absence of syncytial GLUT3 at term. Nevertheless we see a substantial decrease in microvillous membrane expression over gestation. Treatment of BeWo with GLUT3 siRNA reduced GLUT3 protein expression by > 80%. Glucose uptake measured subsequent to GLUT3 siRNA treatment showed that uptake of glucose by GLUT3 comprised a major fraction of total glucose uptake by BeWo cells, demonstrating that in this cells GLUT1 and GLUT3 both play significant roles in the uptake of glucose.
In light of the previous reports regarding the absence of GLUT3 protein expression in term human placenta, confirmation that our observations are specific for GLUT3 is very important. A number of different pieces of data allow us to conclude that the antibody used here is measuring GLUT3 expression. Omission of the primary anti-GLUT3 antibody eliminated staining in both the immunohistochemical and blotting experiments. Addition of an excess of the peptide antigen against which the antibody was generated also completely blocked staining. Western blotting experiments demonstrated a band at the expected molecular weight in both placental samples and in the human brain samples. GLUT3 staining was not eliminated by treatment of membranes with sodium carbonate or CHAPS, demonstrating that the signal is not due to a membrane associated protein such as actin, which was previously identified by certain GLUT3 antibodies [4, 17]. Immunohistochemical staining showed strong staining in brain tissue, a known positive control, while staining was absent in bowel, a tissue which lacks GLUT3 [13, 26, 27] and minimal in heart, which has very low levels of GLUT3 [13, 27]. We believe this data is strong confirmatory evidence that the antibody utilized in these experiments is specific for the GLUT3 glucose transporter. To further confirm these findings we examined the signal generated by this antibody following treatment of BeWo choriocarcinoma cells with a pooled set of four human GLUT3 siRNA. Our results demonstrate that the antibody used here detects a substantial decrease in the immunoblotting signal subsequent to GLUT3 siRNA treatment but not following treatment with a Non-Targeting Control siRNA. These data validate the identification of the signal detected by the anti-GLUT3 antibody as targeting human GLUT3 protein.
A significant methodological question is raised by these results. A series of previous reports from a number of different laboratories including our own did not find GLUT3 protein in the trophoblast of third trimester human placenta [4, 5, 14, 28], despite the presence of GLUT3 mRNA [15]. GLUT3 was described only in term endothelial cells [14] and in first trimester cyto- and syncytiotrophoblast [20, 29]. The obvious question is why we were able to detect syncytial GLUT3, especially at term, when previous studies have been unable to do so. It is important to note that while a number of studies have investigated placental GLUT3 protein expression, some have only examined expression in homogenate or mixed membrane samples, not allowing for determination of whether expression is syncytial [13, 17]. Others however have specifically looked for GLUT3 in cyto- or syncytiotrophoblast cells [4, 5, 14, 18, 29]. One interesting factor is that while the antibodies used for immunodetection of GLUT3 in these reports are all generated against C-terminal antigens, these antigens frequently appear to differ, ranging from 11 amino acids to 21 amino acid in length, although exact sequences are not always available [18, 29]. Those used in studies of cyto- or syncytiotrophoblast cells have primarily been generated using short (11–14 residue) antigenic peptides [4, 5, 14, 21, 30]. In many cases while specificity has been tested by either omission of the primary antibody or pre-adsorption with excess peptide antigen, few have comparisons with positive control tissues such as brain. It seems possible therefore that the differences observed between these studies may be related to the nature of the antibody used for detection. In this study we used a GLUT3 antibody generated using a 19-amino acid peptide, longer than most, and lacking the last three residues of the C-terminus, which prevents the immunoreactivity with actin shown by some antibodies [17]. The only other study using an antibody generated using a similar length and sequence, while detecting GLUT3 protein, did so in placental homogenates of uncertain gestational age [28]. Differences between studies in the immunohistochemical localization may be related not only to the type of antibody utilized but also to the nature of the antigen unmasking step. In those reports where paraffin-embedded tissues were analyzed, antigen unmasking was performed uniformly using non-enzymatic citrate treatment rather than the proteinase K treatment used here.
The results of the Western blotting experiments show a decrease in syncytial GLUT3 protein expression over gestation. The decrease is especially pronounced from the first to second trimesters, as measured by blot density. Similar results were observed by Ericsson et al [29] in that they observed GLUT3 staining in cyto- and syncytiotrophoblast in first trimester tissue but they concluded that there was little or no GLUT3 protein expression at term. First trimester cytotrophoblast staining has also been observed in the absence of syncytial GLUT3 staining [20, 22]. Clarson et al were unable to find GLUT3 staining in isolated term cytotrophoblast in culture [18]. Overall there appears to be consensus that GLUT3 is present in trophoblast cells from first trimester placental tissue however the gestational course of its expression is less clear. Given the results of our Western blotting experiments it is possible that while antibodies generated from the shorter antigens are capable of detecting the greater quantity of GLUT3 present in first trimester tissues, they lack the affinity necessary for detection of the reduced quantity of GLUT3 present in the third trimester.
There is a discrepancy in our data between the immunohistochemical staining results and those obtained by Western blotting. Our qualitative assessment of GLUT3 syncytial staining in the fixed sections did not appear show any differences between first, second and third trimesters. In contrast, the semiquantitative results obtained from Western blotting of microvillous membranes revealed a clear decrease in protein expression between the first and second/third trimester samples. A number of factors including the nature of immunohistochemical staining and the difficulty in distinguishing syncytio- and cytotrophoblast staining as well as the homogeneous samples and more quantitative assessment used in the Western blotting lead us to suggest that the latter technique provides a more reliable guide to the gestational course of GLUT3 syncytial expression.
Since its discovery in 1988, GLUT3 has been the subject of numerous studies regarding tissue expression and was originally designated the neuronal glucose transporter. GLUT3 has a higher affinity for glucose than GLUT1 and a turnover number substantially greater than GLUT1 [24, 31]. Given the unique properties of this transporter, it has been hypothesized that it would be well suited for conditions where glucose concentrations are low. For example, the glucose levels surrounding the neuron are only 1–2 mM compared to 5–6 mM glucose levels in serum, favoring the presence of an efficient (low Km) glucose transporter. As noted in the introduction, this also makes GLUT3 an appropriate placental transporter early in gestation. When the maternal circulation is not established and when low flow [25, 32] allows for depletion of glucose from the extracellular fluids bathing the placenta, the resultant concentrations will be well below those normally observed in the circulation. As pregnancy progresses and the maternal circulation is fully established, the placenta will be exposed to the higher glucose concentrations normally measured in plasma, obviating the need for a low Km transporter such as GLUT3. The presence of higher levels of GLUT3 early in gestation supports the idea that it may function as a “scavenger” isoform, suitable for operating in conditions of extracellular glucose lower than normal circulating levels. GLUT3 may therefore be an important component of fetal nutrient supply in early gestation.
The reduction in GLUT3 protein expression produced by GLUT3 siRNA enabled us to determine the extent to which GLUT3 contributes to the cellular uptake of glucose. We used [3H] 2-deoxy-D-glucose to measure uptake of glucose in siRNA-treated cells. A reduction of 81% in the expression of GLUT3 protein in BeWo cells decreased glucose uptake by 41%, thus we can calculate that GLUT3 contributes ~50% of the glucose uptake in these cells. This is a significant contribution to cellular glucose uptake and is consistent with the suggestion that early in gestation (BeWo cells are first trimester-derived) GLUT3 plays an important role in placental glucose transport.
In view of the preceding comments, it is of interest to note the available information on the regulation of GLUT3 expression. With the caveat that most information has been obtained through investigations of neuronal GLUT3, several points stand out. GLUT3 expression is up-regulated under hypoxic conditions [33–35], a finding which we have confirmed in BeWo choriocarcinoma cells [36]. The regulation of GLUT3 expression by extracellular glucose concentration is less clear however, with some reports demonstrating up-regulation by hypoglycemia [37, 38], while others suggest up-regulation under hyperglycemic conditions [34, 39]. Also of relevance to our observations are the findings that GLUT3 appears to be subject to upregulation by AMPK under low energy conditions [40]. It appears conceivable therefore that the stressors likely to be present in the placenta early in pregnancy, such as low PO2 and potentially lower extracellular glucose concentrations may be responsible for the elevated expression of syncytial GLUT3 observed in the first half of pregnancy. As pregnancy advances and the maternal circulation becomes capable of supplying sufficient oxygen and glucose to meet fetal and placental needs, the necessity for and expression of syncytial GLUT3 may therefore diminish.
Acknowledgements
The authors acknowledge funding obtained from the National Institutes of Health (NIH HD046982 to NPI).
Abbreviations
- GLUT3
glucose transporter 3
- RIPA
Radio-ImmunoPrecipitation Assay buffer
- 2-DG
2-deoxy-D-glucose
References
- 1.Marconi AM, Cetin I, Davoli E, Baggiani AM, Fanelli R, Fennessey PV, Battaglia FC, Pardi G. An evaluation of fetal glucogenesis in intrauterine growth-retarded pregnancies. Metabolism. 1993;42:860–4. doi: 10.1016/0026-0495(93)90060-2. [DOI] [PubMed] [Google Scholar]
- 2.Zamudio S, Torricos T, Fik E, Oyala M, Echalar L, Pullockaran J, Tutino E, Martin B, Belliappa S, Balanza E, Illsley NP. Hypoglycemia and the origin of hypoxia-induced reduction in human fetal growth. PLoS One. 2010;5:e8551. doi: 10.1371/journal.pone.0008551. [DOI] [PMC free article] [PubMed] [Google Scholar]
- 3.Hauguel-de Mouzon S, Leturque A, Alsat E, Loizeau M, Evain-Brion D, Girard J. Developmental expression of Glut1 glucose transporter and c-fos genes in human placental cells. Placenta. 1994;15:35–46. doi: 10.1016/s0143-4004(05)80234-6. [DOI] [PubMed] [Google Scholar]
- 4.Jansson T, Wennergren M, Illsley NP. Glucose transporter protein expression in human placenta throughout gestation and in intrauterine growth retardation. J Clin Endocrinol Metab. 1993;77:1554–62. doi: 10.1210/jcem.77.6.8263141. [DOI] [PubMed] [Google Scholar]
- 5.Barros LF, Yudilevich DL, Jarvis SM, Beaumont N, Baldwin SA. Quantitation and immunolocalization of glucose transporters in the human placenta. Placenta. 1995;16:623–633. doi: 10.1016/0143-4004(95)90031-4. [DOI] [PubMed] [Google Scholar]
- 6.Barta E, Drugan A. Glucose transport from mother to fetus--a theoretical study. J Theor Biol. 2010;263:295–302. doi: 10.1016/j.jtbi.2009.12.010. [DOI] [PubMed] [Google Scholar]
- 7.Vardhana P, Illsley N. Transepithelial glucose transport and metabolism in BeWo choriocarcinoma cells. Placenta. 2002;23:653–60. doi: 10.1053/plac.2002.0857. [DOI] [PubMed] [Google Scholar]
- 8.Challis DE, Pfarrer CD, Ritchie JW, Koren G, Adamson SL. Glucose metabolism is elevated and vascular resistance and maternofetal transfer is normal in perfused placental cotyledons from severely growth-restricted fetuses. Pediatr Res. 2000;47:309–15. doi: 10.1203/00006450-200003000-00005. [DOI] [PubMed] [Google Scholar]
- 9.Zamudio S, Baumann MU, Illsley NP. Effects of chronic hypoxia in vivo on the expression of human placental glucose transporters. Placenta. 2006;27:49–55. doi: 10.1016/j.placenta.2004.12.010. [DOI] [PMC free article] [PubMed] [Google Scholar]
- 10.Gaither K, Quraishi AN, Illsley NP. Diabetes alters the expression and activity of the human placental GLUT1 glucose transporter. J Clin Endocrinol Metab. 1999;84:695–701. doi: 10.1210/jcem.84.2.5438. [DOI] [PubMed] [Google Scholar]
- 11.Gude N, Stevenson J, Rogers S, Best J, Kalionis B, Huisman M, Erwich J, Timmer A, King R. GLUT12 expression in human placenta in first trimester and term. Placenta. 2003;24:566–570. doi: 10.1053/plac.2002.0925. [DOI] [PubMed] [Google Scholar]
- 12.Bibee K, Illsley NP, Moley KH. Asymmetric syncytial expression of GLUT9 splice variants in human term placenta and alterations in diabetic pregnancies. Reprod. Sci. 2011;18:20–27. doi: 10.1177/1933719110380276. [DOI] [PMC free article] [PubMed] [Google Scholar]
- 13.Haber RS, Weinstein SP, O'Boyle E, Morgello S. Tissue distribution of the human GLUT3 glucose transporter. Endocr. 1993;132:2538–2543. doi: 10.1210/endo.132.6.8504756. [DOI] [PubMed] [Google Scholar]
- 14.Hauguel-De Mouzon S, Challier J, Kacemi A, Caüzac M, Malek A, Girard J. The GLUT3 glucose transporter isoform is differentially expressed within human placental cell types. J. Clin. Endocr. Metab. 1997;82:2689–2694. doi: 10.1210/jcem.82.8.4147. [DOI] [PubMed] [Google Scholar]
- 15.Jansson T, Cowley EA, Illsley NP. Cellular localization of glucose transporter messenger RNA in human placenta. Reprod Fertil Dev. 1995;7:1425–30. doi: 10.1071/rd9951425. [DOI] [PubMed] [Google Scholar]
- 16.Esterman A, Greco MA, Mitani Y, Finlay TH, Ismail-Beigi F, Dancis J. The effect of hypoxia on human trophoblast in culture: morphology, glucose transport and metabolism. Placenta. 1997;18:129–36. doi: 10.1016/s0143-4004(97)90084-9. [DOI] [PubMed] [Google Scholar]
- 17.Shepard PR, Gould GW, Colville CA, McCoid SC, Gibbs EM, Kahn BB. Distribution of GLUT3 glucose transporter in human tissues. Biochem. Biophys. Res. Commun. 1992;188:149–154. doi: 10.1016/0006-291x(92)92362-2. [DOI] [PubMed] [Google Scholar]
- 18.Clarson LH, Glazier JD, Sides MK, Sibley CP. Expression of the facilitated glucose transporters (GLUT1 and GLUT3) by a choriocarcinoma cell line (JAr) and cytotrophoblast cells in culture. Placenta. 1997;18:333–340. doi: 10.1016/s0143-4004(97)80068-9. [DOI] [PubMed] [Google Scholar]
- 19.Illsley NP, Sellers MC, Wright RL. Glycaemic regulation of glucose transporter expression and activity in the human placenta. Placenta. 1998;19:517–24. doi: 10.1016/s0143-4004(98)91045-1. [DOI] [PubMed] [Google Scholar]
- 20.Ogura K, Sakata M, Okamoto Y, Yasui Y, Tadokoro C, Yoshimoto Y, Yamaguchi M, Kurachi H, Maeda T, Murata Y. 8-bromo-cyclicAMP stimulates glucose transporter-1 expression in a human choriocarcinoma cell line. Journal of Endocrinology. 2000;164:171–8. doi: 10.1677/joe.0.1640171. [DOI] [PubMed] [Google Scholar]
- 21.Korgun ET, Celik-Ozenci C, Seval Y, Desoye G, Demir R. Do glucose transporters have other roles in addition to placental glucose transport during early pregnancy? Histochem Cell Biol. 2005;123:621–9. doi: 10.1007/s00418-005-0792-3. [DOI] [PubMed] [Google Scholar]
- 22.Hahn D, Blaschitz A, Korgun ET, Lang I, Desoye G, Skofitsch G, Dohr G. From maternal glucose to fetal glycogen: expression of key regulators in the human placenta. Molecular Human Reproduction. 2001;7:1173–8. doi: 10.1093/molehr/7.12.1173. [DOI] [PubMed] [Google Scholar]
- 23.Ericsson A, Hamark B, Powell TL, Jansson T. Glucose transporter isoform 493 4 is expressed in the syncytiotrophoblast of first trimester human placenta. Hum Reprod. 2005;20:521–30. doi: 10.1093/humrep/deh596. [DOI] [PubMed] [Google Scholar]
- 24.Maher F, Davies-Hill T, Simpson I. Substrate specificity and kinetic parameters of GLUT3 in rat cerebellar granule neurons. Biochem. J. 1996;315:827–831. doi: 10.1042/bj3150827. [DOI] [PMC free article] [PubMed] [Google Scholar]
- 25.Burton GJ, Hempstock J, Jauniaux E. Nutrition of the human fetus during the first trimester--a review. Placenta. 2001;22(Suppl A):S70–7. doi: 10.1053/plac.2001.0639. [DOI] [PubMed] [Google Scholar]
- 26.Mantych GJ, James DE, Chung HD, Devaskar SU. Cellular localization and characterization of Glut 3 glucose transporter isoform in human brain. Endocrinology. 1992;131:1270–8. doi: 10.1210/endo.131.3.1505464. [DOI] [PubMed] [Google Scholar]
- 27.Younes M, Lechago LV, Somoano JR, Mosharaf M, Lechago J. Immunohistochemical detection of Glut3 in human tumors and normal tissues. Anticancer Res. 1997;17:2747–50. [PubMed] [Google Scholar]
- 28.Maher F, Vannucci S, Takeda J, Simpson IA. Expression of mouse-GLUT3 and human-GLUT3 glucose transporter proteins in brain. Biochem. Biophys. Res. Commun. 1992;182:703–711. doi: 10.1016/0006-291x(92)91789-s. [DOI] [PubMed] [Google Scholar]
- 29.Ericsson A, Hamark B, Powell TL, Jansson T. Glucose transporter isoform 4 is expressed in the syncytiotrophoblast of first trimester human placenta. Human Reproduction. 2005;20:521–30. doi: 10.1093/humrep/deh596. [DOI] [PubMed] [Google Scholar]
- 30.Hahn T, Barth S, Graf R, Engelman M, Beslagic D, Reul J, F H, Dohr G, Desoye G. Placental glucose transporter expression is regulated by glucocorticoids. J. Clin. Endocr. Metab. 1999;84:1445–1452. doi: 10.1210/jcem.84.4.5607. [DOI] [PubMed] [Google Scholar]
- 31.Asano T, Katagiri H, Takata K, Tsukuda K, Lin JL, Ishihara H, Inukai K, Hirano H, Yazaki Y, Oka Y. Characterization of GLUT3 protein expressed in Chinese hamster ovary cells. Biochem J. 1992;288(Pt 1):189–93. doi: 10.1042/bj2880189. [DOI] [PMC free article] [PubMed] [Google Scholar]
- 32.Jaffe R, Jauniaux E, Hustin J. Maternal circulation in the first trimester human placenta - myth or reality? Am J Obstet Gynecol. 1997;176:695–699. doi: 10.1016/s0002-9378(97)70572-6. [DOI] [PubMed] [Google Scholar]
- 33.Bruckner BA, Ammini CV, Otal MP, Raizada MK, Stacpoole PW. Regulation of brain glucose transporters by glucose and oxygen deprivation. Metabolism: Clinical & Experimental. 1999;48:422–31. doi: 10.1016/s0026-0495(99)90098-7. [DOI] [PubMed] [Google Scholar]
- 34.Maurer MH, Geomor HK, Burgers HF, Schelshorn DW, Kuschinsky W. Adult neural stem cells express glucose transporters GLUT1 and GLUT3 and regulate GLUT3 expression. FEBS Letters. 2006;580:4430–4. doi: 10.1016/j.febslet.2006.07.012. [DOI] [PubMed] [Google Scholar]
- 35.O'Rourke JF, Pugh CW, Bartlett SM, Ratcliffe PJ. Identification of hypoxically inducible mRNAs in HeLa cells using differential-display PCR. Role of hypoxia-inducible factor-1. European Journal of Biochemistry. 1996;241:403–10. doi: 10.1111/j.1432-1033.1996.00403.x. [DOI] [PubMed] [Google Scholar]
- 36.Baumann M, Zamudio S, Illsley N. Hypoxic upregulation of glucose transporters in BeWo choriocarcinoma cells is mediated by hypoxia-inducible factor-1 (HIF-1) Am J Physiol. 2007;293:C477–485. doi: 10.1152/ajpcell.00075.2007. [DOI] [PMC free article] [PubMed] [Google Scholar]
- 37.Antony S, Peeyush Kumar T, Mathew J, Anju TR, Paulose CS. Hypoglycemia induced changes in cholinergic receptor expression in the cerebellum of diabetic rats. Journal of Biomedical Science. 2010;17:7. doi: 10.1186/1423-0127-17-7. [DOI] [PMC free article] [PubMed] [Google Scholar]
- 38.Nagamatsu S, Sawa H, Inoue N, Nakamichi Y, Takeshima H, Hoshino T. Gene expression of GLUT3 glucose transporter regulated by glucose in vivo in mouse brain and in vitro in neuronal cell cultures from rat embryos. Biochemical Journal. 1994;300:125–31. doi: 10.1042/bj3000125. [DOI] [PMC free article] [PubMed] [Google Scholar]
- 39.Reagan LP, Magarinos AM, Lucas LR, van Bueren A, McCall AL, McEwen BS. Regulation of GLUT-3 glucose transporter in the hippocampus of diabetic rats subjected to stress. American Journal of Physiology. 1999;276:E879–86. doi: 10.1152/ajpendo.1999.276.5.E879. [DOI] [PubMed] [Google Scholar]
- 40.Weisova P, Concannon CG, Devocelle M, Prehn JHM, Ward MW. Regulation of glucose transporter 3 surface expression by the AMP-activated protein kinase mediates tolerance to glutamate excitation in neurons. Journal of Neuroscience. 2009;29:2997–3008. doi: 10.1523/JNEUROSCI.0354-09.2009. [DOI] [PMC free article] [PubMed] [Google Scholar]