Abstract
For effective disease surveillance, rapid and sensitive assays are needed to detect antibodies developed in response to porcine reproductive and respiratory syndrome virus (PRRSV) infection. In this study, we developed a multiplexed fluorescent microsphere immunoassay (FMIA) for detection of PRRSV-specific antibodies in oral fluid and serum samples. Recombinant nucleocapsid protein (N) and nonstructural protein 7 (nsp7) from both PRRSV genotypes (type I and type II) were used as antigens and covalently coupled to Luminex fluorescent microspheres. Based on an evaluation of 488 oral fluid samples with known serostatus, the oral fluid-based FMIAs achieved >92% sensitivity and 91% specificity. For serum samples (n = 1,639), the FMIAs reached >98% sensitivity and 95% specificity. The assay was further employed to investigate the kinetics of the antibody response in infected pigs. In oral fluid, the N protein was more sensitive for the detection of early infection (7 and 14 days postinfection), but nsp7 detected a higher level and longer duration of antibody response (28 days postinfection). In serum, the antibodies specific to nsp7 and N proteins were detected as early as 7 days postinfection, and the responses lasted more than 202 days. This study provides a framework from which a more robust assay could be developed to profile the immune response to multiple PRRSV antigens in a single test. The development of oral fluid-based diagnostic tests will change the way we survey diseases in swine herds and improve our ability to cheaply and efficiently track PRRSV infections in both populations and individual animals.
INTRODUCTION
Porcine reproductive and respiratory syndrome (PRRS) is the most economically devastating disease in the swine industry. One of the key approaches to achieving PRRS elimination is to identify PRRS virus (PRRSV)-infected pigs so that such pigs can be quarantined, isolated, or removed from herds to block or reduce the transmission of infection to susceptible animals. Serum is a standard antemortem sample that is routinely collected for diagnostic evaluation to determine whether pigs have been exposed to PRRSV. However, blood collection is a labor-intensive procedure and may cause stress to the animal. Previous studies evaluated the use of oral fluid sampling as an efficient, cost-effective approach to PRRSV surveillance in swine populations (11, 12). Oral fluid is a complex mixture of saliva and gingival crevicular fluid. Gingival crevicular fluid is an oral mucosal transudate derived from the passive transport of serum components through the oral mucosa into the gingival crevices of the mouth. It more closely resembles serum than salivary gland secretions. The use of oral fluid samples as an inexpensive, safe, noninvasive alternative to blood in determining acute infection and prevalence of immunity has become well established for various human pathogens, such as human immunodeficiency virus (HIV), hepatitis A and B viruses, and rubella virus (2, 3, 5, 10). Oral fluid has been used in epidemiological studies of HIV infection in developing countries and potentially has a role in epidemiological studies of other human infectious agents (5, 9). The presence of PRRSV in oral fluids was first reported in 1997, when the virus was isolated from buccal swabs collected from experimentally inoculated young pigs at 7, 14, 21, 28, 35, and 42 days postinoculation (13). A recent study by Prickett et al. (11) reported that PRRSV in oral fluid was detected by real-time quantitative reverse transcription-PCR (qRT-PCR) for approximately 4 weeks postinoculation. Certain levels of anti-PRRSV antibody were detected in oral fluid samples by use of the commercially available IDEXX HerdChek PRRS enzyme-linked immunosorbent assay (ELISA) and indirect immunofluorescent-antibody (IFA) tests. These reports suggested that porcine oral fluid samples could be used for diagnostic monitoring of PRRSV infection.
The use of traditional immunoassays to detect host antibodies in oral fluid is less sensitive than using sera due to the lower concentration of host antibodies present in oral fluid. In this study, we used a fluorescent microsphere immunoassay (FMIA) to detect anti-PRRSV antibodies in oral fluid specimens. The FMIA uses multiple fluorescent microspheres (up to 100 color-coded bead sets), and each bead set is conjugated to different antigens or antibodies as the solid phase for the detection of antibodies or antigens in biological samples. An advantage of this technology is that FMIA allows uniform detection of multiple antigens or antibodies simultaneously within a small volume of a single sample. Therefore, the assay is less labor-intensive and requires smaller amounts of samples.
Traditional antibody detection assays, such as the IDEXX HerdChek PRRS ELISA, are based on the PRRSV nucleocapsid (N) protein as the antigen. Our previous study showed that certain nonstructural proteins, nsp1, nsp2, and nsp7, are also highly immunogenic (1). Serum antibodies specific to these proteins can be detected as early as 14 days postinfection (dpi) and last more than 202 dpi. Recently, we developed an nsp7-based ELISA for detecting PRRSV antibodies in serum samples (1). In this study, we adapted the N protein- and nsp7-based ELISAs into a multiplex FMIA format for the diagnosis of PRRSV infection in oral fluid. For comparison, FMIAs using serum samples were also developed. These new FMIAs for the detection of antibody against PRRSV represent the first step in the development of a broad range of multiplex assays for swine disease diagnostics. Future expansion of these assays would allow for the rapid detection of various antigens and antibodies associated with major swine pathogens in a single sample.
MATERIALS AND METHODS
Viruses and cells.
MARC-145 cells were cultured in minimal Eagle's medium (MEM; Gibco BRL Life Technologies) with 10% fetal bovine serum (FBS) and antibiotics (100 units/ml penicillin and 20 μg/ml streptomycin). Cells were maintained at 37°C in a humidified 5% CO2 incubator. PRRSV strains SD01-08 (type I) and VR2332 (type II) were propagated on MARC-145 cells by using a previously described method (6).
Expression of recombinant nsp7 and N proteins.
DNA fragments corresponding to NA-nsp7 and NA-N from type II PRRSV strain VR2332 and to EU-nsp7 and EU-N from type I PRRSV strain SD01-08 were amplified by RT-PCR and cloned into a pET protein expression vector (Novagen). Primers used for amplification of the NA-nsp7 or EU-nsp7 region were described previously (1). For recombinant N protein expression, primers VR2332-NF (5′-CGCGGATCCATGCCAAATAACAACGGC) and VR2332-NR (5′-CACCTCGAGTCATGCTGAGGGTGATG) were used for RT-PCR amplification from VR2332, and primers SD01-08-NF (5′-CGCGGATCCATGGCCGGTAAAAATCAGAG) and SD01-08-NR (5′-CACCTCGAGTTAATTTGCACCCTGACTG) were used for RT-PCR amplification from SD01-08. Recombinant proteins were expressed as His-tagged fusion proteins and purified as we described previously (1, 4). Purified fusion proteins were analyzed by sodium dodecyl sulfate-polyacrylamide gel electrophoresis (SDS-PAGE) to determine their purity. Western blotting was performed to confirm the specificity of the proteins, using an anti-His antibody (Novagen, Madison, WI).
Oral fluid and serum samples. (i) Samples for establishing standards and diagnostic test validation.
Four sets of oral fluid and serum samples were used. They were obtained from experimentally infected pigs following sample collection procedures described elsewhere (7, 11, 12). The first set of samples (sample set A) was paired oral fluid and serum samples from individual boars (7). A total of 70 boars ranging from 5 months to 4 years in age were inoculated intramuscularly with 2 ml (1 × 10⁵ 50% tissue culture infective doses [TCID50]/ml) of RespPRRS modified live vaccine (group 1; n = 24), type I (strain D09-012131) PRRSV (group 2; n = 22), or type II (strain MN-184; GenBank accession no. AY656992) PRRSV (group 3; n = 24). Paired oral fluid and serum samples were collected from all 70 boars at −7, −6, −5, −4, −3, −2, −1, 0, 7, 14, and 21 days postinfection (dpi). The second set of samples (sample set B) was oral fluid and serum samples collected from 30 pigs. Pigs were 6 weeks old at the time of inoculation and were divided into three groups (n = 10). Group 1 pigs were inoculated intramuscularly with type I PRRSV strain SD01-08 (2 ml at 1 × 10⁶ TCID50/ml), group 2 pigs were inoculated intramuscularly with type II PRRSV strain VR2332 (2 ml at 1 × 10⁵ TCID50/ml), and group 3 pigs were mock infected. Serum and oral fluids were collected once a week at regular intervals for 49 days. Serum samples were collected from individual pigs, and oral fluid samples were collected from each pen (n = 10). The third set of samples (sample set C) was serum samples obtained from 109 pigs experimentally infected with VR2332. Sera were collected at 7-day intervals for the first 2 weeks and then at 14-day intervals for up to 202 dpi. In addition, a panel of serum samples (sample set D) was obtained from 32 pigs that were experimentally inoculated with one of four different type I PRRSV isolates: SD01-07, SD01-08, SD02-11, or SD03-15 (1). The sera were collected at 7-day intervals for up to 85 days postinoculation.
(ii) Samples for time course study of antibody response.
A panel of oral fluid samples (sample set E) was obtained from 1,100 pigs that were vaccinated with the RespPRRS modified live vaccine. Oral fluid was collected at −1, 10, 14, 21, 28, 35, 42, 49, and 56 days postvaccination. Samples for each day postvaccination were collected from individual pens and pooled. To study the kinetics of the antibody response in serum, serum samples from sample set C were used.
(iii) Samples for application of FMIA to field samples.
A total of 772 field serum samples (sample set F) were obtained from the South Dakota Animal Disease Diagnostic Laboratory. Positive test samples (n = 383) were used only for submitted cases having a herd history of PRRSV-positive status and for which the IDEXX ELISA and IFA results of the entire case were shown to be positive. This set of samples represents a wide range of sample value/positive value (S/P) ratios for IDEXX ELISA results, including 143 samples with S/P ratios of >1.9, 200 samples with S/P ratios of 1.0 to 1.8, and 40 samples with S/P ratios of 0.4 to 1.0. The negative test samples (n = 389) were from cases having a herd history of PRRSV-negative status and for which the IDEXX ELISA and IFA results were verified to be negative for the entire case.
Establishment of test standards.
For ELISA and FMIA standards, separate lots of internal quality control oral fluid or serum samples, generated from sample sets A to D, were established. The values for ELISA standards were established as “high positive” (optical density [OD] of ∼1.9 to 2.1), “low positive” (OD of ∼0.6 to 0.7), or negative (OD of <0.2). The optimal dilution of recombinant protein was determined such that the control sample generated an OD at the established standard. For FMIA standards, the high-positive serological standard was established for mean fluorescence intensities (MFI) of 25,000 to 30,000, and the low-positive serological standard was established for MFI of 10,000 to 15,000. Negative-control standards were collected from uninfected animals and used to establish a baseline (MFI of 300 to 1,000) which had at least a 10 times lower MFI for optimum discrimination between positive and negative samples.
Antibody detection ELISAs.
IDEXX ELISA (HerdChek PRRS X3) was performed following the manufacturer's instructions (IDEXX Laboratories). This assay is routinely conducted at the South Dakota Animal Disease Research and Diagnostic Laboratory, under strict quality control guidelines. Results were quantified by reading plates at 650 nm with an EL800 microplate reader (BioTek Instruments Inc., Winooski, VT) controlled by XChek Software (IDEXX Laboratories). The raw plate data were copied to an Excel spreadsheet to calculate the S/P ratios, using the following formula: S/P = (OD of sample − OD of buffer)/(OD of positive control − OD of buffer).
Covalent coupling of recombinant nsp7 and N proteins to fluorescent microspheres.
Fluorescent microsphere coupling was performed using a previously described method (8). Briefly, 3.125 × 10⁶ microspheres were washed twice with 250 μl activation buffer (0.1 M NaH2PO4, pH 6.2) and sonicated for 60 s after each wash. Microspheres were activated for 20 min at room temperature in 500 μl activation buffer containing 2.5 mg N-hydroxysulfosuccinimide (sulfo-NHS) and 2.5 mg N-(3-dimethylaminopropyl)-N-ethylcarbodiimide (EDC) (Pierce Chemical, Rockford, IL). Activated microspheres were washed twice with phosphate-buffered saline (PBS) and sonicated after each wash. Coupling was initiated by the addition of 250 μg of each of the four purified recombinant proteins (EU-nsp7, NA-nsp7, EU-N, and NA-N) to a final volume of 500 μl PBS, and samples were incubated in the dark for 3 h at room temperature. Coupled microspheres were washed once with 1 ml of PBS plus 0.05% NaN3 plus 1.0% bovine serum albumin (PBS-NB) and blocked with an additional 1 ml of PBS-NB for 30 min to reduce nonspecific binding. Microspheres were then washed twice and resuspended in PBS-NB to a final concentration of 2.0 × 10⁶ antigen-coupled microspheres/ml.
The amount of recombinant protein coupled to a microsphere was optimized by performing multiple coupling reactions with various concentrations of antigen (starting with 500 μg). The amount of antigen was titrated against a fixed number of microspheres (3.125 × 10⁶) and then tested to generate a maximal signal-to-noise ratio of MFI using standard oral fluid or serum.
To determine the coupling efficiency, 2.5 × 10³ antigen-coupled microspheres were added to each column well of a 96-well microtiter filter plate that was prewetted with 20 μl of PBS-NB. A solution of PBS-NB containing 1.0 mg/ml of each monoclonal antibody (MAb) (anti-EU-nsp7, anti-NA-nsp7, anti-EU nucleocapsid, and anti-NA nucleocapsid) was serially titrated with 10-fold dilutions. Fifty microliters of serially diluted antigen-specific MAb was added to corresponding wells containing coupled microspheres and allowed to incubate at room temperature for 1 h on a plate shaker. After washing of the microspheres with PBST (PBS plus 0.05% Tween 20) three times, 50 μl of goat anti-mouse IgG conjugated to streptavidin–R-phycoerythrin (SAPE) (10 μg/ml in PBS-NB; Invitrogen) was added to the antigen-antibody-microsphere mixture and incubated for 30 min at room temperature. Microspheres were washed with PBST three times and resuspended in 125 μl of PBST. The microspheres were then transferred to a 96-well polystyrene optical plate. Uncoupled microspheres were included as a negative control. Microspheres were analyzed through a dual-laser Bio-Rad Bio-Plex 200 instrument. Data were analyzed with Bio-Plex Manager software (version 6.0). The mean fluorescence intensity for 100 microspheres was recorded at each titration point, and a logarithmic regression curve was generated. Relative coupling efficiencies for each antigen-coated microsphere were determined by analyzing the MFI at each dilution point and position under the linear portion of the curve.
FMIA.
A 96-well hydrophilic membrane filter plate was blocked for 2 min with 150 μl of PBS-NB and then aspirated via a vacuum manifold and wetted with an additional 20 μl of PBS-NB buffer. Fifty microliters of serum or oral fluid sample (diluted 1:50 or 1:3, respectively, in PBS-NB) was added to duplicate filter plate wells, along with 50 μl of PBS-NB containing 2.5 × 10³ (each type) antigen-coupled microspheres (1.0 × 10⁴ microspheres in total per well for the 4-plex assay). Since the microspheres and reporter moiety are light sensitive, all incubations were performed in the dark by sealing the plate with foil. For the serum FMIA, the plate was incubated at room temperature for 1 h on a plate shaker rotating at 600 rpm. For the oral fluid FMIA, the plate was incubated at 4°C overnight. The plate was washed three times with 150 μl of PBST. For the serum FMIA, 50 μl of biotinylated IgG (1:5,000 dilution in PBS-NB; Jackson ImmunoResearch Laboratories) was added to the filter plate and incubated at room temperature for 1 h. The oral fluid FMIA was treated the same as the serum FMIA, except that biotinylated IgA and IgM (1:5,000 dilution in PBS-NB; Bethyl Laboratories) were added along with biotinylated IgG as secondary antibodies. After incubation with the secondary antibodies, 50 μl of SAPE (2.5 μg/ml in PBS-NB) was added to each well and incubated for 30 min at room temperature with shaking. The supernatant was aspirated, and the plate was washed three times with PBST. Finally, the microspheres were resuspended in 125 μl of PBST per well and transferred to a clear 96-well polystyrene optical plate. Coupled microspheres were analyzed through a dual-laser Bio-Rad Bio-Plex 200 instrument. The MFI for 100 microspheres corresponding to each individual bead analyte was recorded for each well. All reported MFI measurements were normalized via F − F0, where F0 was the background signal determined from the fluorescence measurement of a test sample in uncoated beads and F was the MFI for a serological test sample in antigen-coated beads.
Assay validation. (i) Cutoff determination and diagnostic sensitivity and specificity.
To accurately assess the diagnostic sensitivity and specificity of the assays, the assays were validated using samples from two distinct animal populations. The negative-testing (noninfected) validation population was composed of 385 negative oral fluid and 368 negative serum samples. The positive-testing (infected) validation population was composed of 103 positive oral fluid and 892 positive serum samples. Receiver operating characteristic (ROC) analysis was conducted for each assay to determine assay cutoffs and diagnostic performance, using MedCalc, version 10.4.0.0 (MedCalc Software, Mariakerke, Belgium).
(ii) Measurement of repeatability.
The repeatability of each FMIA was assessed by running the same lot of internal quality control standards for oral fluid or serum multiple times on different plates. For both nsp7 and nucleocapsid assays, the intra-assay repeatability was calculated for 36 replicates on a single plate and then repeated over a 3-day period for interassay repeatability assessment. Each assay was run in a 4-plex format, and mean fluorescence intensity values are expressed as means, standard deviations, and percent coefficients of variation (%CV) for repeated measurements. %CV was calculated using a method described earlier (1, 4).
Statistical analysis.
The comparison of means and determination of %CV between groups were performed using GraphPad InStat, version 3.06 (GraphPad Software, San Diego, CA). In addition, Pearson's correlation coefficient was calculated using the same software for the determination of relative coupling efficiencies and for the comparison of singleplex versus multiplex assays.
RESULTS
Expression of recombinant nsp7 and N proteins.
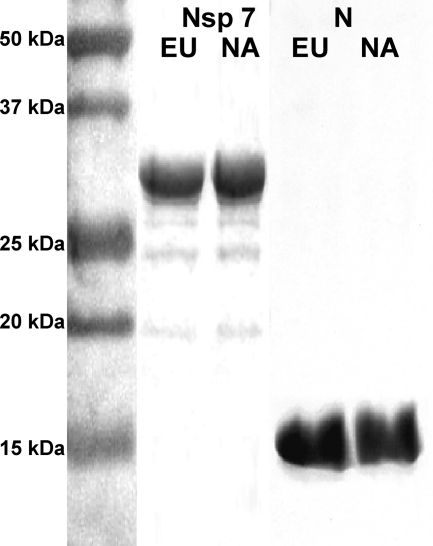
To develop an FMIA multiplex test, we initially expressed recombinant proteins NA-nsp7 and NA-N from type II PRRSV strain VR2332 and EU-nsp7 and EU-N from type I PRRSV strain SD01-08 as His-tagged fusion proteins in Escherichia coli. Both EU-nsp7 and NA-nsp7 were expressed at high levels, and they were purified in soluble forms. In contrast, recombinant EU-N and NA-N formed inclusion bodies, and a protein refolding step was performed. The purity of the recombinant proteins was evaluated using SDS-PAGE followed by Coomassie blue staining. As shown in Fig. 1, all of the His-tagged recombinant proteins migrated according to their predicted sizes. Recombinant nsp7 proteins showed bands of around 30 kDa, with >95% purity. The protein concentration was determined to be approximately 1.2 mg/ml. Recombinant N proteins showed bands of 17 kDa, with >90% purity and a concentration of 1.8 mg/ml. The identity of each protein was further confirmed by Western blot analysis with anti-His antibody (data not shown).
Fig 1.
Sodium dodecyl sulfate-polyacrylamide gel electrophoresis of recombinant PRRSV protein preparations, followed by Coomassie blue staining. The left lane shows the protein molecular mass standard; the remaining lanes represent EU nsp7, NA nsp7, EU N, and NA N protein preparations, as indicated. NA, North American genotype (type II); EU, European genotype (type I).
Fluorescent microsphere immunoassay development. (i) Establishment of control standards.
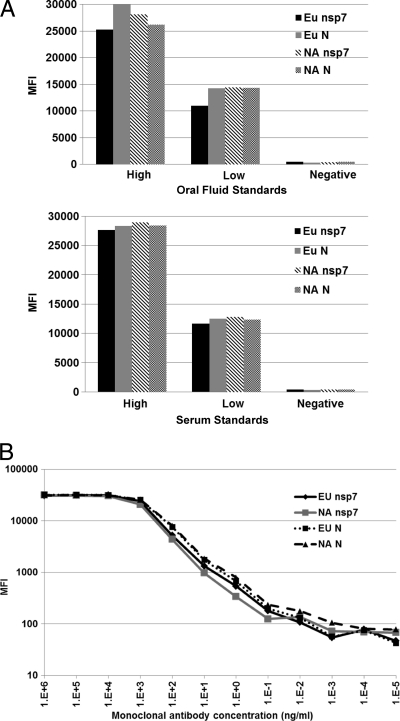
Two sets of internal control standards were established using the sera or oral fluid collected from experimental animals (sample sets A to D). Both serum and oral fluid standards were established as “high positive,” “low positive,” or “negative.” The high-positive standard generates an OD of 1.9 to 2.1 in ELISA and an MFI of 25,000 to 29,000 in FMIA. The low-positive standard generates an OD of 0.6 to 0.7 in ELISA and an MFI of 12,000 to 15,000 in FMIA. The negative standard generates an OD of <0.2 in ELISA and an MFI of 800 to 1,200 in FMIA (Fig. 2A).
Fig 2.
Fluorescent microsphere immunoassay development. (A) Reactivity of antigen-coupled beads with internal control oral fluid or serum samples. (B) Coupling efficiency of antigen-coated beads determined using antigen-specific MAb. Note that an antigen-specific MAb was detected at 1 ng/ml in each FMIA. MFI, mean fluorescence intensity.
(ii) Test optimization.
To determine the optimal concentrations for antigen coupling, a series of couplings were performed using various concentrations of antigen and were analyzed against control standards in order to determine the optimum amount of antigen per microsphere. Four sets of beads, each containing 3.125 × 10⁶ beads, were incubated with various concentrations (500 μg, 250 μg, and 100 μg) of purified EU-nsp7, NA-nsp7, EU-N, or NA-N recombinant protein. Based on the highest signal-to-noise ratio for detection of PRRSV-specific antibodies in standard oral fluid or serum, we determined that 250 μg per coupling reaction (80 μg protein/1 × 106 microspheres) was the optimal concentration for the coupling of EU-nsp7, NA-nsp7, EU-N, and NA-N proteins. The coupling efficiency of the antigen-coated beads was determined using an antigen-specific monoclonal antibody at log10 dilutions. As shown in Fig. 2B, relative coupling efficiency curves were generated, and an average correlation coefficient (R2) of 0.998 was calculated within the linear portion of the curve for all regression analytes.
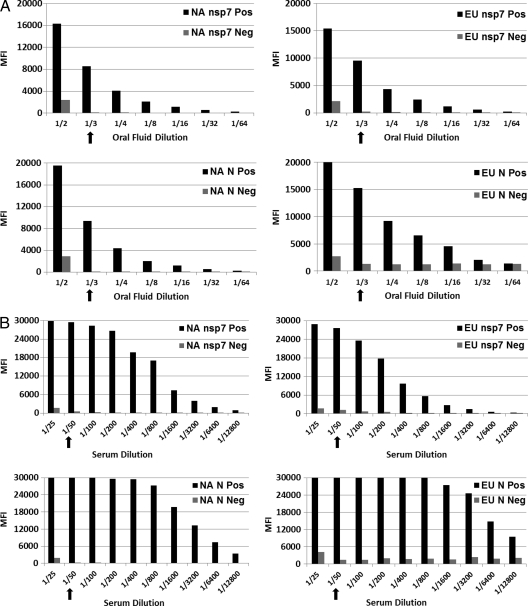
The optimal serum and oral fluid dilutions were determined by diluting serum and oral fluid samples in a log2 titration. Figure 3 shows concentration-dependent MFI signals. For oral fluid FMIA (Fig. 3A), it was determined that a 1:3 dilution of oral fluid samples gave an optimal signal-to-noise ratio, while for serum FMIA (Fig. 3B), a 1:50 dilution of serum samples gave an optimal signal-to-noise ratio.
Fig 3.
Optimization of the amount of oral fluid (A) or serum (B) for fluorescent microsphere immunoassay. The amount of internal standard sample was titrated 2-fold against a fixed number of antigen-microsphere complexes and then tested in FMIA to generate a maximal signal-to-noise ratio for MFI.
(iii) Cutoff determination, diagnostic sensitivity, and diagnostic specificity.
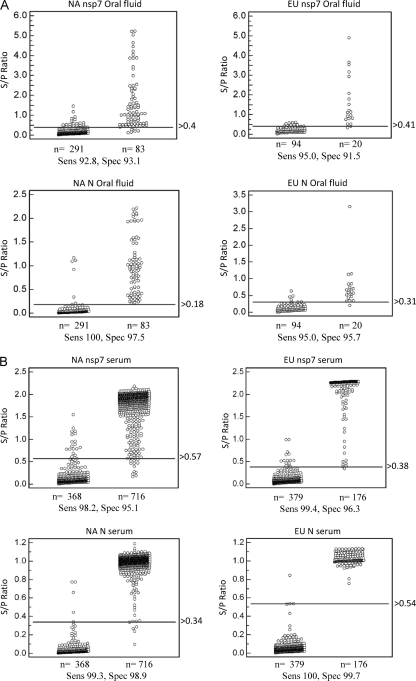
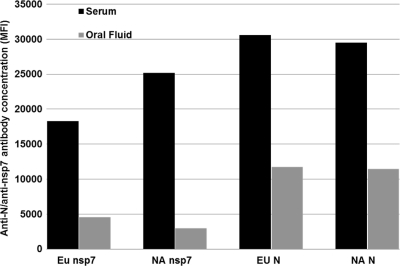
MedCalc software was used for ROC analysis of each FMIA to determine an optimized cutoff that maximizes both the diagnostic specificity and diagnostic sensitivity of each assay. Oral fluid samples from a known positive population (20 samples from type I PRRSV-infected animals and 83 samples from type II PRRSV-infected animals) and oral fluid samples from a known negative population (385 samples from PRRSV-free animals) were analyzed. For comparison, serum samples from a known positive population (176 samples from type I PRRSV-infected animals and 716 samples from type II PRRSV-infected animals) and serum samples from a known negative population (368 samples from PRRSV-free animals) were analyzed. These samples were obtained from experimental animals as described in Materials and Methods (sample sets A to D). The optimal cutoff value and diagnostic sensitivity and specificity of each individual test are presented in Fig. 4. Each oral fluid-based FMIA showed >90% diagnostic sensitivity and specificity (Fig. 4A), while >95% diagnostic sensitivity and specificity were achieved for serum-based FMIAs (Fig. 4B). Table 1 summarizes the results of ROC analysis. Diagnostic sensitivity and specificity were generally lower for the oral fluid-based assays. This result was expected since the antibody concentration in serum is substantially higher than that in oral fluid (refer to Fig. 6 and the detailed description below).
Fig 4.
Determination of diagnostic sensitivity (Sens) and specificity (Spec) by ROC analysis of oral fluid-based FMIA (A) and serum-based FMIA (B). Diagnostic sensitivity and specificity were calculated using samples from a known PRRSV-infected swine population (103 oral fluid and 892 serum samples) and a known PRRSV-negative swine population (385 oral fluid and 368 serum samples). ROC analysis was performed using MedCalc, version 10.4.0.0 (MedCalc Software, Mariakerke, Belgium). In each panel, the dot plot on the left represents the negative population, and the dot plot on the right side represents the positive population. A horizontal line between the positive and negative populations represents the cutoff value that gives the optimal diagnostic sensitivity and specificity.
Table 1.
Summary of ROC analysis of oral fluid- and serum-based FMIAs
| Test and parameter | Value |
|||
|---|---|---|---|---|
| NA nsp7 | EU nsp7 | NA N | EU N | |
| Serum FMIA | n = 1,084 | n = 555 | n = 1,084 | n = 555 |
| Sensitivity | 98.2 | 99.4 | 99.3 | 100 |
| Specificity | 95.1 | 96.3 | 98.9 | 99.7 |
| Oral fluid FMIA | n = 374 | n = 114 | n = 374 | n = 114 |
| Sensitivity | 92.8 | 95.0 | 100 | 95.0 |
| Specificity | 93.1 | 91.5 | 97.5 | 95.7 |
Fig 6.
Comparison of the amounts of antibody present in oral fluid and serum. Paired oral fluid and serum samples were collected at 21 dpi from the same individual pigs (n = 21), and the anti-N and anti-nsp7 antibody concentrations were determined by 4-plex FMIA.
(iv) Assessment of test repeatability.
The precision of each individual FMIA was determined using internal control standards. Table 2 shows the intra-assay and interassay repeatability of each test. Both intra-assay and interassay repeatability values were <10%CV for all tests, which suggests that these FMIAs are highly repeatable in diagnostic applications.
Table 2.
Assay repeatability of oral fluid- and serum-based FMIAs
| Repeatability assay | %CV |
|||
|---|---|---|---|---|
| nsp7-based assays |
N-based assays |
|||
| NA | EU | NA | EU | |
| Serum intra-assay repeatability | 1.0 | 2.3 | 1.9 | 1.7 |
| Serum interassay repeatability | 3.2 | 4.2 | 4.7 | 3.4 |
| Oral fluid intra-assay repeatability | 5.8 | 6.9 | 3.2 | 1.5 |
| Oral fluid interassay repeatability | 7.8 | 9.1 | 3.0 | 1.4 |
(v) Development of a multiplex assay.
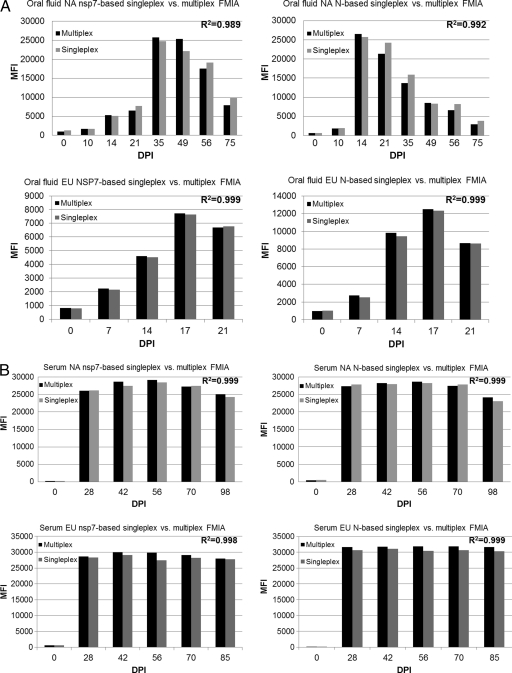
Once we validated each individual nsp7- and N-based FMIA in singleplex format, we combined the singleplex assays into a 4-plex assay. The 4-plex assay was compared with the singleplex assays to determine whether there was any cross-reactivity among bead sets. Each oral fluid and serum internal control standard along with the individual corresponding bead set was first tested in a singleplex format and then combined for testing in a 4-plex format. Correlation coefficients were determined for comparison between each individual N- and nsp7-based FMIA and the 4-plex assay. As shown in Fig. 5, there was no statistical difference between multiplex and singleplex analytes at any time point for both oral fluid (Fig. 5A)- and serum (Fig. 5B)-based assays. Both nsp7- and N-based FMIAs demonstrated high correlation coefficients (>0.98), indicating that there is very little cross-reactivity with the presence of multiple protein-coupled microspheres.
Fig 5.
Development of 4-plex fluorescent microsphere immunoassay. Each individual corresponding bead set (indicated in each panel) was first tested in singleplex format and then combined for testing in 4-plex format. (A) Oral fluid-based FMIAs; (B) serum-based FMIAs. The correlation coefficient (R2) indicated in each panel was determined for comparison between each singleplex assay and the 4-plex FMIA.
Evaluation of swine antibody response in oral fluid and serum samples.
Once we validated the FMIA, we further tested the feasibility of applying this test in an experimental study. Initially, we compared the amounts of antibody present in oral fluid and serum. We used paired oral fluid and serum samples that were collected at 21 dpi from the same individual pigs (sample set A). The relative anti-N and anti-nsp7 antibody concentrations were determined. As shown in Fig. 6, the EU and NA nsp7-based FMIAs showed 4.0 times and 8.4 times greater concentrations of detectable nsp7 antibody, respectively, in serum than in oral fluid. Both EU and NA N protein-based FMIAs showed a 2.6-fold difference in the level of anti-N antibody between serum and oral fluid.
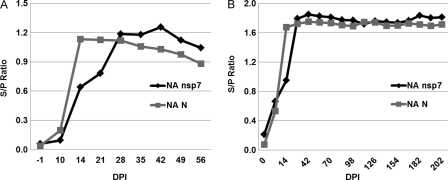
The FMIA was further employed to investigate the kinetics of the antibody responses in oral fluid and serum samples. Initially, a panel of oral fluid samples (sample set E) from 1,100 type II PRRSV-infected pigs collected at 7-day intervals was evaluated by NA nsp7- and NA N-based FMIAs. As shown in Fig. 7A, antibody responses to nsp7 and N could be detected as early as 14 dpi and lasted until 56 dpi (end of the study). The NA N-based FMIA was more sensitive for the detection of early infection (14 and 21 dpi), but the NA nsp7-based FMIA detected a higher antibody response after 28 days postinfection. We further evaluated the kinetics of the antibody response in serum samples (Fig. 7B). Serum samples from serial bleeds (sample set C; n = 1,014) were obtained from 109 pigs experimentally infected with type II PRRSV. Serum samples were collected at 7-day intervals for the first 2 weeks and then at 14-day intervals for up to 202 days postinoculation. There were similar peak antibody responses detected by both NA nsp7- and NA N-based FMIAs. Interestingly, seroconversion could be detected as early as 7 dpi in both FMIAs, while it would normally be detected at 14 dpi by ELISAs (1), suggesting the earlier appearance of FMIA-detectable antibody than ELISA-detectable antibody.
Fig 7.
Kinetics of antibody responses in serum and oral fluid samples. (A) A panel of pooled oral fluid samples (n = 9) from 1,100 type II PRRSV-infected pigs collected at 7-day intervals was evaluated by FMIA. (B) A total of 1,014 serum samples obtained from 109 pigs experimentally infected with type II PRRSV were tested by FMIA. The samples were collected at 7-day intervals for the first 2 weeks and then at 14-day intervals for up to 202 dpi. The S/P ratio was calculated as follows: S/P = (MFI of sample − MFI of buffer)/(MFI of positive control − MFI of buffer).
Application of 4-plex FMIA for detection of PRRSV infection in field samples.
The robustness of the FMIA was further evaluated with field samples. Since there are no oral fluid samples available for routine serological diagnosis in diagnostic laboratories, field serum samples were used to assess the efficacy of the FMIA. Each sample was tested simultaneously for its reactivity with the EU-nsp7, NA-nsp7, EU-N, and NA-N antigens by using the 4-plex assay. A total of 772 field serum samples (sample set F) submitted to the South Dakota Animal Disease Diagnostic Laboratory were evaluated. These samples were initially tested by IDEXX ELISA and then tested by 4-plex FMIA. Comparing FMIA with IDEXX ELISA, 383/383 (100%) IDEXX ELISA-positive samples tested positive by the nsp7- and N-based 4-plex FMIA. Similarly, of the field samples originally testing negative by IDEXX ELISA, 384/389 (98.7%) were negative by the nsp7-based FMIA, while 389/389 (100%) tested negative by the N protein-based FMIA (Table 3).
Table 3.
Comparison of FMIA with IDEXX ELISA for evaluation of field serum samples
| Serum group | No. of samples |
|||
|---|---|---|---|---|
| IDEXX positive | IDEXX negative | FMIA positive | FMIA negative | |
| IDEXX-positive population (n = 383) | 383 | 0 | 383 | 0 |
| IDEXX-negative population (n = 389) | 0 | 389 | 5 | 384 |
DISCUSSION
The development of diagnostic tests that are able to detect PRRSV-specific antibodies in oral fluid samples offers an important tool for PRRS surveillance in commercial herds and boar studs. Oral fluid sampling has marked advantages over serum sampling, including lower labor/material costs, noninvasive collection, and lower biosecurity risks because samples can be collected by site personnel. This is more important for PRRS surveillance programs at the population level. The development of oral fluid-based diagnostic tests will be a significant breakthrough in our effort to control PRRSV, because it will be a major improvement in our ability to cheaply and efficiently track PRRSV infections in both populations and individual animals. A previous study of 10 wean-to-finish commercial barns showed that oral fluid sampling of 6 of 42 pens (1,100 head) at 2-week intervals effectively and efficiently detected circulation of PRRSV, porcine circovirus type 2 (PCV2), and swine influenza virus (SIV) by PCR (11, 12). In this study, we developed a multiplex FMIA using oral fluid. For comparison, a serum-based FMIA was also developed. These assays are based on the detection of antibodies against the nsp7 and N proteins of both genotypes of PRRSV. N protein was selected as an antigen because it is highly conserved among different strains of PRRSV and because all current commercially available serological tests are based on this protein. nsp7 was selected based on the highly immunogenic nature of the protein (1). Both antigens were prepared by expression as recombinant proteins in E. coli. It was noted that generation of highly purified recombinant proteins and maintenance of the native conformation of proteins were required for the test. High-level expression of N protein resulted in the formation of inclusion bodies, requiring a refolding step to restore the native conformation of the protein. nsp7 was expressed as a soluble recombinant protein in bacterial culture, which is convenient for antigen preparation, especially applied to diagnostic settings requiring large volumes of antigen. However, the protein seems sensitive to degradation. It is important to ensure that the recombinant protein is handled properly, such as by preventing multiple freeze-thaw cycles, keeping the protein at cold temperatures, and including protease inhibitors in the recombinant protein extraction and purification reagents.
The FMIAs using type I PRRSV antigens seemed to have slightly lower diagnostic sensitivity and specificity than those of the assays using type II PRRSV antigens. This could have been caused by the small sample size of oral fluid from type I PRRSV-infected pigs, which may bias the statistical analysis. Since pen-based sampling was used for oral fluid, it reduced the actual number of samples. The panel of type I PRRSV oral fluid samples used in this study was generated from a recent pig study at South Dakota State University. Unfortunately, this type of sample is not available for antibody detection in other diagnostic or research laboratories in the United States. In addition, since oral fluid is not a routine sample for antibody evaluation in diagnostic laboratories, we were unable to test the feasibility of applying FMIA to field oral fluid samples. Instead, serum samples were used for further validation of the FMIA in field settings. We expect that our initial studies with oral fluid, including the current FMIA development study, will change traditional serum-based sampling methods, and oral fluid may eventually become a standard sample routinely used for diagnostic evaluation.
In comparing the oral fluid-based assay to the serum-based assay, the oral fluid-based assay had a slightly lower diagnostic sensitivity and specificity. This result was expected, since we have shown that lower concentrations of antibodies are present in oral fluid samples. The markedly lower levels of antibody in oral fluid may be due to physiological and anatomical differences in how antibody is secreted through gingival crevicular tissues. On the other hand, they may be due to environmental factors such as high levels of proteases present in the buccal mucosa and oral fluid. In comparison to oral fluid-based ELISA, the oral fluid-based FMIA had a significantly higher signal-to-noise ratio (9.9 and 2.4 for N protein-based FMIA and ELISA, respectively). Although further optimization of oral fluid-based ELISA may be necessary to improve the test sensitivity, our results demonstrate the feasibility of using FMIA as an alternative to ELISA for serological detection of PRRSV infection in oral fluid.
The FMIA we developed with the PRRSV nsp7 and N antigens provided important information regarding the kinetics of the antibody response of pigs to these proteins during the time course of infection. In comparison to the antibody responses to different antigens, a higher level of antibody response to N protein was observed in early infection (14 dpi), but the antibody titer to nsp7 was higher after 28 dpi and remained at a high level through the end of the experiment (56 dpi). Another interesting observation is that the antibody response could be detected as early as 7 dpi by FMIA with serum samples. In our previous study, the same panel of serum samples was tested by IDEXX ELISA and nsp7 ELISA. The earliest detection of an antibody response was at 14 dpi (1). These results demonstrate a greater analytical sensitivity of FMIA than ELISA. In serum FMIA, antibody detection seemed to reach the maximal level after 28 dpi. There were similar peak antibody titers to nsp7 and N proteins, and the antibody responses to both proteins were sustained through 202 days postinfection. These results will be important for future applications of FMIA in PRRS surveillance programs. Data on the proportion of a herd population that is immune or has been infected have many important epidemiologic applications for disease control, including (i) determining the timing of infection and/or immune status, (ii) identifying susceptible groups in the population so that such animals can be quarantined or removed in a timely fashion to prevent transmission to naïve animals, and (iii) using these data in mathematical modeling to predict disease outbreaks and design better management strategies.
In summary, we have developed an FMIA that is able to detect virus-specific antibodies in oral fluid. This study represents the “proof-of-concept” phase for new PRRS diagnostic test development using oral fluid samples. The availability of the oral fluid-based assay will translate into an improvement in our ability to conduct field studies and monitor herd health status in regional control programs. This technology can be applied to other swine pathogens, including PCV2, SIV, and Mycoplasma hyopneumoniae, and this is currently under development in our laboratories. Our ultimate goal is to develop rapid multiplex tests to detect various swine pathogens simultaneously in a single test sample. We believe that success in this will revolutionize the way we survey diseases in swine herds by using a more efficient method as we move toward control and elimination of specific diseases.
ACKNOWLEDGMENTS
We thank Paul Yeske (Swine Vet Center, St. Peter, MN) for providing the oral fluid samples and Rusty Ransburgh, Breanna Sandager, Elizabeth Brown, and Craig Welbon for excellent technical assistance in oral fluid collection. We give special thanks to Joan Lunney (BARC, ARS, USDA) and Michael Murtaugh (University of Minnesota) for helpful discussions and suggestions.
This project was supported by the National Pork Board (grant 09-234).
Footnotes
Published ahead of print 7 December 2011
REFERENCES
- 1. Brown E, et al. 2009. Antibody response to porcine reproductive and respiratory syndrome virus (PRRSV) nonstructural proteins and implications for diagnostic detection and differentiation of PRRSV types I and II. Clin. Vaccine Immunol. 16:628–635 [DOI] [PMC free article] [PubMed] [Google Scholar]
- 2. Conell JC, Parry JV, Mortimer PP, Duncan J. 1993. Novel assay for the detection of immunoglobulin G antihuman immunodeficiency virus in untreated saliva and urine. J. Med. Virol. 41:159–164 [DOI] [PubMed] [Google Scholar]
- 3. Emmons WW, Paparello SF, Decker CF, Sheffield JM, Lowe-Bey FH. 1995. A modified ELISA and Western blot accurately determine anti-human immunodeficiency virus type 1 antibodies in oral fluids obtained with a special collecting device. J. Infect. Dis. 171:1406–1410 [DOI] [PubMed] [Google Scholar]
- 4. Ferrin NH, et al. 2004. Validation of a blocking ELISA for the detection of antibodies against porcine reproductive and respiratory syndrome virus. Clin. Diagn. Lab. Immunol. 11:503–514 [DOI] [PMC free article] [PubMed] [Google Scholar]
- 5. Frerichs RR, Htoon MT, Eskes N, Lwin S. 1992. Comparison of saliva and serum for HIV surveillance in developing countries. Lancet 340:1496–1499 [DOI] [PubMed] [Google Scholar]
- 6. Kim HS, Kwang J, Yoon KJ, Joo HS, Frey ML. 1993. Enhanced replication of porcine reproductive and respiratory syndrome (PRRS) virus in a homogeneous subpopulation of MA-104 cell line. Arch. Virol. 133:477–483 [DOI] [PubMed] [Google Scholar]
- 7. Kittawornrat A, et al. 2010. Porcine reproductive and respiratory syndrome virus (PRRSV) in serum and oral fluid samples from individual boars: will oral fluid replace serum for PRRSV surveillance? Virus Res. 154:170–176 [DOI] [PubMed] [Google Scholar]
- 8. Lawson SR, et al. 2010. Development of an 8-plex Luminex assay to detect swine cytokines for vaccine development: assessment of immunity after porcine reproductive and respiratory syndrome virus (PRRSV) vaccination. Vaccine 28:5356–5364 [DOI] [PubMed] [Google Scholar]
- 9. Nokes DJ, et al. 2001. Has oral fluid the potential to replace serum for the evaluation of population immunity levels? A study of measles, rubella and hepatitis B in rural Ethiopia. Bull. World Health Organ. 79:588–595 [PMC free article] [PubMed] [Google Scholar]
- 10. Parry JV, Perry KR, Mortimer PP. 1987. Sensitive assays for viral antibodies in saliva: an alternative to tests on serum. Lancet ii:72–75 [DOI] [PubMed] [Google Scholar]
- 11. Prickett J, et al. 2008. Detection of porcine reproductive and respiratory syndrome virus infection in porcine oral fluid samples: a longitudinal study under experimental conditions. J. Vet. Diagn. 20:156–163 [DOI] [PubMed] [Google Scholar]
- 12. Prickett J, Simer R, Yoon KJ, Kim WI, Zimmerman JJ. 2008. Oral-fluid samples for surveillance of commercial growing pigs for porcine reproductive and respiratory syndrome virus and porcine circovirus type 2 infections. J. Swine Health Prod. 16:86–91 [Google Scholar]
- 13. Wills RW, et al. 1997. Porcine reproductive and respiratory syndrome virus: routes of excretion. Vet. Microbiol. 57:69–81 [DOI] [PMC free article] [PubMed] [Google Scholar]


