Abstract
Magnetic resonance imaging (MRI) has emerged as a leading diagnostic technique in clinical and preclinical settings. However, the application of MRI to assess specific disease markers for diagnosis and monitoring drug effect has been severely hampered by the lack of desired contrast agents with high relaxivities, and optimized in vivo retention time. We have reported the development of protein-based MRI contrast agents (ProCA1) by rational design of Gd3+ binding sites into a stable protein resulting in significantly increased longitudinal (r1) and transverse (r2) relaxivities compared to Gd-DTPA. Here, we report a further improvement of protein contrast agents ProCA1 for in vivo imaging by protein modification with various sizes of polyethylene glycol (PEG) chain. PEGylation results in significant increases of both r1 and r2 relaxivities (up to 200%), and these high relaxivities persist even at field strengths up to 9.4 T. In addition, our experimental results demonstrate that modified contrast agents have significant improvement of in vivo MR imaging and biocompatibilities including dose efficiency, protein solubility, blood retention time and decreased immunogenicity. Such improvement can be important to the animal imaging and pre-clinical research at high or ultra-high field where there is an urgent need for molecular imaging probes and optimized contrast agent.
Keywords: Contrast agent, Magnet Resonance Imaging, PEGylation, Relaxivity
1. Introduction
Magnetic resonance imaging (MRI) has unique advantages in capturing 3-dimensional images of living systems with high spatial resolution and without limitations of the depth of tissue/organs and ionized radiation [1–5]. MRI has emerged as a leading diagnostic technique in clinical and preclinical settings [6, 7]. In addition, it allows for non-invasive and repetitive assessment of biological processes with the same living subject at different time points, which significantly reduces both the number of animals required and cost [8–10]. However, the application of MRI to assess specific disease markers for diagnosis and monitoring drug effects has been severely hampered by the lack of desired contrast agents with high relaxivity, minimal or no toxicity, and optimized in vivo retention time [11]. For example, gadolinium-diethylenetriamine pentaacetic acid (Gd-DPTA), a current clinically approved MRI contrast agent, has a low relaxivity value of ~5 mM−1 s−1 and requires an injection dose of up to 0.1 mmol kg−1 body weight for clinical application in animals and humans [12]. In addition, Gd-DPTA may not be suitable for some advanced in vivo MRI applications due to a high glomerular filtration rate for this small chelate molecule [13, 14]. The non-covalent binding of small chelate to plasma proteins, such as albumin (MS-325), greatly increases the relaxivity with a good MR angiography [15, 16]. There is a strong need to develop MRI contrast agents with improved relaxivity, optimized pharmacokinetics, and application to molecular imaging.
We have reported the development of protein-based MRI contrast agents (ProCA1, previously named as CA1.CD2) by rational design of Gd3+ binding sites into a stable protein using amino acid residues as metal coordinating ligands [17]. Our specially designed Gd-binding protein-based contrast agents are different from other reported macromolecular MRI contrast agents, such as Gd-DTPA-based dendrimers, or nano-sized contrast agents that are developed by multiple attachment of an existing small chelator for Gd3+. Our designed protein MRI contrast agent exhibits higher r1 and r2 relaxivities compared to Gd-DTPA. Here, we report a further improvement in the design of protein based contrast agents ProCA1 for in vivo imaging by protein modification with various sizes of polyethylene glycol (PEG) chain (‘PEGylation’). Our experimental results demonstrate that modified contrast agents exhibit significant improvement of in vivo MR imaging and biocompatibilities including increases in relaxivities, protein solubility, and blood retention time and decreased immunogenicity.
2. Materials and methods
2.1. Protein engineering and PEGylation
The designed protein ProCA1 was expressed in E. coli BL21 (DE3) cell line. The purification procedures followed the protocols of GST-fusion protein purification using Glutathione Sepharose 4B beads (GE Healthcare). The GST-tag fused to proteins was cleaved on beads by the addition of thrombin (GE Healthcare). Methyl-PEOn-NHS esters, the deviant of PEG with different molecular weights of 0.3, 0.6, 2.4, 5, 12 and 20 kDa (Pierce and Jenkem, respectively) were selected to modify the designed protein. PEGylation was carried out in phosphate buffered saline buffer (pH 7.4) with a 1:5 ratio of protein and PEGs. Modified ProCA1s were further purified by FPLC and confirmed by MALDI-TOF mass spectrometric analysis.
2.2. Metal binding affinity and relaxivity measurement
The Gd3+-binding affinities with ProCA1 and ProCA1-PEG were investigated by competitive assay with the dye Fluo5N (a metal ion indicator, Invitrogen). The fluorescence spectra were collected on a fluorescence spectrophotometer (Photon Technology International, Inc.) with a 10 mm path length quartz cell at room temperature. The fluorescence intensity at 520 nm was normalized and the apparent constant was estimated by curve-fitting. The dissociation constant was calculated based on the Kd measured in a previous report [17]. Spin-lattice relaxation time T1 and spin-spin relaxation time T2 of ProCA1s with various PEG sizes were determined on the selected magnetic field strength (0.47, 1.4, 3.0 and 9.4 T) at 37 °C in 10 mM Tris buffer, pH7.0. The relaxivities, r1 and r2, were calculated by the equation ri = 106 × (1/Ti−1/Tc)/ [Gd3+], where Tc is the relaxation time of the buffer.
2.3. Coordination water number determination
The number of water ligands coordinated to the Gd3+-ProCA1 complex was determined by measuring Tb3+ luminescence decay in H2O or D2O. The Tb3+ excited-state lifetime was measured using a fluorescence spectrophotometer (Photon Technology International, Inc.) with a 10 mm path length quartz cell at 22 °C. Following excitation at 265 nm with a XenoFlash lamp, Tb3+ emission was monitored at 545 nm in both H2O and D2O systems. Luminescence decay lifetime was obtained by fitting the acquired data with a mono-exponential decay function. A standard curve correlating the difference of rate constants obtained in H2O and D2O (Δkobs = kH2O − kD2O) with water number (q) under our experimental conditions was established by using well-characterized chelators. The water numbers coordinated to the Tb3+-ProCA1s complexes were then obtained by fitting the acquired Δkobs value to the standard curve.
2.4. Immunogenicity and ELISA
Rabbits (n = 2) were intraperitoneally administrated Gd-ProCA1 and its PEGylated variants mixed with or without adjuvant according to the standard protocol. The rabbits were subjected to repeated immunizations over a 3-week interval. Blood samples were examined by ELISA and immunoblotting using polyclonal antibody PabCD2 as positive control and the pre-bleed as negative controls. In the ELISA, the secondary antibody, HRP, was conjugated and reacted with OPD for 5 min. The optical density at 490 nm was measured.
2.5. In vivo imaging
A Varian Inova 4.7 T/200 MHz/33cm horizontal/spectroscopy imaging system with a protocol approved by the Institutional Animal Care and Use Committee (IACUC) at Georgia State University was used in the in vivo imaging studies. During MR scan, the mice (20 – 25 g, n = 4) were under anesthesia with 1.5% isoflurane gas mixture and then positioned and stabilized in the coil. The mice were kept warm with water bath during the scan. The mice were scanned before and after the administration of any contrast agents and kept in the same position. MR images of the whole body were acquired by T1- and T2-weighted fast spin echo sequences (TR(Repetition time) = 2 s, TE(Echo time) = 0.022 s, and ESP(Echo spacing) = 0.01 s) with field of view of 3 × 3 cm, matrix of 256 × 256, and slice thickness of 1 mm. The Gd-ProCA1-PEGs were prepared at a concentration of 1.2 mM in HEPES buffer, pH7.0. About 100 µL of the designed agent was injected into CD-1 mice via the tail vein each time. ImageJ (Rasbamd, W.S., NIH) was used to quantitatively analyze the MR images. The regions of interest were selected by circling the different parts of organs. Then the signal intensities were calculated and compared.
2.6. Blood retention time assay
The 153Gd3+ isotope dilution method was used. All agents were incubated with diluted 153Gd3+ at room temperature for 12 h and the free Gd3+ was removed by Sephadex G25 desalting column. The CD-1 mice (20 – 25g, n = 3) were executed at different time points after injection of about 100 µL agents at a concentration of 0.12 mM in HEPES buffer, pH7.0. The Gd3+ content in blood and different organs was detected directly by measurement of 153Gd3+ radio activities.
2.7. Tumor cell targeting
The SKOV-3, which originates from human breast cancer, has a HER2expression level of about 106/cell. The MBD-MB-231 is a HER2 negative cell line with a HER2 expression level of about 103/cell. ProCA1-P2.4k and ProCA1-affi-P2.4k were incubated with the two kinds of cells at 37 °C for 1 h. Then the cells were washed at least 3 times, 5 min each, with Tris buffer containing glycine and methanol. The primary antibody was generated on rabbit by using ProCA1-affi as antigen. The secondary antibody was FITC conjugated (Invitrogen).
3. Results and discussion
3.1. Protein engineering and PEGylation
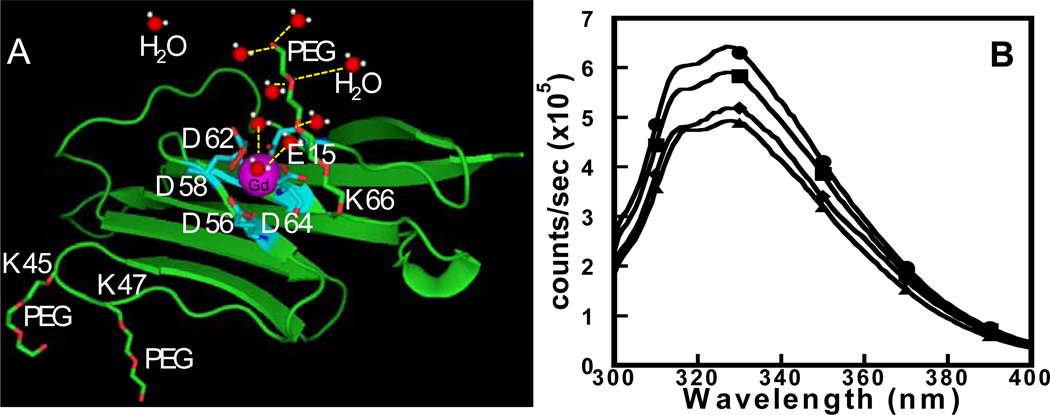
PEG is an FDA approved non-toxic, non-immunogenic, non-antigenic material which is highly soluble in water. PEGylation has been widely used as a modification method for improving the biomedical properties and pharmacokinetics of therapeutic proteins [18–21]. Fig. 1A shows the modeled structure of the designed contrast agent ProCA1 with Gd3+ binding site and the cartoon structure of the secondary and outer sphere water molecules associated with PEG chain.
Fig. 1.
(A) Modeled structure of the designed contrast agent ProCA1 is shown with Gd3+ (purple) binding site (cyan), and the cartoon structure of the secondary and outer sphere water molecules (red and white) associated with PEG chain (red and green) are highlighted. (B) The Trp emission fluorescence spectrum of ProCA1-PEG0.6k (●) and ProCA1-PEG2.4k (■) are similar to ProCA1 (◆) and W.T. CD2 (▲), indicating that the PEGylation did not alter the overall conformation of the protein.
Bacteria expressed and purified protein ProCA1 was PEGylated with Methyl-PEOn-NHS esters with different molecular weights of 0.3, 0.6, 2.4, 5, 12 and 20 kDa, respectively, and further purified by FPLC and confirmed by the MALDI-TOF mass spectrometric analysis (Supplementary data, Figs. S1, S2 and S3) with one to three PEG chains attached. First, we confirmed that PEGylated proteins maintain a native structure monitored by Trp fluorescence (Fig. 1B). PEGylated ProCA1 exhibited similar disassociation constants for Gd3+ with a 1 to 1 binding ratio to those of ProCA1 (Fig. 2A and Table 1) [17].
Fig. 2.
(A) The Gd3+-binding affinity measurement of native ProCA1 was determined by a competing titration using Fluo-5N as a Gd3+ indicator. The inset shows the fluorescence spectra (λex = 488 nm) of Fluo-5N with a gradual increase of ProCA1 from 0 µM (top) to 160 µM (bottom). The fluorescence intensity at 520 nm was normalized and the apparent constant (Kapp = 18 ± 3 µM) was estimated by a curve-fitting. The dissociation constant (Kd(Gd-ProCA1) = 3.5 × 10⁻¹² M) was calculated based on the Kd measured in previous report [17]. The Gd3+-binding dissociation constants Kds of PEGylated ProCA1 variants were measured with the same method and summarized in Table 1. (B) Hydrodynamic radii of ProCA1 (◆) and various PEGylated ProCA1 with PEG chains PEG0.6k (●), PEG2.4k (■) and PEG12k (▲), were determined by pulse-field-gradient diffusion on 600 MHz NMR. PEGylation increased the radii gradually based on PEG size increased. Data were fitted by a one component equation, exp (−m1*m0^ 2), and the final results are shown in Table 1.
Table 1.
Properties of Gd-DTPA, ProCA1 and its PEGylated variants.
| Sample | Gd-DTPA | ProCA1 | ProCA1 PEG0.6k |
ProCA1 PEG2.4k |
ProCA1 PEG12k |
|---|---|---|---|---|---|
| D | - | 13.9 | 12.9 | 12.1 | 6.5 |
| Radius (Å) | - | 16.9 | 18.2 | 19.4 | 40.2 |
| Log Ka | 18.4[11] | 11.46 | 11.26 | 11.70 | 11.08 |
| q | 1.1[30] | 2.4 | 3.2 | 3.0 | 2.6 |
| r1 (mM−1 s−1) | 4.5 | 23.8 | 39.5 | 47.6 | 83.8 |
| r2 (mM−1 s−1) | 5.2 | 43.7 | 92.5 | 98.7 | 100.8 |
D is the diffusion constant (×107 cm2 s−1) calculated from the Debye-Stokes-Einstein equation. The radius values were obtained by fitted data from the pulse-field-gradient NMR experiment. q is the water coordination number determined by measuring Tb3+ luminescence decay in H2O or D2O. Ka is the conditional association constant of contrast agents with Gd3+ and is the reciprocal of dissociation constant Kd (Kd = 1/Ka). Relaxation times were measured on the 0.47 T Mini Spec Relaxometer (Bruker).
3.2. Metal binding affinity, relaxivity, and coordination water number measurement
Gd3+-binding affinities of PEGylated and native CA1.CD2 were determined by a competition titration with Fluo-5N applied as a Gd3+ indicator in various chelate-metal buffer systems. The Gd3+-binding affinity of native ProCA1 was determined with an estimated apparent constant Kapp of 18 ± 3 µM (Fig. 2A). The dissociation constant (Kd(Gd-ProCA1) = 3.5 × 10⁻¹² M) was calculated based on the Kd measured in our previous report and the equation below[17]. The Gd3+-binding dissociation constants Kds of PEGylated ProCA1 variants were measured with the same method and summarized in Table 1.
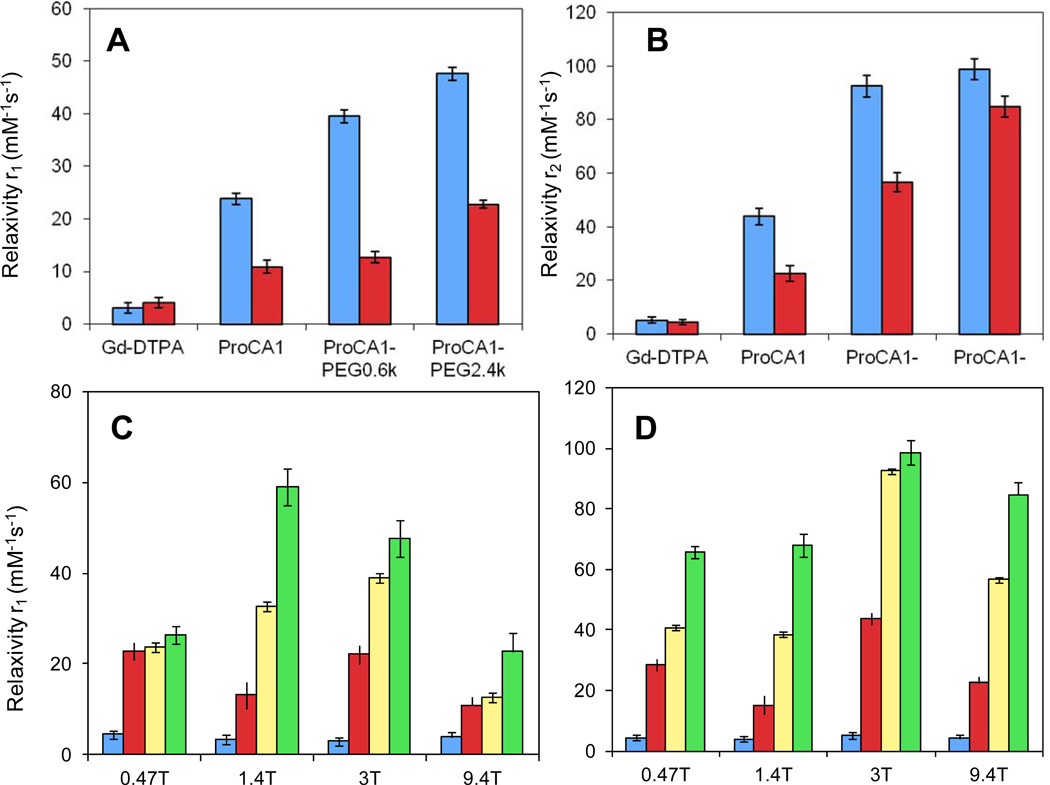
Next, we observed that the PEGylation modifications dramatically increased longitudinal and transverse relaxivities of the ProCA1 at different field strengths tested (0.47, 1.4, 3.0 and 9.4 T). The r1 and r2 values of ProCA1-PEG0.6k measured at 0.47 T were 39.5 mM−1s−1 and 92.5 mM−1s−1, respectively, which is an increase of almost 66% and 110% compared with ProCA1. The r1 and r2 values of ProCA1-PEG2.4k increased by 100% and 125%. The r1 and r2 values of ProCA1-PEG12k were 83.8 mM−1 s−1 and 100.8 mM−1 s−1, respectively, an increase of 252% and 130% from ProCA1. By comparison with Gd-DTPA, whose r1 and r2 values are less than 10 mM−1 s−1 at any magnetic field strength [22,23], the ProCA1 and PEGylated ProCA1 showed dramatically higher r1 and r2 values. ProCA1-PEG12k exhibited 19-fold higher r1 and r2 values compared with Gd-DTPA (Fig. 3 and Table 1). PEGylated ProCA1 displayed relaxivities that were even higher than nano-particle-based contrast agents, whose r1 is 25.3 mM−1 s−1 at 1.4 T [24]. More interestingly, at high field strength of 9.4 T, ProCA1-PEG2.4k still exhibited great increase of relaxivity values r1 and r2.
Fig. 3.
Relaxivity values r1 (A) and r2 (B) at field strengths 3.0 T(blue) and 9.4 T (red) of Gd-DTPA, ProCA1and its PEGylated variants. Relaxivity values r1 (C) and r2 (D) of Gd-DTPA (blue), ProCA1 (red), ProCA1-PEG0.6k (yellow), and ProCA1-PEG2.4k (green) at different field strengths.
The coordination water numbers of both PEGylated and non-PEGylated ProCA1 were measured (Supplementary data, Fig. S4). Table 1 shows that ProCA1 had a hydration number of 2.4. PEGylation resulted in an increase of 0.2 – 0.8 in hydration number. Subsequently, the hydrodynamic radii of modified ProCA1s were determined by a pulse-field-gradient diffusion NMR, which shows an increase from 16.9 ± 0.2, to 18.2 ± 1.1, 19.4 ± 0.55 and 40.2 ± 0.2 Å, with 0.6, 2.4 and 12 kDa PEG, respectively (Table 1 and Fig. 2B).
3.3. In vivo imaging
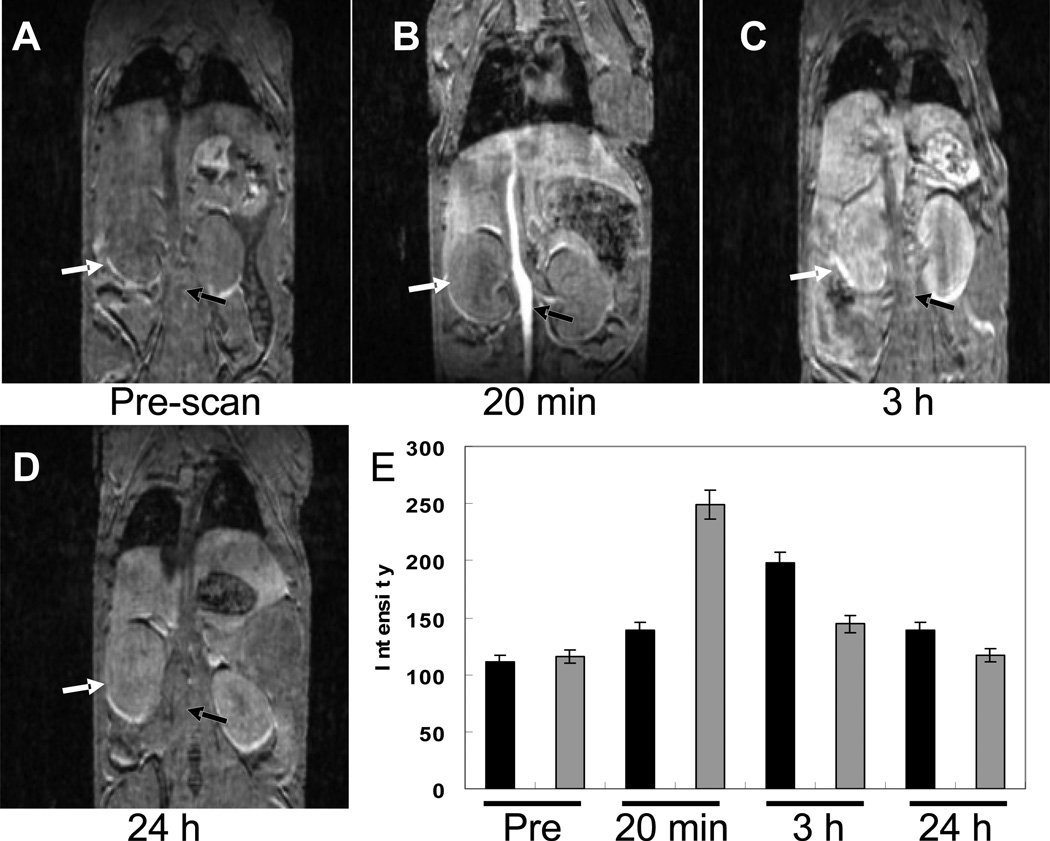
Fig. 4 Shows the MR images of ProCA1 injected mouse scanned on 4.7 T at different time points using 3D-gradient echo. The MRI signal of the blood vessel was increased 3 minutes post injection. Kidneys and liver remained enhanced 3 h after injection. The image signals decreased after 24 h, indicating that the contrast agents had been excreted from the body. Gd-DTPA generates an initial contrast in blood within 1 minute and circulation time and contrast last only 10 or less minutes [25]. After 20 minutes, no enhancement is seen (Fig. S5).
Fig. 4.
MR images of ProCA1 injected mouse scanned on 4.7 T at different time points using 3D-gradient echo sequence. (A) Pre-scan without injection of ProCA1. (B) MR image scanned after 20 minutes injection of ProCA1. (C). MR image scanned after 3 h injection of ProCA1. Arrows indicate the enhancement of artery and kidney. (D) MR image scanned after 24 h injection of ProCA1. (E) Comparison of MR image intensities of the kidney (black) and artery (grey) as a function of time before and after injection of ProCA1.
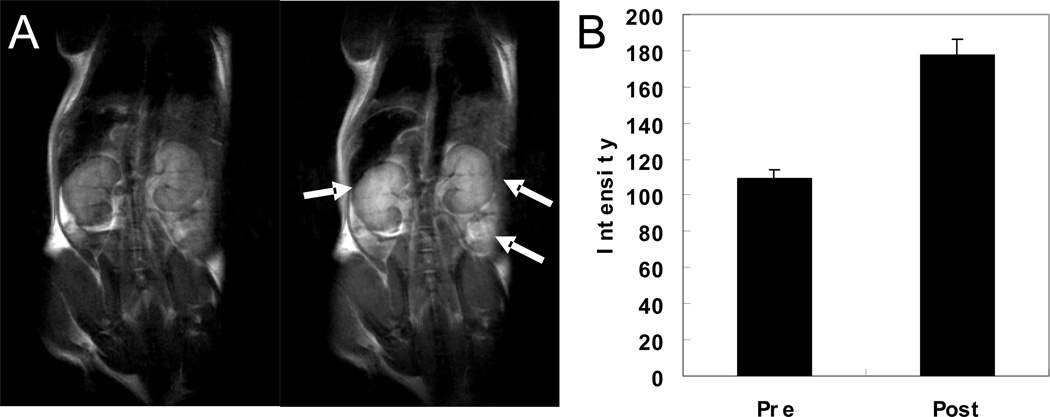
PEGylation increased the solubility of protein contrast agents in aqueous solutions 20- to 100-fold, most likely due to the strong hydrophilicity of the PEG chains. Significant increases in the solubility of contrast agents permit us to perform in vivo studies. Fig. 8 shows the T1-weighted fast spin-echo MR images of the mouse before (left) and 0.5 h after administration (right) of PEGylated Gd-ProCA1 (dose of 4.8 µmol kg−1) through tail vein injection. Significant contrast enhancements were observed in the kidney, liver, and blood vessels by comparison with pre- and post-contrast T1 weighted images. The injection dose used was 20-fold lower than the Gd-DTPA dose typically used in clinics (0.1 mmol kg−1).
Fig. 8.
(A) T1-weighted fast spin-echo (TR = 2 s, TE = 0.022 s, ESP = 0.01 s, slice thickness = 1 mm) MR images of a mouse before (left) and 0.5 h after administration (right) of Gd-ProCA1-PEG2.4k. (B) Comparison of MR image intensities of kidney before and after applying the contrast agents.
3.4. In vivo toxicity
The ProCA1 variants also exhibit low in vivo toxicity. Metal complexation is a key mediator or modifier of enzyme structure and function. Group IA metals Na+ and K+ play important and specific roles that assist function of biological macromolecules [26]. Ca2+ plays a pivotal role in the physiology and biochemistry of organisms and the cell [27, 28]. As a result, it is essential to test the chemical properties. Selected metal ion concentrations (K+, Na+ and Ca2+) and enzymatic activity were measured from the collected blood of mice injected with ProCA1 and the PEG variants (Research Animal Diagnostic Laboratory, University of Missouri). The results (Table 2) show that the metal ion concentrations of mice injected with ProCA1-PEGs are at the same level as those injected with saline. In addition, the level of liver enzyme alanine transaminase remains normal for mice administered ProCA1-PEGs compared to those injected with saline. However, kidney enzyme alkaline phosphatase (ALP) was present in lower levels for mice injected with ProCA1-PEGs than those injected with saline. In summary, we note no apparent in vivo toxicity of ProCA1 relative to the control group.
Table 2.
Toxicity of designed protein contrast agents.
| Sodium (mM) |
Sodium (mM) |
Calcium (mg dL−1) |
Creatinine mg dL−1) |
ALT (U L−1) |
ALP (U L−1) |
|
|---|---|---|---|---|---|---|
| ProCA1 | 151.9±1.6 | 11.7±0.5 | 11.2±0.1 | 0.27±0.02 | 32±4 | 22±1 |
| ProCA1-PEG0.6k | 150.8±4.0 | 10.3±1.4 | 10.5±0.5 | 0.22±0.02 | 49±4 | 35±4 |
| ProCA1-PEG2.4k | 156.3±2.0 | 11.2±0.5 | 10.2±0.2 | 0.20±0.02 | 65±8 | 38±6 |
| Saline | 151.8±11.0 | 11.8±2.3 | 11.0±0.5 | 0.32±0.01 | 39±5 | 89±11 |
The ion concentrations of Na+, K+, Ca2+ and liver finction enzymes alanine transaminase (ALT) and alkaline phosphatase (ALP) were measured in four groups of mice via tail vein injection dosage of 150 mg Kg−1.
3.5. Blood retention and immunogenicity
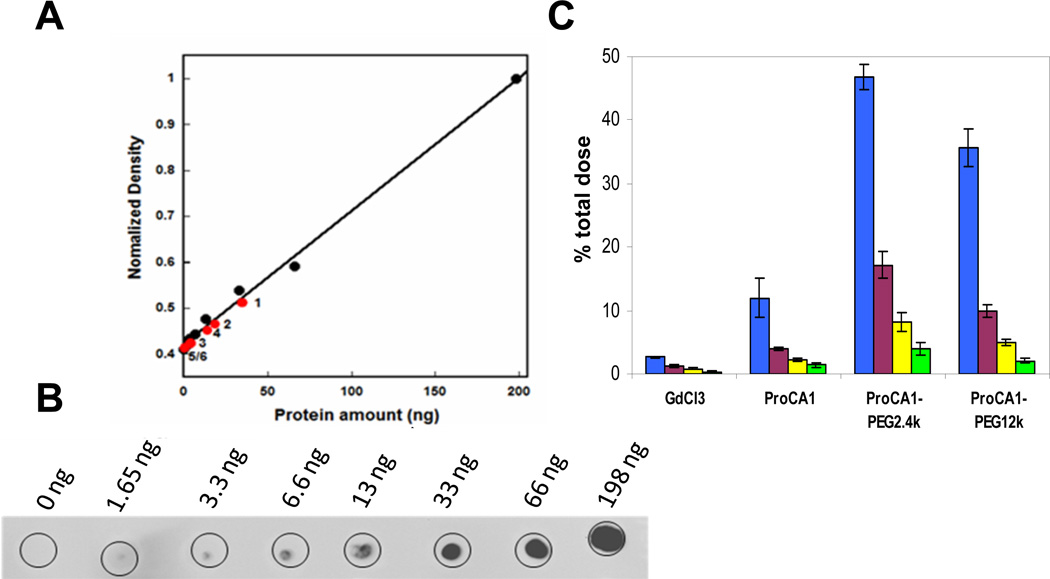
The effect of PEGylation on blood retention of ProCA1 and its PEGylated variants in mice was examined by immunochemical assays (Fig. 5A) and radioisotopic labelling using 153Gd (Fig. 5C). An increase of 7 and 4 times, respectively, for ProCA1.PEG2.4K and ProCA1.PEG0.6K was observed by comparison with non-PEGylated ProCA1 3 h after injection by immunochemical assay (Fig. 5A). PEGylation significantly increased blood retention time compared to Gd-DTPA from under 3 minutes to over 3 hours [25]. The blood retention time also was increased 4 and 3 times, respectively, for ProCA1.PEG2.4K and ProCA1.PEG12K by comparison with native ProCA1 1 h after injection by 153Gd labelling (Fig. 5C). ProCA1-PEG2.4k exhibited the greatest increase in blood retention time.
Fig. 5.
(A) PEGylation increased the mouse in vivo blood retention time of the agents monitored by dot-blotting. Appropriate dosages of Gd-ProCA1-PEG2.4k, Gd-ProCA1-PEG0.6k and Gd-ProCA1 were injected intravenously into the mouse via the tail vein. Blood samples (~50 µL) were collected via orbital sinus at different time points. The content of protein MRI contrast agent in the blood was monitored by dot-blotting. Equal volumes of serum were loaded on the plate and identified by the commercial CD2 polyclonal antibody PabCD2. The amount of the ProCA1-PEG2.4k (1) and ProCA1-PEG0.6k (2) left in blood serum were higher than ProCA1 (3) at 3 h. At 19 h, the amount of ProCA1-PEG2.4k (4) left in blood serum is more than ProCA1-PEG0.6k (5) and ProCA1 (6). (B) Results from control samples with different amounts of ProCA1 show that the longer blood retention time was observed for proteins with higher degree of PEGylation and longer PEG chain modifications. (C) γ-radiation of 153Gd isotope. Accumulation of 153Gd in blood circulation (% of total injected dose) for GdCl3, Gd-ProCA1, Gd-ProCA1-PEG2.4k, and Gd-ProCA1-PEG12k at time points of 1 (blue), 4 (purple), 8 (yellow) and 12 h (green) after injection.
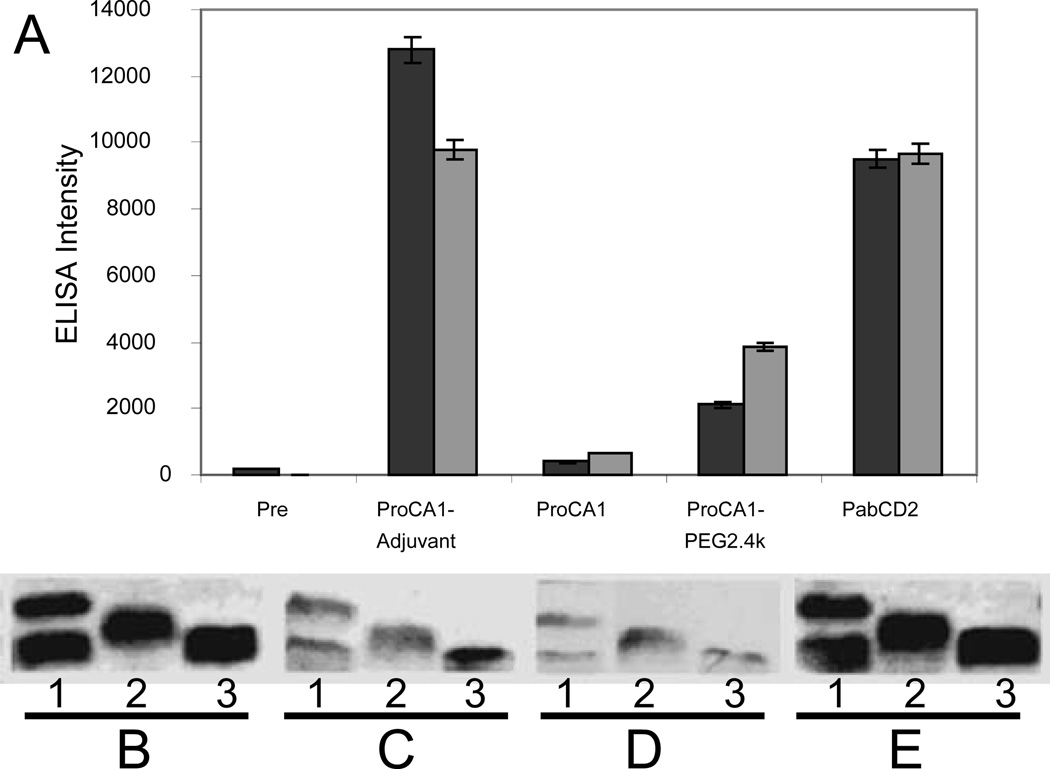
Additionally, PEGylation was found to reduce the immunogenicity. Gd-ProCA1 and its PEGylated variants mixed with or without adjuvant were administered to rabbits intraperitoneally, and the rabbits were subjected to repeated immunizations over a 3-week interval. Blood samples were examined by ELISA and immunoblotting (Fig. 6) using polyclonal antibody PabCD2 as positive control and the pre-bleed as negative control. Although the addition of adjuvant indeed resulted in a strong immunoresponse, it was clear that without adjuvant, injection of ProCA1 did not lead to significant antibody production even after a double dose of immunization, suggesting that the immunogenicity of the ProCA1 is not strong, especially without addition of adjuvant. Additionally, this immunoresponse was dramatically reduced (~80%) by PEGylation with PEG2.4k. This data is consistent with observations for other protein drugs [20].
Fig. 6.
(A) ELISA of antibody produced in rabbit serum before (Pre) and weeks 3 (black) and 6 (grey) after intraperitoneal injection of ProCA1 and ProCA1-PEG2.4k mixed with adjuvant (ProCA1-Adjuvant) or with saline buffer (ProCA1). PabCD2 is the anti-serum from rabbits produced by CD2 (commercial source) as an antigen. PEGylation substantially reduced the immune response monitored by poly-antibodies. Antibody generation against the protein contrast agent (both PEGylated and native protein) in the rabbits was examined by Western Blotting. SDS-PAGE shows ProCA1-PEG2.4k (1), ProCA1-PEG0.6k (2) and ProCA1 (3) detected by anti-serum collected from immunoinoculated rabbits. PabCD2 was used as a positive control (E). The other antiserum was prepared from the blood collected after two subsequent injections of native protein ProCA1 mixed with adjuvant (B). ProCA1 in the absence of adjuvant (C). ProCA1-PEG2.4k mixed in absence of adjuvant (D). The results showe that addition of adjuvant induced stronger immune responses (B). PEGylation modifications of the protein dramatically reduced immune responses in the rabbits (D). Our results suggest that the immunogenecity of the protein contrast agent may not be very strong, especially without addition of adjuvant.
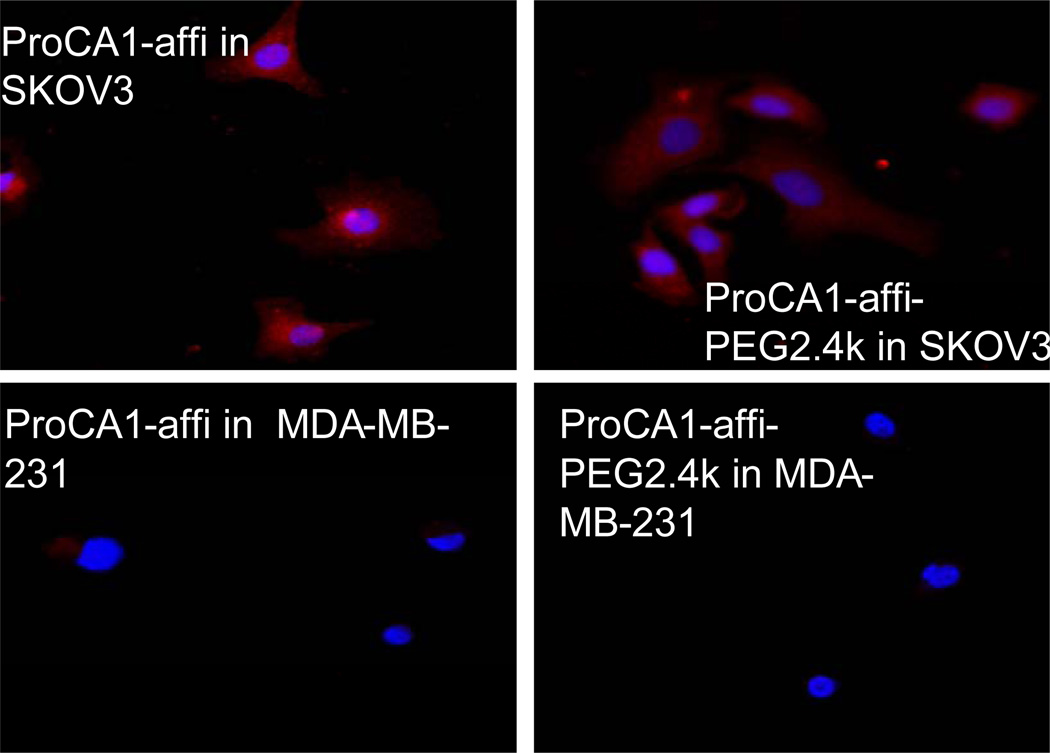
We have also created a targeted contrast agent against the HER2 receptor over expressed in various cancer cells by fusion of a HER2 affibody [29] to the C-terminal of ProCA1 (denoted as ProCA1-affi). Fig. 7 shows that both ProCA1-affi and ProCA1-affi-PEG2.4k have similar capability to specifically bind to SKOV-3 ovarian cancer cells over-expressing HER2 (~3 × 10⁶/cell). On the other hand, they do not bind to MBD-MDA-231 cancer cells with low expression of HER2 (~2.7 × 10³/cell). Therefore, PEGylation does not impede the targeting capability and specificity of ProCA1 reagents, which is important for molecular imaging of biomarkers.
Fig. 7.
Two types of cancer cell lines were stained by ProCA1-affi and ProCA1-affi-PEG2.4k, respectively. SKOV-3 over-expresses HER2 receptor, while MDA-MB-231 does not express HER2. ProCA1-affi or ProCA1-affi-PEG2.4k is shown in red and DAPI for nucleolus is shown in blue.
4. Conclusions
Different from the modest effect (15% increase) reported [11] for a small chelator as contrast agent, here we report the first observation of significantly enhanced relaxivities of protein contrast agents (up to 200%) by PEGylation. PEGylation also increases the blood retention up to 7 times by comparison with native ProCAs 3 h after injection. The results show that PEGylation improves the biomedical properties and pharmacokinetics of our designed protein contrast agents. Understanding the mechanisms for the increased relaxivity by PEGylation may allow us to identify new key factors contributing to the substantial improvement in relaxivities which is a major challenge in the field of molecular and biomarker targeted imaging. PEGylation may be a novel avenue to increasing relaxivity at high field strength to overcome the limitation of current, small Gd3+ chelating contrast agents that suffer reduction of r1 relaxivity under a high magnetic field (Fig. 2). Such improvement can be important to the animal imaging and pre-clinical research under high or ultra-high field where there is an urgent need for molecular imaging probes and optimized contrast agents.
Supplementary Material
Acknowledgments
We would like to thank Dan Adams, and Hing Wong, Yanyi Chen, Yubin Zhou for helpful discussions and suggestions, and Siming Wang for Mass Spectrometry analysis. This work was supported by a grant from National Institutes of Health [EB 007268 and GM 62999 to JJY, GM 063874 and CA120181 to ZRL] and Georgia Cancer Coalition Distinguished Cancer Scholar award to ZRL.
Abbreviations
- MRI
Magnetic resonance image
- Gd-DTPA
Gadolinium-DiethyleneTriaminePentaacetic Acid
- ProCA
Protein based contrast agent
- PEG
polyethylene glycol
- GST
Glutathione S-transferase
- FPLC
Fast Performance Liquid Chromatography
- MALDI-TOF
Matrix-assisted laser desorption/ionization- time of flight
- ELISA
Enzyme-linked immunosorbent assay
- HRP
Horseradish peroxidase
- OPD
Thermo Scientific Pierce
- TR
Repetition time
- TE
Echo time
- ALP
alkaline phosphatase
Footnotes
Publisher's Disclaimer: This is a PDF file of an unedited manuscript that has been accepted for publication. As a service to our customers we are providing this early version of the manuscript. The manuscript will undergo copyediting, typesetting, and review of the resulting proof before it is published in its final citable form. Please note that during the production process errors may be discovered which could affect the content, and all legal disclaimers that apply to the journal pertain.
Supplementary data:
Supplementary data include protein PEGylation (Fig. S1), FPLC purification (Fig. S2); MS identification (Fig. S3); measurement of water coordination number (Fig. S4); and MR images of mouse injected with Gd-DTPA at 7 T (Fig. S5). Supplementary data associated with this article can be found in the online version.
References
- 1.Bogdanov AA, Lewin M, Weissleder R. Adv Drug Deliv Rev. 1999;vol. 37:279–293. doi: 10.1016/s0169-409x(98)00098-2. [DOI] [PubMed] [Google Scholar]
- 2.Zhao M, Beauregard DA, Loizou L, Davletov B, Brindle KM. Nat Med. 2001;vol. 7:1241–1244. doi: 10.1038/nm1101-1241. [DOI] [PubMed] [Google Scholar]
- 3.Eldredge HB, Spiller M, Chasse JM, Greenwood MT, Caravan P. Invest Radiol. 2006;vol. 41:229–243. doi: 10.1097/01.rli.0000199293.86956.48. [DOI] [PubMed] [Google Scholar]
- 4.Caravan P. Acc Chem Res. 2009;vol. 42:851–862. doi: 10.1021/ar800220p. [DOI] [PubMed] [Google Scholar]
- 5.Werner EJ, Datta A, Jocher CJ, Raymond KN. Angew Chem. 2008;vol. 47:8568–8580. doi: 10.1002/anie.200800212. [DOI] [PubMed] [Google Scholar]
- 6.Artemov D. J Cell Biochem. 2003;vol. 90:518–524. doi: 10.1002/jcb.10660. [DOI] [PubMed] [Google Scholar]
- 7.Cheng LL, Chang IW, Louis DN, Gonzalez RG. Cancer Res. 1998;vol. 58:1825–1832. [PubMed] [Google Scholar]
- 8.Partridge SC, Gibbs JE, Lu Y, Esserman LJ, Sudilovsky D, Hylton NM. AJR Am J Roentgenol. 2002;vol. 179:1193–1199. doi: 10.2214/ajr.179.5.1791193. [DOI] [PubMed] [Google Scholar]
- 9.Kim YR, Savellano MD, Weissleder R, Bogdanov A., Jr Technol Cancer Res Treat. 2002;vol. 1:489–495. doi: 10.1177/153303460200100609. [DOI] [PubMed] [Google Scholar]
- 10.Raghunand N, Howison C, Sherry AD, Zhang S, Gillies RJ. Magn Reson Med. 2003;vol. 49:249–257. doi: 10.1002/mrm.10347. [DOI] [PubMed] [Google Scholar]
- 11.Caravan P, Ellison JJ, McMurry TJ, Lauffer RB. Chem Rev. 1999;vol. 99:2293–2352. doi: 10.1021/cr980440x. [DOI] [PubMed] [Google Scholar]
- 12.Sherry AD, Woods M. Annu Rev Biomed Eng. 2008;vol. 10:391–411. doi: 10.1146/annurev.bioeng.9.060906.151929. [DOI] [PMC free article] [PubMed] [Google Scholar]
- 13.Choyke PL, Austin HA, Frank JA, Girton ME, Diggs RL, Dwyer AJ, Miller L, Nussenblatt R, McFarland H, Simon T. Kidney Int. 1992;vol. 41:1595–1598. doi: 10.1038/ki.1992.230. [DOI] [PubMed] [Google Scholar]
- 14.Tweedle MF. Acc Chem Res. 2009;vol. 42:958–968. doi: 10.1021/ar800215p. [DOI] [PubMed] [Google Scholar]
- 15.Lauffer RB, Parmelee DJ, Dunham SU, Ouellet HS, Dolan RP, Witte S, McMurry TJ, Walovitch RC. Radiology. 1998;vol. 207:529–538. doi: 10.1148/radiology.207.2.9577506. [DOI] [PubMed] [Google Scholar]
- 16.Caravan P, Parigi G, Chasse JM, Cloutier NJ, Ellison JJ, Lauffer RB, Luchinat C, McDermid SA, Spiller M, McMurry TJ. Inorg Chem. 2007;vol. 46:6632–6639. doi: 10.1021/ic700686k. [DOI] [PubMed] [Google Scholar]
- 17.Yang JJ, Yang J, Wei L, Zurkiya O, Yang W, Li S, Zou J, Zhou Y, Maniccia AL, Mao H, Zhao F, Malchow R, Zhao S, Johnson J, Hu X, Krogstad E, Liu ZR. J Am Chem Soc. 2008;vol. 130:9260–9267. doi: 10.1021/ja800736h. [DOI] [PMC free article] [PubMed] [Google Scholar]
- 18.Abuchowski A, McCoy JR, Palczuk NC, van Es T, Davis FF. J Biol Chem. 1977;vol. 252:3582–3586. [PubMed] [Google Scholar]
- 19.Veronese FM. Biomaterials. 2001;vol. 22:405–417. doi: 10.1016/s0142-9612(00)00193-9. [DOI] [PubMed] [Google Scholar]
- 20.Harris JM, Chess RB. Nat Rev Drug Discov. 2003;vol. 2:214–221. doi: 10.1038/nrd1033. [DOI] [PubMed] [Google Scholar]
- 21.Veronese FM, Pasut G. Drug Discov Today. 2005;vol. 10:1451–1458. doi: 10.1016/S1359-6446(05)03575-0. [DOI] [PubMed] [Google Scholar]
- 22.Merbach AE, Toth E, editors. John Wiley & Sons; 2001. [Google Scholar]
- 23.Caravan P. Chem Soc Rev. 2006;vol. 35:512–523. doi: 10.1039/b510982p. [DOI] [PubMed] [Google Scholar]
- 24.Flacke S, Fischer S, Scott MJ, Fuhrhop RJ, Allen JS, McLean M, Winter P, Sicard GA, Gaffney PJ, Wickline SA, Lanza GM. Circulation. 2001;vol. 104:1280–1285. doi: 10.1161/hc3601.094303. [DOI] [PubMed] [Google Scholar]
- 25.Joffe P, Thomsen HS, Meusel M. Acad Radiol. 1998;vol. 5:491–502. doi: 10.1016/s1076-6332(98)80191-8. [DOI] [PubMed] [Google Scholar]
- 26.Page MJ, Di Cera E. Physiol Rev. 2006;vol. 86:1049–1092. doi: 10.1152/physrev.00008.2006. [DOI] [PubMed] [Google Scholar]
- 27.Cole K, Kohn E. Cancer Metastasis Rev. 1994;vol. 13:31–44. doi: 10.1007/BF00690417. [DOI] [PubMed] [Google Scholar]
- 28.Carafoli E. Proc Natl Acad Sci U S A. 2002;vol. 99:1115–1122. doi: 10.1073/pnas.032427999. [DOI] [PMC free article] [PubMed] [Google Scholar]
- 29.Qiao J, Li S, Wei L, Jiang J, Long R, Mao H, Wang L, Yang H, Grossniklaus HE, Liu ZR, Yang JJ. PLoS One. 2011;vol. 6:e18103. doi: 10.1371/journal.pone.0018103. [DOI] [PMC free article] [PubMed] [Google Scholar]
- 30.Chang CA, Brittain HG, Telser J, Tweedle MF. Inorg. Chem. 1990;vol. 29:4468–4473. [Google Scholar]
Associated Data
This section collects any data citations, data availability statements, or supplementary materials included in this article.


