Abstract
Purpose
To automatically differentiate radiation necrosis from recurrent tumor at high spatial resolution using multi-parametric MRI features.
Materials and Methods
MRI data retrieved from 31 patients (15 recurrent tumor and 16 radiation necrosis) who underwent chemoradiation therapy after surgical resection included post-Gd T1, T2, FLAIR, PD, ADC and PWI derived rCBV, rCBF and MTT maps. After alignment to post contrast T1WI, an 8-dimensional feature vector was constructed. An OC-SVMs classifier was trained using a radiation necrosis training set. Classifier parameters were optimized based on the area under ROC curve. The classifier was then tested on the full dataset.
Results
The sensitivity and specificity of optimized classifier for pseudoprogression was 89.91% and 93.72% respectively. The area under ROC curve was 0.9439. The distribution of voxels classified as radiation necrosis was supported by the clinical interpretation of followup scans for both non-progressing and progressing test cases. The ADC map derived from DWI and rCBV, rCBF derived from PWI were found to make a greater contribution to the discrimination than the conventional images.
Conclusion
Machine learning using multi-parametric MRI features may be a promising approach to identify the distribution of radiation necrosis tissue in resected GBM patients undergoing chemoradiation.
Keywords: GBM, radiation necrosis, tumor recurrence, OC-SVM, PWI, DWI
INTRODUCTION
Differentiating radiation necrosis from tumor recurrence is a critical unsolved problem in therapeutic monitoring of glioblastoma multiforme (GBM) patients undergoing chemoradiation therapy. Standard therapy for GBM includes surgical resection followed by chemoradiation therapy. Unfortunately, chemoradiation induced necrosis and pseudoprogression may present a magnetic resonance imaging (MRI) appearance indistinguishable from tumor recurrence by qualitative interpretation of conventional contrast-enhanced MRI. This significantly complicates therapeutic decision making during followup. A reliable technique to differentiate chemoradiation induced pseudoprogression and necrosis from tumor progression could provide significant benefit.
Both the large endothelial gaps characteristic of GBM neovessels and the endothelial gaps produced by radiation injury to native brain capillaries compromise the blood brain barrier (BBB) (1). Increased leakage of Gadolinium contrast through these gaps results in enhancement of signal intensity on delayed post-Gadolinium T1WI in both pathologies, and increased leakage of small molecules results in vasogenic edema manifesting as hyperintensity on FLAIR and T2WI and mass effect. Furthermore since both GBM recurrence and radiation necrosis/pseudoprogression occur most frequently at the margin of the cavity where the original tumor was resected (2, 3), these entities are frequently indistinguishable by conventional MRI. Many advanced imaging techniques are under investigation in the attempt to distinguish these entities, including dynamic susceptibility contrast (DSC) perfusion weighted imaging (PWI), magnetic resonance spectroscopy (MRS), diffusion-weighted imaging (DWI), diffusion tensor imaging (DTI), and Positron Emission Tomography (PET).
Currently most quantitative MRI research in this area is directed to sampling the imaging data in selected regions of interest (ROIs) and trying to find a threshold for one parameter or a combination of a few parameters that can distinguish radiation necrosis from tumor progression. Some success has been reported using DSC PWI. In the standard analysis, relative cerebral blood volume (rCBV) is normalized to a selected contralateral region of normal appearing white matter (NAWM) to produce a dimensionless ratio referred to as a ‘normalized’ CBV (nCBV). Although the precise nCBV threshold reported varies somewhat with technique, many reports confirm that the detection of nCBV higher than a cutoff of roughly 1.75 is highly sensitive and specific for the presence of high grade glioma (HGG) (4). DWI derived apparent diffusion coefficient (ADC) maps are also under active investigation, with mixed reports of success (5–9). Similarly, in MRS, derived Cho/Cr ratios, Cho/NAA ratios and NAA/Cr ratios may differ between tumor recurrence and radiation necrosis, although the overlap between the two classes is large (10). Despite a long history of literature reporting use of 18-FDG-PET for differentiation of recurrent GBM from radiation necrosis, both published results and clinical experience have been quite mixed (11–15).
Recent literature suggests that improvements in acquisition, post-processing, and quantitation will improve the performance of the advanced MRI based perfusion and diffusion related measures above (16), but will not address an additional fundamental source of error common to all methods: the operator dependence and inter-observer variation intrinsic to ROI based “hot spot” strategies (5, 6, 11, 12, 15), in which ROIs were manually defined according to individual judgments and then used in further analysis. In addition, the intrinsic heterogeneity of GBM physiology and the frequent coexistence of tumor recurrence and radiation injury present significant challenges (17). Histopathologically, at least four important tissue types may be present within an irradiated glioma specimen: “inactive” neoplasm, radiation necrosis, parenchymal gliosis, and recurrent tumor (18). While inactive tumor may have a quite invariable appearance, recurrent high grade glioma is generally associated with a combination of varying degrees of hypercellularity, hypervascularity, hypermetabolism and rapid growth (17, 18). In this context, averaging voxels within a ROI (usually more than 20 voxels) may mask the intrinsic heterogeneity of the lesion and reduces the chance to distinguish radiation necrosis from recurrent tumor at high spatial resolution. To address these limitations, we have designed an operator independent, automated, whole brain analytic method using combined MRI tumor enhancement, edema, cellularity and perfusion data to produce a voxel by voxel classification of tissue in the brains of patients undergoing followup during chemoradiation for GBM.
Prior studies have suggested that combining information from multiple imaging modalities can help characterize tumor recurrence and radiation necrosis (19–22). But for multi-parametric studies, the amount of data can be overwhelming even for expert readers, and conventional qualitative image interpretation may lead to inconsistent diagnostic precision. In recent years artificial intelligence and machine learning methods have been proven useful for diagnostic decision making problems in high dimensional feature space (23, 24). Support vector machine (SVM) learning is based on structural risk minimization (SRM) rather than the traditional empirical minimization (ERM) principle. The use of SRM makes SVM approaches more generalizable than ERM (25). Traditional SVM algorithms aim at binary classification and are trained using both positive and negative samples. However, it is very difficult to label all the tumor voxels in our population due to the intrinsic heterogeneity of recurrent tumor under irradiation, even with long term followup, our application requires a method that could be trained using only samples demonstrated to represent radiation necrosis. To meet this requirement, we adopted the one-class SVM (OC-SVM) method proposed by Schölkopf et al. to adapt the SVM methodology to a one-class classification problem (26). The parameters in training were optimized using a receiver operating characteristic (ROC) analysis (27). ROC analysis was selected because it is an effective way to visualize, organize and select classifiers based on their performance and has been widely used in medical decision-making for learning in the presence of unbalanced training samples (27). The area under the ROC curve (AUROC) was selected as a simple but consistent measurement of the overall performance of the classifier (28). This OC-SVM method was applied to automatically identify voxels likely to represent radiation necrosis within the multi-parametric MRI datasets described above, with the goal of improving spatial resolution, reproducibility, practicality and confidence analysis compared to single parameter ROI and qualitative analyses.
The main contribution of the paper is providing an automatic approach to identify radiation necrosis at high spatial resolution based on a machine learning classifier that was trained from multiple parametric MR features using only positive (radiation necrosis) training samples, while avoiding the difficulties in the collection of negative (recurrent tumor) training samples in GBM patients undergoing radiation therapy after surgical resection.
MATERIIALS AND METHODS
Data Acquisition and Preprocessing
MRI and clinical data from 31 GBM patients who had undergone radiation therapy after surgical resection were retrieved from institutional databases (Brigham and Women’s Hospital, Boston, MA) with approval from the applicable institutional research boards. These patients included 16 with confirmed radiation necrosis and 15 with recurrent tumor. Both tumor recurrence and radiation necrosis were confirmed by inspection of clinical MRI scans acquired every 2–3 months during followup. Enhancing regions that remained stable or decreased in size were categorized as radiation necrosis while those significantly increased in size were categorized as recurrent tumor.
The MR images were acquired with a standard institutional protocol including gadolinium contrast enhanced delayed T1WI (TR/TE=415/20ms, FOV 210×210mm2, voxel size 0.82×0.82×6mm3), T2WI (TR/TE=3300/100ms, FOV 210×210mm2, voxel size 0.41×0.41×6mm3), FLAIR (TR/TE/TI=8000/130/2000ms, FOV 210×210mm2, voxel size 0.41×0.41×6mm3), PDWI (TR/TE=2560/30ms, FOV 210×210mm2, voxel size 0.41×0.41×6mm3), DWI (TR/TE=10000/60ms, FOV 240×240mm2, voxel size 0.94×0.94×5mm3). Spin echo (TR/TE=1900/80ms, FOV 300×300mm2, voxel size 1.17.×1.17×10mm3) EPI DSC perfusion imaging was obtained during the bolus infusion of Gadolinium contrast at 4cc/second. Apparent diffusion coefficient (ADC) maps were created from the DWI. Relative cerebral blood volume (rCBV), relative cerebral blood flow (rCBF) and mean transit time (MTT) maps were produced using previously published least absolute deviation (LAD) method (29).
All images were resampled to a uniform 1×1×5mm3 voxel size to compensate for different acquisition resolution, and then aligned to the T1WI using a rigid body transformation with 9 degrees of freedom (3 for transition, 3 for angular rotation and 3 for scale) using FLIRT (Oxford FSL tools; http://www.fmrib.ox.ac.uk/fsl/). Because the low SNR of the high b-value images makes it difficult to register DWI and ADC maps directly to T1WI, the higher SNR T2WI obtained with b=0 sec/mm2 was aligned to T1WI and the deformation matrix was used to transform the ADC map into T1WI space. The deformation matrix used to align the perfusion data to the T1WI at the first time point was preserved and used to deform the rCBF, rCBV, and MTT maps into the T1WI space.
Training of OC-SVM Classifier
The feature vector used for classification consists of 8 parameters derived from the multiple MR sequences, including contrast enhanced T1, T2, FLAIR, PD, ADC, rCBF, rCBV and MTT. The feature vector for each voxel was generated by normalizing the voxel intensity in the image by the mean value measure in an ROI placed in the contralateral NAWM on the same map, except for MTT. The feature derived from the MTT map was normalized by subtracting the NAWM ROI MTT from the MTT in each voxel.
The radius bases function (RBF) was selected for use as a kernel function because of its suitability for nonlinear mapping, few parameters and low numerical difficulty (30). The only two parameters under optimization were gamma (width of RBF) and ν (fraction of outliers in training samples). Gamma controls the shape of the decision hyper-plane. A larger gamma results in a more convoluted hyper-plane with better training accuracy but degraded generalizability. Conversely a smaller gamma leads to a smoother hyper-plane with relatively lower training accuracy but better generalizability. ν controls the fraction of outliers in the training samples. For a given gamma a larger ν results in a “conservative” classification strategy producing fewer false positives at the expense of a lower true positive rate. A lower ν results in a “liberal” classifier producing a high true positive rate but with more false positives (26). For our application, the gamma and ν which maximize AUROC for a well-selected test sample set was considered optimal when gamma is searched along 1, 2 …, 29, 30 and ν searched along series 0.02, 0.04, …, 0.6. After optimization of gamma and ν, the tangent point between line y=kx+b and the ROC curve on ROC plane was selected as the optimal classifier. Simultaneously, an optimal threshold T was determined to generate the discrete classifier. k=1 was used in our application with the assumption of equal misclassification cost between false positive and false negative. Various k correspond to cost sensitive classifiers, which will be discussed in section 4 with details.
For 8 patients with confirmed radiation necrosis, the enhancing lesions were manually segmented on post-gadolinium T1WI. Each voxel in the segmented lesion could be potentially considered to be one training sample assuming spatial independence in multi-parametric space. In our application, 2000 voxels were randomly selected from those lesions to generate the training set.
Both the 8 patients with confirmed radiation necrosis mentioned above and 7 cases with confirmed recurrent glioma were used to generate the dataset for parameter optimization. The dataset was prepared as follows: (1) Radiation necrosis voxels were randomly selected from the segmented stable or decreasing size enhancing lesions never presented in the training samples; (2) Normal voxels were selected manually in the normal appearing gray matter, white matter, CSF and ventricles in all cases; (3) Recurrent tumor voxels were selected from the 8 cases with confirmed recurrent glioma by (a) filtering the segmented lesions using a “liberal” OC-SVM classifier with gamma=5 and ν=0.001 to identify radiation necrosis voxels, (b) removing identified radiation necrosis voxels from the subset, and (c) selecting a random sample of the remaining enhancing voxels within the segmented recurrent tumor; (4) Voxels from the three groups (enhancing radiation necrosis, non-enhancing normal voxels and enhancing recurrent tumor voxels were equally intermixed to create the dataset used for parameter optimization. The dataset totally contained 6000 voxels.
Testing of Trained OC-SVM Classifier
The percentage of necrotic voxels was defined as the ratio of the number of necrotic voxels identified by the classifier to the total number of abnormal enhancing voxels in the cases being tested. A two-group comparison was performed between 8 subjects from progressing group and 8 from non-progressing group that were not used in the training stage to test the hypothesis that cases of confirmed radiation necrosis would have significantly more voxels identified as radiation necrosis than cases of recurrent glioma. For each case, the region of abnormal enhancement was manually segmented on post gadolinium T1WI, the trained classifier was used to indentify radiation necrosis voxels within the segmented abnormality, and the percentage of necrotic voxels was computed.
RESULTS
As described in section 2, parameters were optimized by means of “grid search”. Maximum AUROC=0.9439 was obtained when gamma=5 and ν=0.06. An optimal classifier was obtained with threshold T=−0.12. The sensitivity and specificity of the selected classifier was 89.91% and 93.72%, respectively. Figure 1 plots the AUROC trajectory with varying gamma and ν. Each point on the trajectory represents the AUROC for a given parameter-pair gamma and ν. The sub-curve in each grid consisting of 30 points corresponds to a certain gamma while varying ν from 0.02 to 0.6 with the increment of 0.02. The optimal parameter set is depicted in the highlighted rectangle. Increasing gamma improved the classification results up to threshold of 5 above which the performance of the classifier did not improve further, suggesting that the classifier was quite robust (31).
Figure 1.
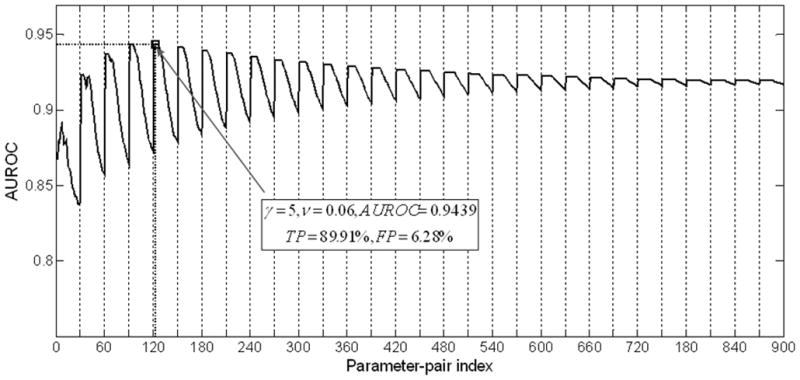
Impacts of parameters of Gamma and ν on AUROCs. Each point on the trajectory represents the AUROC for a given parameter-pair gamma and ν. The sub-curve in each grid consisting of 30 points corresponds to a certain gamma while varying ν from 0.02 to 0.6 with the increment of 0.02. Optimal classifier (Gamma=5, ν=0.06) was highlighted with rectangle.
The generalizability of the optimized parameter set was tested using 5 groups of test samples. The mean and standard division of AUROC for these 5 ROCs curves was 0.9386±0.007. Vertical averaged (32) and threshold averaged (27) ROC curves plotted in Figure 2 demonstrate a high degree of consistency supporting the generalizability of the parameters.
Figure 2.
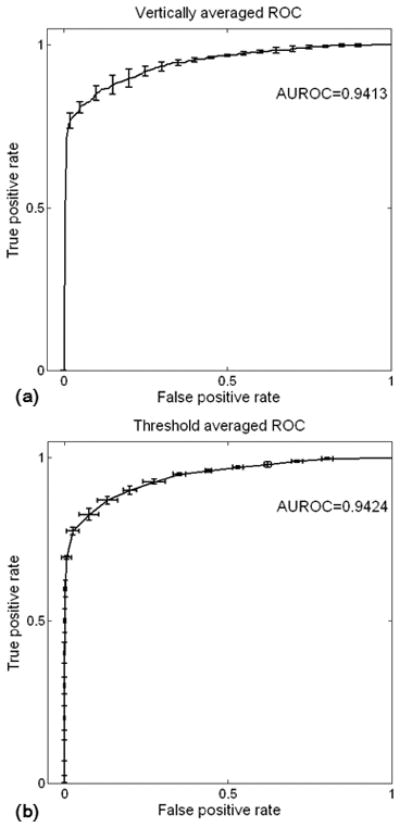
Averaged ROC curve as well as error bar for 5 test datasets. (a) ROC curve averaged vertically and (b) averaged by threshold. Consistency of ROCs revealed high generalization ability of trained classifier.
ROC curves for each element of the 8-dimensional feature vector are plotted in Figure 3. Classification using T1, PD or T2 alone allowed discrimination only slightly better than chance as indicated in Figure 3(a), (c) and (d). Radiation necrosis was characterized by a lower intensity on FLAIR images but the difference was not significant (AUROC=0.66). Perfusion and diffusion parameters made a much greater contribution. Radiation necrosis had a significantly higher normalized ADC (nADC), lower nCBV, lower nCBF, and shorter MTT than recurrent tumor. The difference between tumor and necrosis nADC values was significant but not as large as the difference in nCBV and nCBF. In all subjects, the mean nADC of randomly selected voxels within the region identified as necrosis (INR) (nADC: 2.34±0.70) was significantly higher (p=0.034) than for randomly selected voxels from the region identified as non-necrosis (non-INR) (nADC: 1.56±0.23). The AUROC (Figure 3(h)) was 0.86, implying a significant difference. An optimal sensitivity of 82.04% and specificity of 82.44% were achieved for nADC with the threshold of 1.71. Similarly, nCBV of a random sampling of INR voxels (0.74±0.52) was significantly lower (p=0.016) than that of non-INR voxels (1.69±0.54). An optimal sensitivity of 0.8766 and specificity of 0.9102 was achieved using nCBV with a threshold of 1.14. nCBF of the same random sample was also lower (p=0.027) for INR (0.76±0.58) than non-INR (1.55±0.56) voxels. For nCBF, an optimal sensitivity of 0.8906 and specificity of 0.8437 was achieved with a threshold of 0.98.
Figure 3.
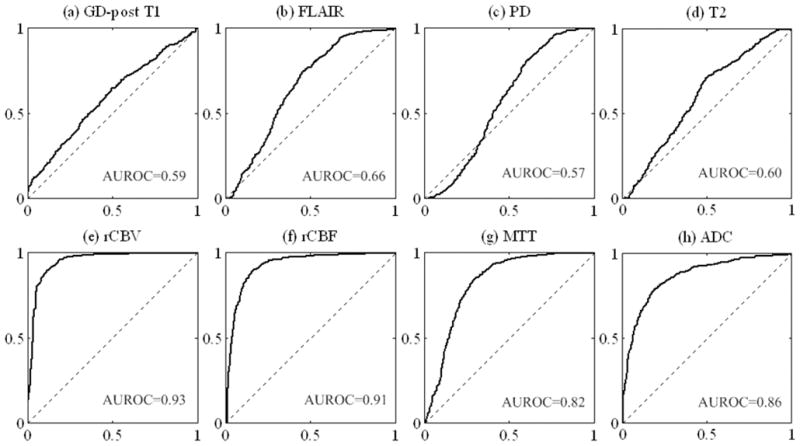
ROC curves as well as AUROC for each feature.
Representative cases of non-progression (Figure 4) and progression (Figure 5) illustrate the higher percentage and greater confluence of voxels of identified necrosis in cases of non-progression compared with progression. The identified voxels of necrosis are overlaid on a single section from each of the sequences used in feature construction. This qualitative observation was supported by quantitative analysis demonstrating that the percentage of identified necrosis voxels in the non-progression group (91.2%±6.3%, n=8) was significantly higher (p<0.01) than that of the progression group (31.6%±27.4%, n=8).
Figure 4.
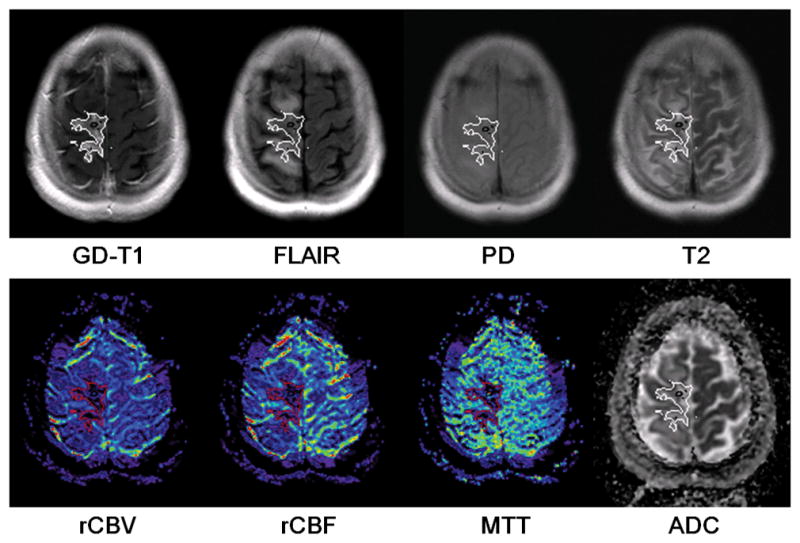
The distribution of identified radiation necrosis voxels in a non-progressing case. The outlines of identified necrosis regions were overlaid on each feature map.
Figure 5.
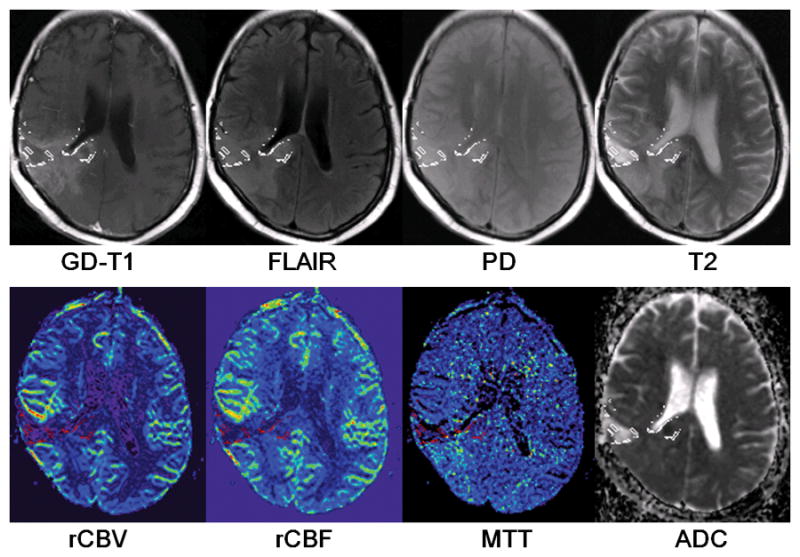
The distribution of identified radiation necrosis voxels in a progressive case. The outlines of identified necrosis regions were overlaid on each feature map.
DISCUSSION
We present a novel method for analyzing data from multi-parametric brain tumor MRI. A machine learning algorithm was developed to train an automated classifier for identification of voxels of radiation necrosis in GBM patients undergoing radiotherapy. This method produces a more detailed depiction of necrosis than is possible using conventional hot spot methods, an advantage that may be useful for treatment planning. Because the method is fully automatic, except for selection of a reference ROI in contralateral NAWM, it may also reduce the operator dependence and image processing time associated with multi-parametric MRI interpretation.
Brain neoplasms classification based on machine learning from multiparametric MR images has received increasing interests recently. The work that relates to our studies the most is the method of multiparametric tissue characterization of brain neoplasms using pattern classification proposed by Varma et al. (22). In their studies, features extracted from multiple MR images were used to train Bayesian classifiers and SVM classifiers for intrapatient and interpatient tissue classification, respectively. The training samples selection was based on the manual delineations of individual tissue groups using the FLAIR and GAD-T1 images from patients with newly diagnosed primary high-grade neoplasms who have not received any therapy before imaging. However, as mentioned previously, it is practically difficult to isolate recurrent tumor using any MRI data at high spatial resolution due to the intrinsic heterogeneity of GBM, the frequent coexistence of tumor recurrence and radiation injury in GBM patients undergoing radiation therapy, as well as the small size of the lesions after tumor resections. And consequently, the training samples for recurrent tumor are not available. Hence, we adopted an OC-SVM algorithm, which essentially estimates the probability distribution of the class represented by the training samples, to train the classifier using only samples of radiation necrosis for the identification of radiation necrotic voxels.
The trained classifier proved quite robust in training stage and yielded a consistently high AUROC, suggesting that a high reproducibility may be achievable in clinical practice. Moreover, the results supported the quantitative and qualitative test hypotheses that non-progressing cases would have a higher percentage of necrotic voxels in a more confluent pattern than progressing cases. While these preliminary measures do not constitute true validation of the classifier output, they are consistent with an appropriate classification, at least in the limited test dataset and indicate that further testing and validation is warranted.
The comparison of the relative contribution of each datatype to the overall classifier was both interesting and encouraging. It supports recent neuro-oncologic imaging literature suggesting the significantly greater value of advanced MRI DWI and PWI derived measures as compared to conventional imaging for discrimination of radiation necrosis from viable tumor (16). Figure 3 depicts the individual ROC curves associated with each data type. The curves in subplots (a) through (d) (AUROC range 0.59 to 0.66) illustrate that voxel by voxel discrimination of radiation necrosis from recurrent tumor using conventional MRI features, although slightly better than chance, is not good enough to comprise an optimal diagnostic test. This result is consistent with clinical experience and prior literature substantiating that expert interpretation of conventional MRI relies heavily on prior knowledge of the pattern of abnormality rather than the features of individual voxels (33–35). While such expert qualitative interpretation can be expected to perform better than the individual voxel-by-voxel ROC curves and is the current standard of care, it is highly operator dependent and does not permit confident distinction of necrosis from viable tumor on a voxel by voxel basis. The latter is of paramount importance in follow-up of patients with treated GBM because almost all patients have a combination of necrotic and non-necrotic voxels, and distinction of the location of each is important for planning adjunctive radiosurgery, re-resection, and other ablative therapy. ROC curves in figures 3(e), 3(f), and 3(g) illustrate that normalized ratios derived from DSC PWI perform substantially better than conventional MRI. This is consistent with a growing literature documenting that DSC PWI is very sensitive to the presence of GBM neovessels, a distinctive histopathologic feature of viable high grade glioma (36–38).
The reason that nCBV, the most well-studied PWI hemodynamic parameter in clinical brain tumor imaging, outperforms conventional contrast enhanced imaging for differentiating tissue radiation injury from tumor recurrence is likely related to the known physiology of brain tumor. Conventional delayed contrast enhanced imaging depicts a combination of both the local blood volume and the local vascular permeability. Thus, because both high grade glioma neovessels in viable tumor and radiation injured native brain capillaries or neovessels in regions of radiation necrosis have a high vascular permeability to gadolinium contrast, they enhance avidly and are largely indistinguishably on delayed post contrast T1WI. In contrast, DSC PWI derived nCBV, when appropriately post-processed and leakage corrected, is less influenced by local permeability effects. This allows detection of high nCBV within the subset of contrast enhancing voxels containing viable tumor neocapillaries, and distinction of these voxels from low nCBV voxels that enhance due to focal capillary necrosis. Thus, our findings are consistent with the prior literature in suggesting that ROI studies of radiation necrosis have a significantly lower nCBV than viable tumor and with histopathology reports of coagulative necrosis and thrombosis of small vessels in radiation necrosis (4, 38).
nCBF and MTT have not been explored as fully as nCBV in oncologic imaging despite their widespread application in stroke studies, but our findings that the AUROC for nCBF (0.91) is almost as high as nCBV (0.93) is consistent with one report of spin-echo EPI perfusion study for tumor grading (39). Likely because of their high tortuosity, high grade glioma neovessels, have a longer MTT than NAWM (38), which unfortunately overlaps with, the MTT of radiation necrosis which is also longer than NAWM (38). This physiologic overlap and the possibility that nCBV underestimation in areas of necrosis leads to an artifactual low MTT likely accounts for poorer performance of MTT (AUROC: 0.82) in our analysis.
The finding that randomly sampled radiation necrosis voxels from our study had a higher ADC than non-necrosis voxels is consistent with a decrease in membrane associated and intracellular water in areas of necrosis. The AUROC of 0.86 for ADC is significantly higher than the AUROC for conventional MRI measures, suggesting a significantly greater contribution to discrimination of necrosis than conventional MRI, although slightly lower than the perfusion derived maps. While the primary determinate of diffusivity in the brain is the cell volume fraction, this is not a simple measure of histologic tissue cellularity (8). Although in general, areas of necrosis have a lower cell density than viable tumor, at least two potentially confounding pathophysiologic processes overlap with histological cell density in treated brain tumor patients to complicate the relationship between ADC and true tissue cellularity. These processes include the prominent vasogenic edema induced by viable tumor that tends to increase ADC in tumor, and ischemic cell swelling in areas of radiation necrosis that tends to decrease ADC in necrotic areas. While an investigation of these factors is beyond the scope of this study, they seem likely to contribute to the slightly lower value of ADC in discrimination of necrosis compared with DSC PWI.
In summary, our results are consistent with recent brain tumor imaging literature in suggesting that DWI and PWI derived advanced physiological MRI measure of brain tumor vascularity and cellularity allow significantly better discrimination of radiation necrosis from viable brain tumor than conventional MRI. Since the DWI, PWI and conventional MRI measures can be assumed to be largely independent, we chose to incorporate all these measures into our discriminator. SVM requires selection of a single threshold to generate a discrete classifier, in the interest of simplicity, we chose the line y=x+b tangent to the ROC curve on the ROC plane. This should produce an optimal classifier for the assumption of equal misclassification cost for false positive classification of non-necrotic tissue as necrosis and false negative classification of necrotic tissue as tumor. In clinical situations in which the cost of false negatives outweigh those of false positives (for example easily resectable areas of possible recurrent tumor), or the converse situation where the clinical cost of false positive outweighs those of false negatives (for example possible resectable tumor near to eloquent cortex), this can be supplanted by a more accurate but more complicated cost-sensitive classifier selection method. One such method, the ROC Convex Hull (ROCCH), is available in many software applications (40). These cost-sensitive classifier methods take unequal misclassification costs into account by selecting the line y=kx+b tangent to the ROCCH, where k represents the ratio between costs of false positives and false negatives. Since k can be adjusted for each individual patients and physicians, we illustrate the effect of varying values of k in increments from 0.2 to 5.0 on the classifier selection (Figure 6), and on the rates of sensitivity and specificity of the selected classifier (Figure 7).
Figure 6.
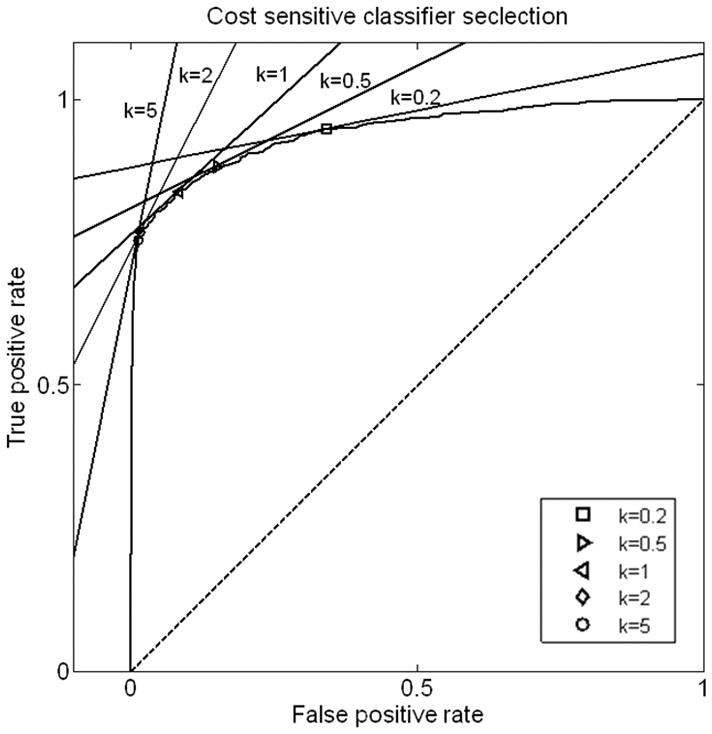
Illustration of cost-sensitive classifier selection. The classifier is defined as the tangent point of y=kx+b and the ROC curve determined by optimized parameters of Gamma and ν.
Figure 7.
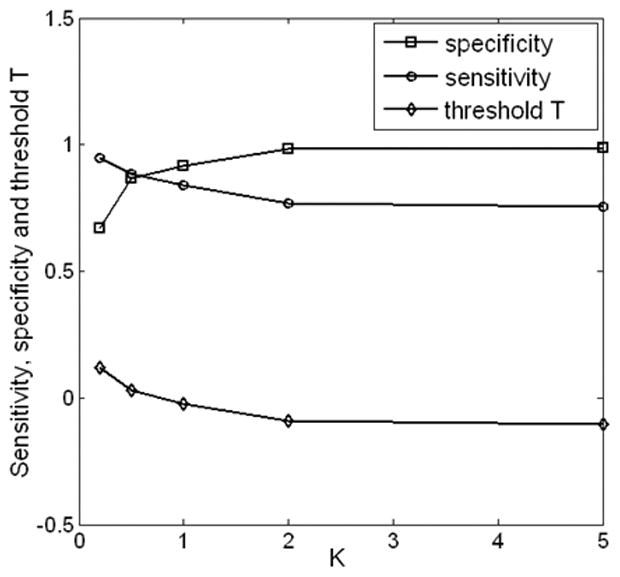
Sensitivity, specificity, and parameter T are plotted as functions of the slope k in cost-sensitive classifier selection. Increase of k indicates that higher cost of false negative is preferred, and the selected classifier has increased specificity and decreased sensitivity.
Figures 4 and 5 illustrate voxel-by-voxel radiation necrosis detection in a longitudinally confirmed case of non-progressing tumor and a case of progressing tumor. As shown in the figures, a confluent area of necrosis occupying the majority of the enhancing region is typical in non-progressing cases and scattered voxels of necrosis distributed sparsely and occupying a minority of the abnormal enhancing region is typical of progressing cases. In our small sample, the former pattern seemed to correlate with non-progression, and the latter with progression. This qualitative observation was supported by quantitative analysis demonstrating that the percentage of identified necrosis voxels in the non-progression group (91.2%±6.3%, n=8) was significantly higher (p<0.01) than that of the progression group (31.6%±27.4%, n=8), as presented in section 3.
The most significant limitation of this study is the lack of strict pathological validation of the classification from surgical specimens. For this reason, we cannot state with certainty whether the voxels identified as ‘radiation necrosis’ or ‘non-progression’ in fact represent pathophysiologic necrosis or treated non-progressing tumor. While voxel by voxel pathologic validation would be required to distinguish these entities, in practice such correlation is very difficult to achieve and may be less clinically important than finding a robust method of distinguishing areas of abnormality that are unlikely to progress rapidly from areas that are likely to progress. For this reason, we used the most widely accepted clinical surrogate marker, growth or resolution of tumor on follow-up MRI, to determine the areas of ‘necrosis’ or ‘non-progression’ used to train the classifier. Another weakness of the study is the relatively small number of cases available for use as training and test samples. While the voxels can be treated individually in training the OC-SVM, different voxels from the same patient are likely to demonstrate similar features and thus the number of independent samples is better regarded as the number of subjects. In the future we hope to include a larger number of subjects in order to increase the confidence with which the classifier can be generalized. Similarly, in order to increase the clinical relevance of the classifier, we plan to include samples of patients with chemoradiation induced pseudoprogression resulting from treatment with XRT and temozolomide, the recently established standard of care in high grade glioma therapy. We also noticed that the inevitable distortion and relatively lower spatial resolution of PWI may cause inaccurate alignments and feature vector construction. As far as the distortion in PWI is concerned, we avoided to select training samples from the edges of the brain where severe image distortion exists. Additionally, algorithms for distortion correction can also provide solutions to this problem in clinical applications. Partial volume effect results in inaccurate feature construction, especially for the images with low spatial resolution such as PWI. The method proposed in this paper potently can benefit from the increasingly improved spatial resolution of the advanced MR images. Finally, it would be interesting to know if our classifier could be improved by including data from PET and MR spectroscopy. While this is theoretically possible, we did not include them in this initial investigation because each of these datatypes is significantly more expensive to obtain and each would result in a much lower spatial resolution classification because the higher resolution MRI data would need to be down resolved to match the resolution of clinical PET (5mm) or the MRS (10mm).
In conclusion, we present a novel machine learning classifier designed to assist in the interpretation of multi-parametric maps derived from brain MRI of patients with high grade glioma undergoing XRT. The advantages of this approach include an increase in diagnostic accuracy, an increase in reproducibility, a decreased dependence on operator expertise and a decrease in operator time input as compared with currently used hot spot ROI based methods. In a small sample of patients, the output of the classifier was robust and supported the test hypothesis that a higher percentage of voxels and a more confluent pattern of necrosis voxels is observed in early MRI of patients subsequently demonstrated to have radiation necrosis than in patients who subsequently developed tumor progression. The component ROC curve analysis is consistent with previous literature suggesting that information in DWI and PWI derived maps can allow significantly superior discrimination of radiation necrosis compared to conventional MRI alone. These findings support the need for additional development and validation using larger and more clinically relevant training and test samples, additional image weightings, and when possible pathological correlation.
Acknowledgments
Grants support: Supported by the funding from NIH G08 LM 008937, John s. Dunn Foundation, and The Ting Tsung and Wei Fong Chao Foundation to S. T. Wong and Institute of Biomedical Imaging Science to K. Wong.
References
- 1.New P. Radiation injury to the nervous system. Curr Opin Neurol. 2001;14:725–734. doi: 10.1097/00019052-200112000-00008. [DOI] [PubMed] [Google Scholar]
- 2.Halperin EC, Burger PC, Bullard DE. The fallacy of the localized supratentorial malignant glioma. Int J Radiat Oncol Biol Phys. 1988;15:505–509. doi: 10.1016/s0360-3016(98)90036-0. [DOI] [PubMed] [Google Scholar]
- 3.Lee SW, Fraass BA, Marsh LH, et al. Patterns of failure following high-dose 3-D conformal radiotherapy for high-grade astrocytomas: a quantitative dosimetric study. Int J Radiat Oncol Biol Phys. 1999;43:79–88. doi: 10.1016/s0360-3016(98)00266-1. [DOI] [PubMed] [Google Scholar]
- 4.Sugahara T, Korogi Y, Tomiguchi S, et al. Posttherapeutic intraaxial brain tumor: the value of perfusion-sensitive contrast-enhanced MR imaging for differentiating tumor recurrence from nonneoplastic contrast-enhancing tissue. AJNR Am J Neuroradiol. 2000;21:901–909. [PMC free article] [PubMed] [Google Scholar]
- 5.Hein PA, Eskey CJ, Dunn JF, Hug EB. Diffusion-weighted imaging in the follow-up of treated high-grade gliomas: tumor recurrence versus radiation injury. AJNR Am J Neuroradiol. 2004;25:201–209. [PMC free article] [PubMed] [Google Scholar]
- 6.Asao C, Korogi Y, Kitajima M, et al. Diffusion-weighted imaging of radiation-induced brain injury for differentiation from tumor recurrence. AJNR Am J Neuroradiol. 2005;26:1455–1460. [PMC free article] [PubMed] [Google Scholar]
- 7.Sundgren PC, Fan X, Weybright P, et al. Differentiation of recurrent brain tumor versus radiation injury using diffusion tensor imaging in patients with new contrast-enhancing lesions. Magn Reson Imaging. 2006;24:1131–1142. doi: 10.1016/j.mri.2006.07.008. [DOI] [PubMed] [Google Scholar]
- 8.Biousse V, Newman NJ, Hunter SB, Hudgins PA. Diffusion weighted imaging in radiation necrosis. J Neurol Neurosurg Psychiatry. 2003;74:382–384. doi: 10.1136/jnnp.74.3.382. [DOI] [PMC free article] [PubMed] [Google Scholar]
- 9.Park SH, Chang KH, Song IC, Kim YJ, Kim SH, Han MH. Diffusion-weighted MRI in cystic or necrotic intracranial lesions. Neuroradiology. 2000;42:716–721. doi: 10.1007/s002340000394. [DOI] [PubMed] [Google Scholar]
- 10.Weybright P, Millis K, Campbell N, Cory DG, Singer S. Gradient, high-resolution, magic angle spinning 1H nuclear magnetic resonance spectroscopy of intact cells. Magn Reson Med. 1998;39:337–345. doi: 10.1002/mrm.1910390302. [DOI] [PubMed] [Google Scholar]
- 11.Langleben DD, Segall GM. PET in differentiation of recurrent brain tumor from radiation injury. J Nucl Med. 2000;41:1861–1867. [PubMed] [Google Scholar]
- 12.Norio Katoh KN, Takei Toshiki, et al. Methionine PET in differentiating recurrent brain tumor from radiation necrosis following cranial radiation. Proceedings of the International Symposium for PET and Molecular Imaging. 2004;1264:217–221. [Google Scholar]
- 13.Wang SX, Boethius J, Ericson K. FDG-PET on irradiated brain tumor: ten years' summary. Acta Radiol. 2006;47:85–90. doi: 10.1080/02841850500335101. [DOI] [PubMed] [Google Scholar]
- 14.Ricci PE, Karis JP, Heiserman JE, Fram EK, Bice AN, Drayer BP. Differentiating recurrent tumor from radiation necrosis: time for re-evaluation of positron emission tomography? AJNR Am J Neuroradiol. 1998;19:407–413. [PMC free article] [PubMed] [Google Scholar]
- 15.Thompson TP, Lunsford LD, Kondziolka D. Distinguishing recurrent tumor and radiation necrosis with positron emission tomography versus stereotactic biopsy. Stereotact Funct Neurosurg. 1999;73:9–14. doi: 10.1159/000029743. [DOI] [PubMed] [Google Scholar]
- 16.Young GS. Advanced MRI of adult brain tumors. Neurol Clin. 2007;25:947–973. viii. doi: 10.1016/j.ncl.2007.07.010. [DOI] [PubMed] [Google Scholar]
- 17.Jung V, Romeike BF, Henn W, et al. Evidence of focal genetic microheterogeneity in glioblastoma multiforme by area-specific CGH on microdissected tumor cells. J Neuropathol Exp Neurol. 1999;58:993–999. doi: 10.1097/00005072-199909000-00009. [DOI] [PubMed] [Google Scholar]
- 18.Kelly PJ, Daumas-Duport C, Scheithauer BW, Kall BA, Kispert DB. Stereotactic histologic correlations of computed tomography- and magnetic resonance imaging-defined abnormalities in patients with glial neoplasms. Mayo Clin Proc. 1987;62:450–459. doi: 10.1016/s0025-6196(12)65470-6. [DOI] [PubMed] [Google Scholar]
- 19.Gupta R, Sinha U, Cloughesy TF, Alger JR. Inverse correlation between choline magnetic resonance spectroscopy signal intensity and the apparent diffusion coefficient in human glioma. Magnetic Resonance in Medecine. 1999;41:2–7. doi: 10.1002/(sici)1522-2594(199901)41:1<2::aid-mrm2>3.0.co;2-y. [DOI] [PubMed] [Google Scholar]
- 20.Yang D, Korogi Y, Sugahara T, et al. Cerebral gliomas: prospective comparison of multivoxel 2D chemical-shift imaging proton MR spectroscopy, echoplanar perfusion and diffusion-weighted MRI. Neuroradiology. 2002;44:656–666. doi: 10.1007/s00234-002-0816-9. [DOI] [PubMed] [Google Scholar]
- 21.McMillan KM, Rogers BP, Koay CG, Laird AR, Price RR, Meyerand ME. An objective method for combining multi-parametric MRI datasets to characterize malignant tumors. Med Phys. 2007;34:1053–1061. doi: 10.1118/1.2558301. [DOI] [PubMed] [Google Scholar]
- 22.Verma R, Zacharaki EI, Ou Y, et al. Multiparametric tissue characterization of brain neoplasms and their recurrence using pattern classification of MR images. Acad Radiol. 2008;15:966–977. doi: 10.1016/j.acra.2008.01.029. [DOI] [PMC free article] [PubMed] [Google Scholar]
- 23.Swets JA, Dawes RM, Monahan J. Better decision through science. Scientific American. 2000;283:82–87. doi: 10.1038/scientificamerican1000-82. [DOI] [PubMed] [Google Scholar]
- 24.Snyder DK. Computer-assisted judgment: defining strengths and liabilities. Psychol Assess. 2000;12:52–60. doi: 10.1037//1040-3590.12.1.52. [DOI] [PubMed] [Google Scholar]
- 25.Cortes C, Vapnik V. Support-vector network. Machine Learning. 1995:273–297. [Google Scholar]
- 26.Scholkopf B, Platt JC, Shawe-Taylor J, Smola AJ, Williamson RC. Estimating the support of a high-dimensional distribution. Report nr 0899–7667. 2001 Jul;:1443–1471. doi: 10.1162/089976601750264965. [DOI] [PubMed] [Google Scholar]
- 27.Fawcett T. An introduction to ROC analysis. Pattern Recognition Letters. 2006:861–874. [Google Scholar]
- 28.Bradley AP. The use of the area under the ROC curve in the evaluation of machine learning algorithms. Pattern Recognition. 1997;30:1145–1159. [Google Scholar]
- 29.Wong KK, Tam CP, Ng M, Wong ST, Young GS. Improved residue function and reduced flow dependence in MR perfusion using least-absolute-deviation regularization. Magn Reson Med. 2009;61:418–428. doi: 10.1002/mrm.21860. [DOI] [PubMed] [Google Scholar]
- 30.Cherkassky V. The nature of statistical learning theory~. IEEE Trans Neural Netw. 1997;8:1564. doi: 10.1109/TNN.1997.641482. [DOI] [PubMed] [Google Scholar]
- 31.Goh KS, Chang EY, Li BT. Using one-class and two-class SVMs for multiclass image annotation. IEEE Transactions on Knowledge and Data Engineering. 2005;17:1333–1346. [Google Scholar]
- 32.Provost F, Fawcett T. Proc AAAI-98. Menlo Park, CA: AAAI Press; 1998. Robust classification system for imprecise environments; pp. 706–713. [Google Scholar]
- 33.Mullins ME, Barest GD, Schaefer PW, Hochberg FH, Gonzalez RG, Lev MH. Radiation necrosis versus glioma recurrence: conventional MR imaging clues to diagnosis. AJNR Am J Neuroradiol. 2005;26:1967–1972. [PMC free article] [PubMed] [Google Scholar]
- 34.Kumar AJ, Leeds NE, Fuller GN, et al. Malignant gliomas: MR imaging spectrum of radiation therapy- and chemotherapy-induced necrosis of the brain after treatment. Radiology. 2000;217:377–384. doi: 10.1148/radiology.217.2.r00nv36377. [DOI] [PubMed] [Google Scholar]
- 35.Dequesada IM, Quisling RG, Yachnis A, Friedman WA. Can standard magnetic resonance imaging reliably distinguish recurrent tumor from radiation necrosis after radiosurgery for brain metastases? A radiographic-pathological study. Neurosurgery. 2008;63:898–903. doi: 10.1227/01.NEU.0000333263.31870.31. [DOI] [PubMed] [Google Scholar]
- 36.Lev MH, Hochberg F. Perfusion Magnetic Resonance Imaging to Assess Brain Tumor Responses to New Therapies. Cancer Control. 1998;5:115–123. doi: 10.1177/107327489800500202. [DOI] [PubMed] [Google Scholar]
- 37.Covarrubias DJ, Rosen BR, Lev MH. Dynamic magnetic resonance perfusion imaging of brain tumors. Oncologist. 2004;9:528–537. doi: 10.1634/theoncologist.9-5-528. [DOI] [PubMed] [Google Scholar]
- 38.Brandsma D, Stalpers L, Taal W, Sminia P, van den Bent MJ. Clinical features, mechanisms, and management of pseudoprogression in malignant gliomas. Lancet Oncol. 2008;9:453–461. doi: 10.1016/S1470-2045(08)70125-6. [DOI] [PubMed] [Google Scholar]
- 39.Aronen HJ, Gazit IE, Louis DN, et al. Cerebral blood volume maps of gliomas: comparison with tumor grade and histologic findings. Radiology. 1994;191:41–51. doi: 10.1148/radiology.191.1.8134596. [DOI] [PubMed] [Google Scholar]
- 40.Fawcett T, Niculescu-Mizil A. PAV and the ROC convex hull. Machine Learning. 2007;68:97–106. [Google Scholar]


