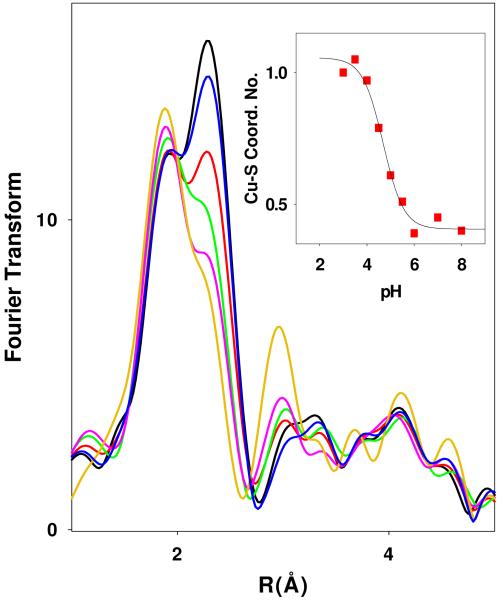
Figure 2.
Fourier transforms of x-ray absorption data for WT PHMcc between pH 3 and pH 8. Spectra correspond to the pHs (from the bottom) 3.5, 4.0, 4.5, 5.0, 5.5, and 7.0. The inset shows the change in the shell occupancy of the Cu-S interaction (simulated using parameters listed in Table S1 of the supporting information) plotted as a function of pH, and simulated using a pKA=4.69.

