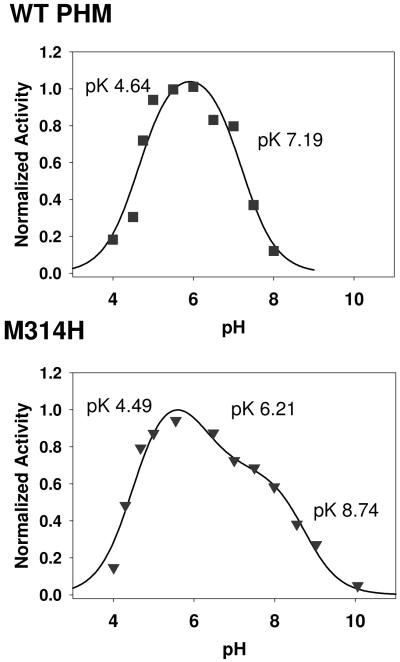
Figure 3.
Normalized activity versus pH profiles for (a) the WT and (b) M314H variant of PHM. Red squares are experimental data, black lines are simulated data. Activity data were measured using an O2 electrode under saturating conditions of dansyl-YVG, ascorbate and atmospheric oxygen. Activity data were normalized for ease of comparison. The data were analyzed as described previously in reference (24), in terms of an inactive species S1 present at low pH which is transformed into the active state S2 (or active states S2 and S3 in the M314H variant) by deprotonantion steps with pKA values as shown.

