

Abstract
Introduction
Procedure length is a fundamental variable associated with quality of care, though seldom studied on a large scale. We sought to estimate procedure length through information obtained in the anesthesia claim submitted to Medicare to validate this method for future studies.
Methods
The Obesity and Surgical Outcomes Study enlisted 47 hospitals located across New York, Texas and Illinois to study patients undergoing hip, knee, colon and thoracotomy procedures. 15,914 charts were abstracted to determine body mass index and initial patient physiology. Included in this abstraction were induction, cut, close and recovery room times. This chart information was merged to Medicare claims which included anesthesia Part B billing information. Correlations between chart times and claim times were analyzed, models developed, and median absolute differences in minutes calculated.
Results
Of the 15,914 eligible patients, there were 14,369 where both chart and claim times were available for analysis. In these 14,369, the Spearman correlation between chart and claim time was 0.94 (95% CI 0.94, 0.95) and the median absolute difference between chart and claim time was only 5 minutes (95% CI: 5.0, 5.5). The anesthesia claim can also be used to estimate surgical procedure length, with only a modest increase in error.
Conclusion
The anesthesia bill found in Medicare claims provides an excellent source of information for studying operative time on a vast scale throughout the United States. However, errors in both chart abstraction and anesthesia claims can occur. Care must be taken in the handling of outliers in this data.
INTRODUCTION
Procedure length is a fundamental variable utilized to describe surgical performance and even quality of care, as it has been shown to be associated with postoperative complications,1-17 and is an integral part of any measurement of efficiency.18-28 In previous research we reported on a method to estimate both anesthesia and surgical procedure length using the anesthesia Medicare claim based on 1,931 high-risk general surgery and orthopedics cases performed during 1995 and 1996 in Pennsylvania. We found that we could achieve an excellent prediction of anesthesia chart time using anesthesia claims data (R2 = 0.89).29 We subsequently utilized the method to estimate procedure times in the 20 most frequent orthopedic and 20 most frequent general surgical procedures in Pennsylvania during that period.30 Other investigators have now used this technique to answer questions regarding procedure length, yet no new validations with large-scale chart abstraction have been attempted.10,31-38
Obtaining the anesthesia chart time from the Medicare claim is not straightforward, as the Medicare variable was not developed with this purpose in mind. As will be described, there is considerable opportunity for the anesthesia claim time to diverge from the chart time for a number of reasons: (1) the anesthesia claims do not always specify the exact surgical procedure associated with that claim, so matching anesthesia procedure to surgical procedure is not simple; (2) there may be mistakes in the claim; (3) there may be mistakes in the chart abstraction; (4) there may be confusion concerning times when more than one anesthesia provider was involved with the same operative case and billed for overlapping time periods (such as a physician and nurse anesthetist billing for the same case as part of the anesthesia team). For all these reasons, the claim derived time may not necessarily be correct. The intent of this paper is to demonstrate that using our proposed algorithm, the Medicare anesthesia claim can be utilized to accurately obtain procedure time information.
In this report we present chart abstraction data on a far larger data set (over 7-fold larger than our previous study), over three different states, across four types of surgery. Our original report, which was based on a case control study of mortality in Pennsylvania, analyzed patients that were uniformly very ill (all cases died within 60 days of admission and controls were matched to these cases based on similar comorbidities and age). The present report, using data that is a decade more recent than the original study, provides an update using a population far more representative of patients undergoing the procedures studied, and utilizes a new and better methodology to estimate procedure length from Medicare claims while providing a more detailed account of the errors in measurement.
Establishing that anesthesia procedure time can be accurately estimated from Medicare claims may facilitate study of both surgical and anesthesia quality throughout the entire Medicare system. It also may aid in studying important clinical questions concerning cumulative anesthesia exposure time and its relationship to outcomes.
MATERIALS AND METHODS
Study Perspective
The aim of this study is to inform researchers and policy analysts about the validity of using anesthesia claims data to determine procedure time when chart data is not available. We take the perspective that we wish to evaluate the proposed claims algorithm using chart data as a “gold” standard. However, we have seen that both claims and charts have errors in measurement and recording. In an ideal world, one could have both claims and charts to inform the presence of errors from either source. For example, chart data may have transcription errors. If a chart time was 5 min for a colectomy, it is likely an error, especially if the claim time was 205 min. Because we wish to evaluate these two measures, in reporting these data we generally do not use chart data to inform or correct claims data, and we do not use claims data to inform or correct chart data, unless specifically stated.
Study Overview
The Obesity and Surgical Outcomes Study (OBSOS) is a study of surgery at 47 hospitals located throughout Illinois, New York, and Texas (appendix 1). Using Medicare claims, patients that underwent one of five types of surgery between 2002 and 2006 were identified in each study hospital: (1) hip replacement or revision excluding fracture (ICD9CM Principal Procedure codes 81.51-81.53); (2) knee replacement or revision (ICDCM Principal Procedure 81.54, 81.55); (3) colectomy for cancer (ICD9CM Principal Procedure codes 45.7-45.79, 45.8) (ICD9CM Principal Diagnosis codes 153-153.9, 154-154.8, 230.3-6); (4) colectomy not for cancer (ICD9CM Principal Procedure 45.7-45.79, 45.8) and (ICD9CM Principal Diagnosis codes 562.1-562.13); and (5) thoracotomy (ICD9CM Principal Procedure codes 32-32.9).
Hospitals were approached by the Oklahoma Foundation for Medical Quality, and requested to abstract between 300 and 400 charts in order to collect baseline information including body mass index, admission vital signs and laboratory tests, and information on the surgical procedure including time of induction, initial surgery, closure, and time to recovery room. All data collected was deidentified and merged with encrypted Medicare files and sent to the study investigators for analysis. Approval was obtained from The Children’s Hospital of Philadelphia Institutional Review Board (IRB) (Philadelphia, Pennsylvania), the IRB associated with the PI of the study, as well as hospital specific IRB approval when requested.
Sources of Error in Time Collection
The fundamental question we seek to answer is whether our algorithm for anesthesia claims data can provide valid anesthesia times. In this study we have the luxury of collecting chart derived anesthesia time to aid in validation. However, even chart derived anesthesia times are not perfect. In a study of this size, there are occasional mistakes in the abstraction of chart information when collecting anesthesia time and these mistakes may contribute to the appearance of mistakes in the claims algorithm. To make sense of these potential errors, we developed definitions for chart and claim derived variables based on an algorithm used by each definition. We define three times:
(a) “Isolated” Chart Time: A chart time cleaned in isolation from the claim time information. Changes in obviously incorrect dates (say off by a year or a month) were corrected using only chart information, not claims information. If times were obviously incorrect (≤ 30 min or ≥ 24 h), these were either fixed with internal information from the chart or, if no time could be determined using only the chart, the chart time was coded as missing.
(b) “Isolated” Claim Time: a time derived from using the claim only, and not using any chart information. To clean the isolated claim information, we used our claim algorithm (described below) or where the claim was obviously too long (≥ 24 h) or where the claim was obviously too short (≤ 30 min) for the procedures we coded the time as missing.
(c) “Best” Chart Time: A time derived using the best information available. Isolated chart time information was augmented with claim information. Correlating claim time with the “best” chart time is obviously tautological, but there will be instances where we provide this information in order to place an informal upper bound on the quality of the claims information. The terms “chart time” and “claim time” always refer to “isolated chart” and “isolated claim” times unless otherwise noted.
Defining Anesthesia and Surgical Chart Time
Chart data on induction, incision, closure and recovery room times were defined for the principal procedure in a standard manner as reported previously.29 We collected chart time and date for start of induction, start of incision, end of closure and entrance to the recovery room. Claim time can only directly provide anesthesia time, as that is how anesthesiologists bill Medicare. Anesthesia time refers to time from induction to recovery room. Surgical time is only available from the chart, and is defined as cut to close time, as surgeons do not bill Medicare by the minute.39
Statistical Methods
The correlations between chart and claim times were assessed with Pearson, Spearman and Kendal correlation coefficients.40 When performing multiple regression models, we used Huber’s robust m-estimation as implemented in SAS Version 9 (SAS Institute, Inc., Cary, NC) using the bisquare weight function.41-43 In our robust regressions, we report as R2 (or rank R2) the square of the Spearman rank correlation between the observed and expected y’s, which is analogous to the square of the Pearson correlation between the observed and predicted ranks of y = chart time. This prevents one or two peculiar claims from greatly increasing or decreasing the R2.
The Claims Algorithm
In order to ascertain the anesthesia time from the Medicare claims, we linked to the index admission in the Inpatient file all the claims in Part B that pertain to that patient. Then we selected only bills that identified an anesthesia service, these are bills with HCPCS codes in the range of 00100 to 01999. We applied the following algorithm (see fig. 1) that ensured that we match the principal surgical procedure in the hospital’s inpatient claim with the appropriate anesthesia bill from the provider in Part B. The first step was to align the dates in the Inpatient and in Part B files. We tried to match the anesthesia date in Part B to the surgical procedure date in the Inpatient file by choosing the anesthesia bill in Part B with the “first expense date” and the “last expense date” that included the “procedure date” of the principal procedure. If there was no overlap between any of the expense dates and the procedure date of the principal procedure, (step 2), we used the interval between the “from date” and the “through date” in Part B that included the “procedure date” of the principal procedure. If there was no overlap between “from” and “through” dates of anesthesia bills and the procedure date of the principal procedure, (step 3), we broadened the time frame in the hospital file so that the index admission and discharge dates in the hospital bill would overlap the “from”-“through” date interval in the provider bill. If multiple anesthesia bills were found that matched in terms of the time frame, we calculated each length and chose the bill with the longest time. If more than one provider reported the same longest time, we did not want to double count time. However it was possible that both providers traded-off times and did not perform services concurrently as assumed by our algorithm. As will be seen, the algorithm performs well despite the potential undercounting of time when anesthesia providers traded–off times, leading us to conclude that for the vast majority of cases the longest anesthesia time billed reflects the total time needed for the entire anesthesia procedure.
Figure 1.

Algorithm for Defining Anesthesia Claim Time
The length of the anesthesia is calculated by multiplying the anesthesia time unit variable in the Physician Part B file by 15 min per unit. The time units are identified by the variable “mile/time/units/services indicator code” when this variable equals 2, it identifies anesthesia. For example a time unit value of “25” implies 2.5 time units (CMS reports units always starting at the tenth’s place, and do not provide the decimal point). We therefore multiply 2.5 units by 15 min/unit to get 37.5 min billed by the anesthesia provider.
RESULTS
Description of Population and Setting
Table 1 displays the distribution of patient and hospital characteristics in the OBSOS study population. The OBSOS study was not a random sample of hospitals in the three states, but did provide a representative cross-section of hospitals and patients.
Table 1.
Patient and Hospital Characteristics in the Study Population
| Study Population | |
|---|---|
| Number of Patients | 15,914 |
|
| |
| Demographics | |
|
| |
| Age, years (std. dev) | 72.77 (4.10) |
|
| |
| Male Sex (%) | 42.06 |
|
| |
| Race White (%) | 91.89 |
|
| |
| Race Black (%) | 4.90 |
|
| |
| Race Other (%) | 3.21 |
|
| |
| Procedure | |
|
| |
| Hip (%) | 24.63 |
|
| |
| Knee (%) | 36.98 |
|
| |
| Colectomy for Cancer (%) | 15.02 |
|
| |
| Colectomy not for CA (%) | 7.34 |
|
| |
| Thoracotomy (%) | 16.03 |
|
| |
|
Hospital Characteristics
Location | |
|
| |
| Illinois (%) | 38.59 |
|
| |
| Texas (%) | 43.19 |
|
| |
| New York (%) | 18.22 |
|
| |
| Number of Hospitals | 47 |
|
| |
| Size (Beds) (std. dev.) | 534 (623) |
|
| |
| Size Distribution | |
| 0-200 (%) | 31.92 |
| 201-400 (%) | 27.66 |
| 401-600 (%) | 10.64 |
| 601-800 (%) | 8.51 |
| >800 (%) | 21.28 |
|
| |
| Nurse to bed ratio* (std dev) | 1.63 (1.01) |
|
| |
| Nurse Mix† (std dev) | 0.91 (0.53) |
|
| |
| Technology index‡ (%) | 86.03 |
|
| |
|
Teaching Intensity based on Resident to Bed Ratio (%) |
|
| Nonteaching (RB ratio = 0) | 46.81 |
| Very Minor (0 < RB ≤ 0.05) | 17.02 |
| Minor (0.05 < RB ≤ 0.25) | 12.77 |
| Major (0.25 <RB≤ 0.6) | 10.64 |
| Very Major (0.6 <RB ≤1.1) | 12.77 |
Full time equivalent registered nurses/number of beds
Registered nurses/(registered nurses + licensed practical nurses)
Technology index = 1 if hospital performs open heart surgery, organ transplantation, or has a burn unit; otherwise index = 0.
Table 2 describes comorbidities in each of the five procedure categories by study and non-study hospital groups. Again, the sample of 47 study hospitals is comprised of patients that look fairly similar to nonstudy hospital patients.
Table 2.
Comorbidities by Procedure Category in Study Population Compared to Nonstudy Hospital Population
| Procedure Category | ||||||||||
|---|---|---|---|---|---|---|---|---|---|---|
| Hip | Knee | Colectomy for Cancer | Colectomy not for CA | Thoracotomy | ||||||
| In Study | Not In Study |
In Study | Not In Study |
In Study | Not In Study |
In Study | Not In Study |
In Study | Not In Study |
|
| Comorbidities | N = 3,920 | N = 34,163 | N = 5,885 | N = 84,141 | N = 2,391 | N = 16,440 | N = 1,168 | N = 8,171 | N = 2,550 | N = 11,480 |
| Mean Number of Comorbidities |
2.45 | 2.46 | 2.36c | 2.43 | 3.91d | 4.06 | 3.22 | 3.34 | 4.72 | 4.73 |
| Hx CHF (%) | 9.26a | 8.32 | 7.39c | 8.52 | 17.61b | 19.93 | 16.87c | 20.51 | 14.39e | 17.46 |
| Hx AMI (%) | 5.97 | 5.63 | 4.38 | 4.50 | 7.40 | 6.85 | 5.74 | 6.02 | 8.51 | 8.88 |
| Hx Diabetes (%) | 19.36 | 19.15 | 24.91 | 25.48 | 27.65b | 30.38 | 25.51 | 26.44 | 23.10 | 23.48 |
| Hx Cancer (%) | 18.72 | 18.29 | 14.43 | 14.47 | N/A | N/A | 27.91 | 25.82 | 90.35f | 87.54 |
In Study N = 15,914; Not In Study N = 154,395 in Texas, Illinois or New York with study eligible procedures and not in the 47 study hospitals
P-values compare in study to not in study < 0.05;
< 0.01;
< 0.005;
< 0.001;
< 0.0005;
<0.0001
Description of Time Differences
Table 3 provides a comparison of missing data as defined by the claim time and chart time variables from the 15,914 patients evaluable in the OBSOS study. Here we see that there were missing data in both the claims and chart derived times. There were 1,187 patients or 7.5% of the claims with missing times, and 385 patients or 2.4% of abstracted charts with missing times, but there was almost no overlap between the patients with missing claim time and those with missing chart time, with only 27 patients missing time data from both claim and chart. The distribution of anesthesia chart times in those patients who were missing anesthesia claim times was almost identical to the distribution of anesthesia chart times in those not missing anesthesia claim times. Similarly, the distribution of anesthesia claim times in those patients who were missing anesthesia chart times was almost identical to the distribution of anesthesia claim times in those patients who were not missing anesthesia chart times (see fig. 2). Figure 2 suggests no interesting relationship between missing times on one variable and recorded times on another.
Table 3.
Relationship between Available Anesthesia Data Found in Claim and Chart
| Claim Time | ||||
|---|---|---|---|---|
| Present | Missing | Totals | ||
| Chart Time | Present | 14,369 (90.3%) | 1,160 (7.3%) | 15,529 (97.6%) |
| Missing | 358 (2.2%) | 27 (0.2%) | 385 (2.4%) | |
| Totals | 14,727 (92.5%) | 1,187 (7.5%) | 15,914 (100%) | |
Figure 2.
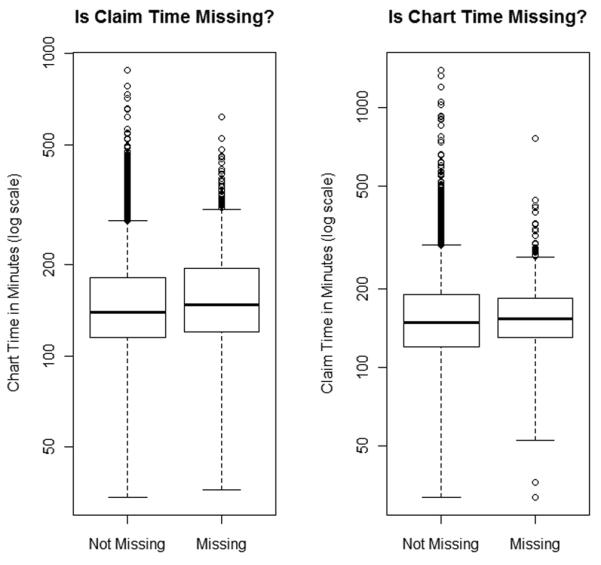
Distribution of Anesthesia Claim and Chart Times by Missing Status
Using the 14,369 patients who had both chart and claim times, we next studied the correlations between chart and claim times. Table 4 provides these correlations using theSpearman, Pearson and Kendal τ statistics with their confidence intervals and p-values. The correlations between chart and claim times were very high, ranging from 0.85 for the Kendal’s tau to 0.94 for the Spearman. We also provide the probability of concordance associated with the Kendal coefficient τ, which is equal to (τ+1)/2; for two patients, it is the probability that the chart and claim will agree about which patient had the longer anesthesia time. The probability of concordance was 0.93. The median absolute difference between chart and claim was only 5 min (95% CI 5.0, 5.5), and the median difference was 4.5 min.
Table 4.
Associations between Anesthesia Claim and Chart Times (N = 14,369)
| Value | 95% CI | P-value | |
|---|---|---|---|
| Pearson Correlation | 0.87 | 0.84, 0.91 | < 0.0001 |
| Spearman Correlation | 0.94 | 0.94, 0.95 | < 0.0001 |
| Kendall Correlation (τ) | 0.85 | 0.85, 0.86 | < 0.0001 |
| Probability of Concordance* | 0.93 | 0.92, 0.93 | < 0.0001 |
| Median Absolute Difference (min) | 5.0 | 5.0, 5.5 |
Probability of Concordance = (1 + Kendall τ)/2
Table 5 provides similar information as table 3 but compares claim time to “best” chart time. As expected, because of the definition of “best” chart time, there is better correlation between the claim time and the “best” chart time—although this is presented just to help bound the correlation, as for this calculation information from the claim was used to correct the chart time as was described in methods.
Table 5.
Associations between Anesthesia Claim and “Best” Chart Times (N = 14,370)
| Value | 95% CI | P-value | |
|---|---|---|---|
| Pearson Correlation | 0.89 | 0.85, 0.92 | < 0.0001 |
| Spearman Correlation | 0.94 | 0.94, 0.95 | < 0.0001 |
| Kendall Correlation (τ) | 0.85 | 0.85, 0.86 | < 0.0001 |
| Probability of Concordance* | 0.93 | 0.92, 0.93 | < 0.0001 |
| Median Absolute Difference (min) | 5.0 | 5.0, 5.5 |
Probability of Concordance = (1 + Kendall τ)/2
Table 6 presents the distribution of claim times, chart times and best chart times for each of the five procedure groups in the study (hip replacement or revision, knee replacement or revision, colectomy for cancer, colectomy not for cancer, and thoracotomy).
Table 6.
Distribution of Anesthesia Claim Time, Chart Time, and Best Chart Time in the Five Procedure Categories
| Procedure Category | Time Variables (min) | N | 5th %ile | 25th %ile | 50th %ile | 75th %ile | 95th %ile |
|---|---|---|---|---|---|---|---|
| Hip without Fracture | Claim Time | 3,620 | 90 | 119 | 143 | 177 | 255 |
| N = 3,920 | Chart Time | 3,832 | 85 | 114 | 138 | 171 | 238 |
| Best Estimate Chart | 3,832 | 85 | 114 | 138 | 171 | 237 | |
| Knee | Claim Time | 5,491 | 78 | 114 | 137 | 165 | 233 |
| N = 5,885 | Chart Time | 5,753 | 73 | 108 | 130 | 159 | 220 |
| Best Estimate Chart | 5,753 | 74 | 108 | 130 | 159 | 220 | |
| Colectomy for Cancer | Claim Time | 1,084 | 95 | 132 | 165 | 220 | 324 |
| N = 1,168 | Chart Time | 1,131 | 91 | 126 | 160 | 210 | 314 |
| Best Estimate Chart | 1,131 | 91 | 126 | 160 | 210 | 315 | |
| Colectomy not for Cancer | Claim Time | 2,223 | 90 | 122 | 161 | 210 | 323 |
| N = 2,391 | Chart Time | 2,324 | 84 | 117 | 152 | 204 | 312 |
| Best Estimate Chart | 2,325 | 84 | 117 | 152 | 204 | 312 | |
| Thoracotomy | Claim Time | 2,309 | 104 | 146 | 185 | 230 | 326 |
| N = 2,550 | Chart Time | 2,489 | 95 | 135 | 175 | 221 | 310 |
| Best Estimate Chart | 2,489 | 95 | 135 | 175 | 220 | 309 |
A Bland-Altman plot is presented in figure 3, which displays the difference between anesthesia chart and anesthesia claim times versus the average value of each pair. The vast majority of points show little difference between chart and claim, but there are a few outliers with respect to both measures. As there are 14,369 points on this graph, it should be remembered that outliers represent only a very small fraction of patients. The “wings” of the Bland-Altman plot do show rare large outliers. Eighty percent of the pairs showed differences between −16 and 0.5 min, and 95% of the pairs show differences between −49 and 16 min.
Figure 3.
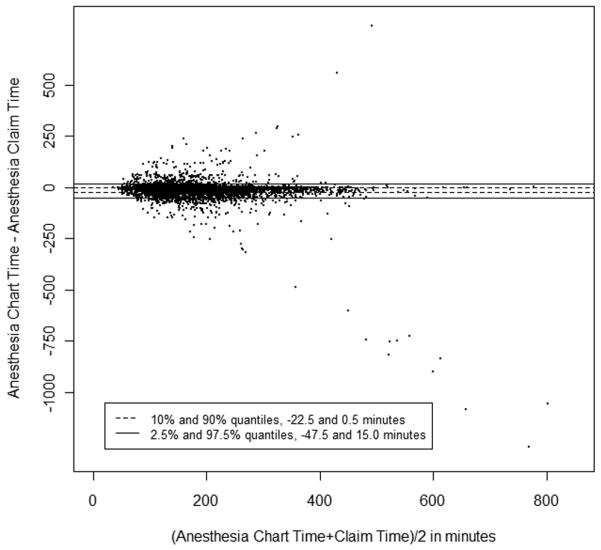
Bland-Altman Plot: Anesthesia Chart Time − Anesthesia Claim Time versus (Anesthesia Chart Time + Anesthesia Claim Time)/2. (N = 14,369 observations)
Regression Modeling: The influence of patient, procedure and hospital
We next asked whether we could detect any appreciable difference in the discrepancy between claim and chart depending on type of surgical procedure or on the specific study hospital. For each regression using m-estimation our dependent variable is chart time, and the independent variables are claim time as well as hospital identifiers and/or procedure types, depending on the model. We use m-estimation because we observe that there are some extreme outliers in both the claim and the chart, and as our work has suggested in the past29, m-estimation is less sensitive to such errors.41,42 Table 7 displays four models. Model 1 simply predicts chart time using claim time. Model 2 adds into Model 1 individual hospitals. Model 3 adds procedure type to Model 1. Finally Model 4 adds both hospital and procedure variables to Model 1.
Table 7.
M-Estimation Regression Models to Predict Anesthesia Chart Time Using Anesthesia Claim Time
| Regression Models |
Model 1: Claim Time (min) |
Model 2: Claim Time + Hospital Identifier |
Model 3: Claim Time + Surgical Procedure |
Model 4: Claim Time + Hospital Identifier + Surgical Procedure |
|---|---|---|---|---|
| Intercept | −1.21 | (N/A) | −1.25 | (N/A) |
|
Claim Time
(SE) (CI) |
0.977 (0.0008) (0.976-0.979) |
0.989 (0.0006) (0.987-0.990) |
0.979 (0.0009) (0.978-0.981) |
0.990 (0.0007) (0.988-0.991) |
|
Claim Time
P value |
< 0.0001 | < 0.0001 | < 0.0001 | < 0.0001 |
|
N
Model R2 |
14,369 0.89 |
14,369 0.90 |
14,369 0.89 |
14,369 0.90 |
|
Median Absolute
Error |
4.33 | 2.80 | 4.32 | 2.79 |
|
P-Value (Wald
test) vs. Model 1 |
< 0.0001 | < 0.0001 | < 0.0001 |
Model 1 suggests that we can estimate chart time very well with claim time. The coefficient on the claim time was nearly 1, and the intercept was −1.21 min. The model R2 was 0.89. Model 2 asks whether the relationship between claim and chart changes with the hospital. We do observe that the hospital does have a significant influence on the model, but the effects were extremely small. The hospital with the largest effect only increased the difference between the claim and the chart by 15 min (results not shown). We next asked if the individual procedure influenced the relationship between claim and chart. Again, we observed statistically significant but clinically insignificant effects from procedure, with effects on the order of only 1 to 2 min. Finally, Model 4 includes both hospital and procedure variables. Again, we see no appreciable difference in the estimates. Hence, a single formula that is not adjusted for procedure or hospital appears reasonable for this data set.
In a related set of analyses we ran a series of models to explore whether patient procedure, patient characteristics and hospital characteristics could predict the difference between anesthesia chart time and anesthesia claim time. While some results were statistically significant, all effects were very small and not of clinical interest. The median absolute error for the model using procedure as an independent variable was 4.39 min, with only 2.39 min separating the most extreme procedures. Adding patient characteristics did not improve the median absolute error, and further adding hospital characteristics only reduced the median absolute error to 3.88 min. Hence, patient, procedure and hospital characteristics did not influence the errors between anesthesia chart time and claim time in this data set.
Estimating Surgical Chart Time from Anesthesia Claim Time
One very likely application of the algorithm we use to derive information from the anesthesia claim is the estimate of surgical time. Since only anesthesiologists, and not surgeons, bill by the minute, we do not have a direct bill for surgical time. We can, however, observe how well the Medicare anesthesia claim information can describe surgical time. We might imagine that the difference between the anesthesia claim time and the surgical chart time may be more susceptible to the influence of procedure type and hospital than when using anesthesia claim time to predict anesthesia chart time. This is because the style of practice in a hospital may dictate different styles of coordination between the surgeon and the anesthetist. Table 8 displays the exact models as seen in table 7, but here we have substituted anesthesia chart time with surgical chart time. There are some immediate differences between table 7 and table 8. First, we see that there is generally a 22-min gap between the total surgical time and the total anesthesia time. Luckily for the patient, the intercept term is negative, suggesting anesthesia time is longer than surgical time We also observe that the influence of hospital style does play a slightly larger role in the regression, as does the influence of the procedure. However, as before, both effects were quite small, typically amounting to only a few minutes difference by institution or procedure. When we reran all models, substituting anesthesia chart time for anesthesia claim time, we obtained almost identical coefficients, with slightly smaller median errors. Figure 4 describes the relationship between surgical chart time and predicted surgical time derived from Model 1 in table 8. Using anesthesia claims to predict surgical time was not as accurate as using anesthesia claims to predict anesthesia claim time, yet 80% of paired differences were between −24 and 19 min.
Table 8.
M-Estimation Regression Models to Predict Surgical Chart Time Using Anesthesia Claim Time
| Regression Models |
Model 1: Claim Time (min) |
Model 2: Claim Time + Hospital Identifier |
Model 3: Claim Time + Surgical Procedure |
Model 4: Claim Time + Hospital Identifier + Surgical Procedure |
|---|---|---|---|---|
| Intercept | −21.77 | (N/A) | −21.61 | (N/A) |
|
Claim Time
(SE) (CI) |
0.805 (0.0020) (0.801-0.809) |
0.850 (0.0019) (0.847-0.854) |
0.803 (0.0020) (0.799-0.807) |
0.848 (0.0019) (0.844-0.851) |
|
Claim Time
P value |
< 0.0001 | < 0.0001 | < 0.0001 | < 0.0001 |
|
N=
Model R2 |
14,371 0.78 |
14,371 0.80 |
14,371 0.79 |
14,371 0.81 |
|
Median
Absolute Error |
9.63 | 8.33 | 9.25 | 8.12 |
|
P-Value (Wald
test) vs. Model 1 |
< 0.0001 | < 0.0001 | < 0.0001 |
Figure 4.
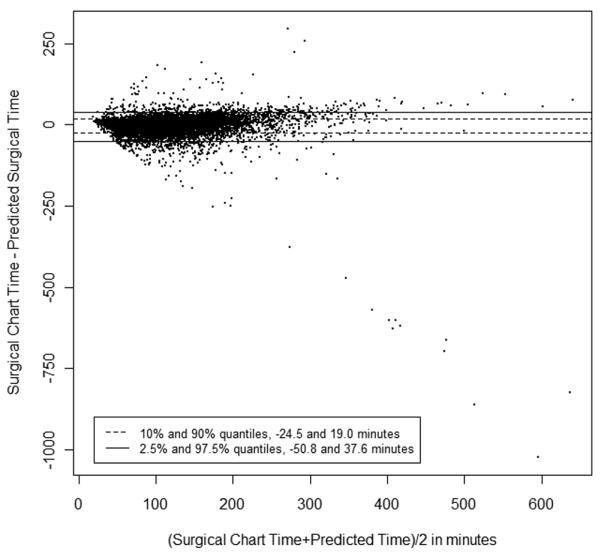
Bland-Altman Plot: Surgical Chart Time − Predicted Surgical Chart Time versus (Surgical Chart Time + Predicted Surgical Chart Time)/2. (N = 14,371 observations)
Best Anesthesia Chart Time versus Claim Time
Finally, we wish to describe the relationship between the anesthesia claim time and the anesthesia chart time that is corrected by claims when the chart time is missing. While the relationship is tautological, in that we used some claim time information to “correct” obvious chart errors, we only corrected these errors when we had no consistent chart information to make a judgment. In other words, for 146 patients we corrected the charts by using the claims, and the odds are great that these were fairly close (as there is only a 5-min median absolute time difference). We present this in order to better describe how well an individual using the anesthesia claims could mimic the actual anesthesia time as determined as best as possible. As can be seen in table 9, the results were quite similar to the previous findings. Hence, using the claim time does an excellent job at predicting chart time. Figure 5 displays a Bland-Altman plot for the Best Anesthesia Chart Time and the Anesthesia Claim Time. These plots look almost identical to the Anesthesia Chart Time versus Anesthesia Claim Time displayed in figure 3.
Table 9.
M-Estimation Regression Models to Predict “Best” Anesthesia Chart Time Using Anesthesia Claim Time
| Regression Models |
Model 1: Claim Time (min) |
Model 2: Claim Time + Hospital Identifier |
Model 3: Claim Time + Surgical Procedure |
Model 4: Claim Time + Hospital Identifier + Surgical Procedure |
|---|---|---|---|---|
| Intercept | −1.19 | (N/A) | −1.23 | (N/A) |
|
Claim Time
(SE) (CI) |
0.977 (0.0008) (0.976-0.979) |
0.989 (0.0006) (0.987-0.990) |
0.980 (0.0009) (0.978-0.981) |
0.990 (0.0007) (0.988-0.991) |
|
Claim Time
P value |
< 0.0001 | < 0.0001 | < 0.0001 | < 0.0001 |
|
N
Model R2 |
14,370 0.89 |
14,370 0.90 |
14,370 0.89 |
14,370 0.90 |
|
Median Absolute
Error |
4.30 | 2.79 | 4.30 | 2.78 |
|
P-Value (Wald
test) vs. Model 1 |
< 0.0001 | < 0.0001 | < 0.0001 |
Figure 5.

Bland-Altman Plot: Best Anesthesia Chart Time − Anesthesia Claim Time versus (Best Anesthesia Chart Time + Anesthesia Claim Time)/2. (N = 14,369 observations)
DISCUSSION
The OBSOS provided us with a unique opportunity to study how Medicare claims can be used to estimate procedure length, because the study was designed to measure operative time and entailed the merging of chart information with Medicare claims. Procedure length is a fundamental variable associated with quality and outcomes. Many have published on procedure length,1-17 often using chart reviews at single institutions.1-7 If anesthesia claims could be utilized to reliably provide valid information on procedure length, then many questions now relying on single institution studies with relatively small data sets could be answered with much larger and more representative samples. For example, large-scale nationwide studies of anesthesia claim time can be utilized to study a vast assortment of questions involving both clinical and health services research in anesthesiology and surgery. On the clinical side, better measures of anesthesia cumulative exposure may provide methods to study potential toxicities associated with anesthetic agents, and may provide us with a better way to study and develop models that assess postoperative risk due, in part, to deviations from the expected anesthesia time for the actual procedure performed. On the health services side, questions of quality can be studied, with benchmarking across all hospitals that care for Medicare patients. Examples include the study of racial disparities in procedure length inside and between hospitals throughout the United States, again, based on the actual procedures performed.
The results provided in the present report give the potential investigator a higher degree of confidence that anesthesia claims can be utilized to derive anesthesia time. The data presented in this study represents far more observations than those we reported on three years ago. Previously, using data from 1995-1996, we had analyzed 1,931 Medicare patients in 187 hospitals in the state of Pennsylvania. When we compared the chart to the claim, we observed a median absolute error of 5.49 min.29 In the present study, we report on the abstraction of 14,369 Medicare charts in 3 states over 47 hospitals. We find a median absolute difference that was very small, only 5.0 min. In other words, we can be quite certain that for the vast majority of cases, anesthesia claims work well at estimating anesthesia time.
In the present study, like our original study, we did observe occasional errors that were substantial. Therefore, as in the past report, we suggest the use of regression techniques that down-weight outliers when fitting models. Such techniques are ideally suited for problems such as ours, where claims information is usually correct but may occasionally fail to reflect the true procedure length due to mistakes in the algorithm that links claim to procedure, mistakes in the algorithm identifying whether anesthesiologists worked sequentially or concurrently, or mistakes in coding. As it stands, in situations where there is no single member of the anesthesia team that bills for the entire procedure, the claim may underestimate the chart. Furthermore, we may observe situations where the claim overestimates the chart information. These instances may reflect mistaken linkages between the specific procedure for which the claim was made. As anesthesia bills often use a “from-through” date that encompasses multiple procedures, one may mistakenly assign excess time to a single procedure that mistakenly reflects other procedures’ time.
Though this paper has focused on the potential use of anesthesia claim time as a dependent variable (an outcome variable) for many analyses, anesthesia claim time can also be utilized as an independent variable in models designed to predict outcomes. Just as when a claim time is used as the dependent (y) variable in regression it is important to fit these models using a robust method such as m-estimation,44 (because claim times closely reproduce chart times with rare but large errors), when a claim time is used as an independent (x) variable in a model, it is similarly important to fit these models using bounded-influence methods.45,46
While we want investigators to be aware of the potential pitfalls in using claims to determine anesthesia and surgical time, we do not want to overstate these problems. The correlations we report, now in two separate studies spanning over 8 yr of data, and close to 16,000 observations, are high and will be useful for applying the claims estimates to many important questions being studied concerning procedure time.
It is also interesting to note that billing styles were fairly similar across hospitals. We generally found only small differences between hospitals, with the exception of a few that were associated with 10 to 15 min claim-chart time differences. Furthermore, the median difference between the claim time and the chart time was 5 min. This number would not appear to be a coincidence. As one anesthesia time unit equals 15 min, a policy of always rounding up to the higher unit would lead to about a 5 min difference on average (assuming a uniform distribution for the fraction of units remaining before round-up).
In summary, we have demonstrated that the Medicare anesthesia claim can be utilized to construct an excellent measure of procedure time. Future investigators can feel confident that they may utilize our algorithm to better study procedure length through using the Medicare claim, without the need to collect procedure length information directly from the chart.
Supplementary Material
Summary Statement.
Procedure length from charts was compared to minutes billed in 15,914 Medicare anesthesia claims over 47 hospitals. There was very good concordance between chart and claim, with a median absolute difference of only 5 min.
Acknowledgements
We thank Traci Frank, A.A., Administrative Coordinator1, Rebecca Jones, M.S.N., R.N., Measures Project Coordinator7, and Min Wang, M.H.S., Project Manager1 for their assistance with this manuscript. Individuals who assisted in the acquisition of data at the study hospitals are acknowledged in appendix 2.
Funding Source: National Institute of Diabetes and Digestive and Kidney Disease, Bethesda, Maryland (Grant #R01-DK07-3671)
Footnotes
This work is received from the Center for Outcomes Research, The Children’s Hospital of Philadelphia, Philadelphia, Pennsylvania.
This is a PDF file of an unedited manuscript that has been accepted for publication. As a service to our customers we are providing this early version of the manuscript. The manuscript will undergo copyediting, typesetting, and review of the resulting proof before it is published in its final citable form. Please note that during the production process errors may be discovered which could affect the content, and all legal disclaimers that apply to the journal pertain.
REFERENCES
- 1.Kessler S, Kinkel S, Kafer W, Puhl W, Schochat T. Influence of operation duration on perioperative morbidity in revision total hip arthroplasty. Acta Orthop Belg. 2003;69:328–33. [PubMed] [Google Scholar]
- 2.McGillicuddy EA, Schuster KM, Davis KA, Longo WE. Factors predicting morbidity and mortality in emergency colorectal procedures in elderly patients. Arch Surg. 2009;144:1157–62. doi: 10.1001/archsurg.2009.203. [DOI] [PubMed] [Google Scholar]
- 3.Peersman G, Laskin R, Davis J, Peterson MG, Richart T. Prolonged operative time correlates with increased infection rate after total knee arthroplasty. HSS J. 2006;2:70–2. doi: 10.1007/s11420-005-0130-2. [DOI] [PMC free article] [PubMed] [Google Scholar]
- 4.Imai E, Ueda M, Kanao K, Kubota T, Hasegawa H, Omae K, Kitajima M. Surgical site infection risk factors identified by multivariate analysis for patient undergoing laparoscopic, open colon, and gastric surgery. Am J Infect Control. 2008;36:727–31. doi: 10.1016/j.ajic.2007.12.011. [DOI] [PubMed] [Google Scholar]
- 5.Collins R, Scrimgeour A, Yusuf S, Peto R. Reduction in fatal pulmonary embolism and venous thrombosis by perioperative administration of subcutaneous heparin. Overview of results of randomized trials in general, orthopedic, and urologic surgery. N Engl J Med. 1988;318:1162–73. doi: 10.1056/NEJM198805053181805. [DOI] [PubMed] [Google Scholar]
- 6.Garibaldi RA, Cushing D, Lerer T. Risk factors for postoperative infection. Am J Med. 1991;91:158S–63S. doi: 10.1016/0002-9343(91)90362-2. [DOI] [PubMed] [Google Scholar]
- 7.Boruk M, Chernobilsky B, Rosenfeld RM, Har-El G. Age as a prognostic factor for complications of major head and neck surgery. Arch Otolaryngol Head Neck Surg. 2005;131:605–9. doi: 10.1001/archotol.131.7.605. [DOI] [PubMed] [Google Scholar]
- 8.Scott CF., Jr Length of operation and morbidity: Is there a relationship? Plast Reconstr Surg. 1982;69:1017–21. doi: 10.1097/00006534-198206000-00024. [DOI] [PubMed] [Google Scholar]
- 9.Collins TC, Daley J, Henderson WH, Khuri SF. Risk factors for prolonged length of stay after major elective surgery. Ann Surg. 1999;230:251–9. doi: 10.1097/00000658-199908000-00016. [DOI] [PMC free article] [PubMed] [Google Scholar]
- 10.Ong KL, Lau E, Manley M, Kurtz SM. Effect of procedure duration on total hip arthroplasty and total knee arthroplasty survivorship in the United States Medicare population. J Arthroplasty. 2008;23:127–32. doi: 10.1016/j.arth.2008.04.022. [DOI] [PubMed] [Google Scholar]
- 11.Campbell DA, Jr, Henderson WG, Englesbe MJ, Hall BL, O’Reilly M, Bratzler D, Dellinger EP, Neumayer L, Bass BL, Hutter MM, Schwartz J, Ko C, Itani K, Steinberg SM, Siperstein A, Sawyer RG, Turner DJ, Khuri SF. Surgical site infection prevention: The importance of operative duration and blood transfusion--results of the first American College of Surgeons-National Surgical Quality Improvement Program Best Practices Initiative. J Am Coll Surg. 2008;207:810–20. doi: 10.1016/j.jamcollsurg.2008.08.018. [DOI] [PubMed] [Google Scholar]
- 12.Hollenbeck BK, Miller DC, Taub D, Dunn RL, Khuri SF, Henderson WG, Montie JE, Underwood W, 3rd, Wei JT. Identifying risk factors for potentially avoidable complications following radical cystectomy. J Urol. 2005;174:1231–7. doi: 10.1097/01.ju.0000173923.35338.99. [DOI] [PubMed] [Google Scholar]
- 13.Rogers SO, Jr, Kilaru RK, Hosokawa P, Henderson WG, Zinner MJ, Khuri SF. Multivariable predictors of postoperative venous thromboembolic events after general and vascular surgery: Results from the patient safety in surgery study. J Am Coll Surg. 2007;204:1211–21. doi: 10.1016/j.jamcollsurg.2007.02.072. [DOI] [PubMed] [Google Scholar]
- 14.Culver DH, Horan TC, Gaynes RP, Martone WJ, Jarvis WR, Emori TG, Banerjee SN, Edwards JR, Tolson JS, Henderson TS. Surgical wound infection rates by wound class, operative procedure, and patient risk index. National Nosocomial Infections Surveillance System. Am J Med. 1991;91:152S–7S. doi: 10.1016/0002-9343(91)90361-z. [DOI] [PubMed] [Google Scholar]
- 15.Wallner LP, Dunn RL, Sarma AV, Campbell DA, Jr, Wei JT. Risk factors for prolonged length of stay after urologic surgery: The National Surgical Quality Improvement Program. J Am Coll Surg. 2008;207:904–13. doi: 10.1016/j.jamcollsurg.2008.08.015. [DOI] [PubMed] [Google Scholar]
- 16.Khuri SF, Najjar SF, Daley J, Krasnicka B, Hossain M, Henderson WG, Aust JB, Bass B, Bishop MJ, Demakis J, DePalma R, Fabri PJ, Fink A, Gibbs J, Grover F, Hammermeister K, McDonald G, Neumayer L, Roswell RH, Spencer J, Turnage RH. Comparison of surgical outcomes between teaching and nonteaching hospitals in the Department of Veterans Affairs. Ann Surg. 2001;234:370–82. doi: 10.1097/00000658-200109000-00011. [DOI] [PMC free article] [PubMed] [Google Scholar]
- 17.Schwartz SR, Yueh B, Maynard C, Daley J, Henderson W, Khuri SF. Predictors of wound complications after laryngectomy: A study of over 2000 patients. Otolaryngol Head Neck Surg. 2004;131:61–8. doi: 10.1016/j.otohns.2003.08.028. [DOI] [PubMed] [Google Scholar]
- 18.Abouleish AE, Prough DS, Zornow MH, Hughes J, Whitten CW, Conlay LA, Abate JJ, Horn TE. The impact of longer-than-average anesthesia times on the billing of academic anesthesiology departments. Anesth Analg. 2001;93:1537–43. doi: 10.1097/00000539-200112000-00042. [DOI] [PubMed] [Google Scholar]
- 19.Schuster M, Standl T, Reissmann H, Kuntz L, Am Esch JS. Reduction of anesthesia process times after the introduction of an internal transfer pricing system for anesthesia services. Anesth Analg. 2005;101:187–94. doi: 10.1213/01.ANE.0000154187.47998.60. [DOI] [PubMed] [Google Scholar]
- 20.Sandberg WS, Daily B, Egan M, Stahl JE, Goldman JM, Wiklund RA, Rattner D. Deliberate perioperative systems design improves operating room throughput. Anesthesiology. 2005;103:406–18. doi: 10.1097/00000542-200508000-00025. [DOI] [PubMed] [Google Scholar]
- 21.Torkki PM, Marjamaa RA, Torkki MI, Kallio PE, Kirvela OA. Use of anesthesia induction rooms can increase the number of urgent orthopedic cases completed within 7 hours. Anesthesiology. 2005;103:401–5. doi: 10.1097/00000542-200508000-00024. [DOI] [PubMed] [Google Scholar]
- 22.Dexter F, Coffin S, Tinker JH. Decreases in anesthesia-controlled time cannot permit one additional surgical operation to be reliably scheduled during the workday. Anesth Analg. 1995;81:1263–8. doi: 10.1097/00000539-199512000-00024. [DOI] [PubMed] [Google Scholar]
- 23.Dexter F. A strategy to decide whether to move the last case of the day in an operating room to another empty operating room to decrease overtime labor costs. Anesth Analg. 2000;91:925–8. doi: 10.1097/00000539-200010000-00029. [DOI] [PubMed] [Google Scholar]
- 24.Abouleish AE, Prough DS, Vadhera RB. Influence of the type of anesthesia provider on costs of labor analgesia to the Texas Medicaid program. Anesthesiology. 2004;101:991–8. doi: 10.1097/00000542-200410000-00026. [DOI] [PubMed] [Google Scholar]
- 25.Abouleish AE, Dexter F, Whitten CW, Zavaleta JR, Prough DS. Quantifying net staffing costs due to longer-than-average surgical case durations. Anesthesiology. 2004;100:403–12. doi: 10.1097/00000542-200402000-00033. [DOI] [PubMed] [Google Scholar]
- 26.Watcha MF, White PF. Economics of anesthetic practice. Anesthesiology. 1997;86:1170–96. doi: 10.1097/00000542-199705000-00021. [DOI] [PubMed] [Google Scholar]
- 27.Abouleish AE. Increasing operating room throughput: Just buzzwords for this decade? Anesthesiology. 2008;109:3–4. doi: 10.1097/ALN.0b013e318178823c. [DOI] [PubMed] [Google Scholar]
- 28.Smith MP, Sandberg WS, Foss J, Massoli K, Kanda M, Barsoum W, Schubert A. High-throughput operating room system for joint arthroplasties durably outperforms routine processes. Anesthesiology. 2008;109:25–35. doi: 10.1097/ALN.0b013e31817881c7. [DOI] [PubMed] [Google Scholar]
- 29.Silber JH, Rosenbaum PR, Zhang X, Even-Shoshan O. Estimating anesthesia and surgical procedure times from Medicare anesthesia claims. Anesthesiology. 2007;106:346–55. doi: 10.1097/00000542-200702000-00024. [DOI] [PubMed] [Google Scholar]
- 30.Silber JH, Rosenbaum PR, Zhang X, Even-Shoshan O. Influence of patient and hospital characteristics on anesthesia time in Medicare patients undergoing general and orthopedics surgery. Anesthesiology. 2007;106:356–64. doi: 10.1097/00000542-200702000-00025. [DOI] [PubMed] [Google Scholar]
- 31.Kurtz SM, Ong KL, Lau E, Bozic KJ, Berry D, Parvizi J. Prosthetic joint infection risk after TKA in the Medicare population. Clin Orthop Relat Res. 2010;468:52–6. doi: 10.1007/s11999-009-1013-5. [DOI] [PMC free article] [PubMed] [Google Scholar]
- 32.Pandit JJ. Similarity of operation times for common general surgical procedures in the United Kingdom and the United States. Anesthesiology. 2007;107:512–3. doi: 10.1097/01.anes.0000279488.09671.10. [DOI] [PubMed] [Google Scholar]
- 33.Westbury S, Pandit M, Pandit JJ. Matching surgical operating capacity to demand using estimates of operating times. J Health Organ Manag. 2009;23:554–67. doi: 10.1108/14777260910984032. [DOI] [PubMed] [Google Scholar]
- 34.Stubbs D, Ward ME, Pandit JJ. Estimating hourly anaesthetic and surgical reimbursement from private medical insurers’ benefit maxima: Implications for pricing services and for incentives. Anaesthesia. 2010;65:396–408. doi: 10.1111/j.1365-2044.2009.06238.x. [DOI] [PubMed] [Google Scholar]
- 35.Eijkemans MJ, van Houdenhoven M, Nguyen T, Boersma E, Steyerberg EW, Kazemier G. Predicting the unpredictable: A new prediction model for operating room times using individual characteristics and the surgeon’s estimate. Anesthesiology. 2010;112:41–9. doi: 10.1097/ALN.0b013e3181c294c2. [DOI] [PubMed] [Google Scholar]
- 36.Pandit JJ, Stubbs D, Pandit M. Measuring the quantitative performance of surgical operating lists: Theoretical modelling of ‘productive potential’ and ‘efficiency’. Anaesthesia. 2009;64:473–86. doi: 10.1111/j.1365-2044.2008.05854.x. [DOI] [PubMed] [Google Scholar]
- 37.Burgess DJ. Are providers more likely to contribute to healthcare disparities under high levels of cognitive load? How features of the healthcare setting may lead to biases in medical decision making. Med Decis Making. 2010;30:246–57. doi: 10.1177/0272989X09341751. [DOI] [PMC free article] [PubMed] [Google Scholar]
- 38.Hanss R, Roemer T, Hedderich J, Roesler L, Steinfath M, Bein B, Scholz J, Bauer M. Influence of anaesthesia resident training on the duration of three common surgical operations. Anaesthesia. 2009;64:632–7. doi: 10.1111/j.1365-2044.2008.05853.x. [DOI] [PubMed] [Google Scholar]
- 39.Centers for Medicare and Medicaid Services . Part A: General Payment Rule, Medicare Claims Processing Manual. 2007. Chapter 12: Physicians/Nonphysician Practitioners; Section 50: Payment for Anesthesiology Services; pp. 88–9. [Google Scholar]
- 40.Hollander M, Wolfe DA. Nonparametric Statistical Methods. 2nd Edition John Wiley & Sons; New York, NY: 1999. [Google Scholar]
- 41.Huber PJ. The Basic Types of Estimates, Robust Statistics. John Wiley & Sons; Hoboken, NJ: 1981. Chapter 3; pp. 43–55. [Google Scholar]
- 42.Hampel FR, Ronchett EM, Rousseeuw PJ, Stahel WA. The Approach Based on Influence Functions. John Wiley & Sons; New York, NY: 1986. Chapter 6. Linear Models: Robust Estimation, Robust Statistics; pp. 315–28. [Google Scholar]
- 43.Huber PJ. Robust regression: Asymptotics, Conjectures and the Monte Carlo. Ann Stat. 1973;1:799–821. [Google Scholar]
- 44.Huber PJ. Robust Statistics. John Wiley & Sons; Hoboken, NJ: 1981. [Google Scholar]
- 45.Markatou M, Hettmansperger TP. Robust bounded-influence tests in linear models. J Am Stat Assoc. 1990;85:187–90. [Google Scholar]
- 46.Heritier S, Ronchetti E. Robust bounded-influence tests in general parametric models. J Am Stat Assoc. 1994;89:897–904. [Google Scholar]
Associated Data
This section collects any data citations, data availability statements, or supplementary materials included in this article.