Abstract
Endoplasmic reticulum (ER) stress is increasingly recognized as an important mechanism in a wide range of diseases including cystic fibrosis, alpha-1 antitrypsin deficiency, Parkinson's and Alzheimer's disease. Therefore, there is an increased need for reliable and quantitative markers for detection of ER stress in human tissues and cells. Accumulation of unfolded or misfolded proteins in the endoplasmic reticulum can cause ER stress, which leads to the activation of the unfolded protein response (UPR). UPR signaling involves splicing of X-box binding protein-1 (XBP1) mRNA, which is frequently used as a marker for ER stress. In most studies, the splicing of the XBP1 mRNA is visualized by gel electrophoresis which is laborious and difficult to quantify. In the present study, we have developed and validated a quantitative real-time RT-PCR method to detect the spliced form of XBP1 mRNA.
Keywords: ER stress, Spliced XBP1, Real-time RT-PCR, BiP, CHOP, Primary bronchial epithelial cells
Introduction
Endoplasmic reticulum (ER) stress induced by protein misfolding is an important mechanism in cellular stress in a variety of diseases. When protein folding in the ER is compromised, the unfolded proteins accumulate in the ER which leads to ER stress. ER stress triggers the unfolded protein response (UPR), a transcriptional induction pathway which is aimed at restoring normal ER functioning (Schroder and Kaufman 2005).
The UPR is mediated by three ER stress receptors: protein kinase RNA-like ER kinase (PERK), inositol-requiring protein-1 (IRE1) and activating transcription factor-6 (ATF6). In the absence of ER stress, all three ER stress receptors are maintained in an inactive state through their association with the ER-chaperone protein GRP78 (BiP). ER stress results in the dissociation of BiP from the three receptors, which subsequently leads to their activation (Ron and Walter 2007). Dissociation of BiP from PERK leads to autophoshorylation and thereby activation of PERK and subsequent phosphorylation of translation initiation factor eIF2α, resulting in an inhibition of mRNA translation, and eventually in the translation of the transcription factor ATF4. Dissociation of BiP from ATF6 leads to translocation of ATF6 to the Golgi complex where it is cleaved by proteases into an active transcription factor. Active ATF6 moves to the nucleus and induces expression of genes with an ER stress response element (ERSE) in their promoter such as the ER-chaperone protein BiP and the transcription factors C/EBP homologous protein (CHOP) and X-box binding protein-1 (XBP1). Dissociation of BiP from IRE1 leads to the activation of IRE1 which cleaves a 26-nucleotide intron from the XBP1 mRNA. The spliced XBP1 mRNA encodes a stable, active transcription factor that binds to the UPRE or ERSE sequence of many UPR target genes, leading to transcription of ER-chaperone proteins (Ron and Walter 2007; Yoshida et al. 2001).
The UPR can be induced experimentally by chemicals like thapsigargin and tunicamycin. Thapsigargin blocks the ER calcium ATPase pump, leading to depletion of ER calcium stores and tunicamycin blocks N-linked glycosylation of proteins. Both chemicals lead to high levels of stressors which are expected to rapidly activate all three components of the UPR (Rutkowski and Kaufman 2004).
An increasing number of studies have reported the involvement of ER stress in a variety of diseases, including cystic fibrosis, alpha-1 antitrypsin deficiency, Parkinson's and Alzheimer's disease. Therefore, there is a growing demand for quantifiable markers to measure ER stress. The splicing of XBP1 mRNA is considered to be an important marker for ER stress; however, the quantification is difficult because the splicing is mainly visualized by gel electrophoresis after conventional RT-PCR. We have now developed a simple and quantitative method to measure spliced human XBP1 by using quantitative real-time RT-PCR, and we show that the results obtained with this method correlate with data for BiP and CHOP.
Materials and methods
Cell culture and stimulation
Primary bronchial epithelial cells (PBEC) were isolated from resected lung tissue obtained from patients undergoing surgery for lung cancer as described previously (van Wetering et al. 2000). Briefly, the cells were cultured in a 1:1 mixture of DMEM (Invitrogen, Carlbad, CA, USA) and BEGM (Clonetics, San Diego, CA, USA), supplemented with 0.4% w/v BPE, 0.5 ng/ml EGF, 5 μg/ml insulin, 0.1 ng/ml retinoic acid, 10 μg/ml transferrin, 1 μM hydrocortisone, 6.5 ng/ml T3, 0.5 μg/ml epinephrine (all from Clonetics), 1.5 μg/ml BSA (Sigma, St Louis, MO, USA), 1 mM Hepes (Invitrogen), 100 U/ml penicillin and 100 μg/ml streptomycin (Cambrex, East Rutherford, NJ, USA).
Immortalized human renal PTEC (HK-2, kindly provided by M. Ryan, University College Dublin, Dublin, Ireland) were grown in serum-free DMEM/HAM-F12 (Bio-Whittaker, Walkersville, MD) supplemented with 100 U/ml penicillin, 100 μg/ml streptomycin (Invitrogen, Breda, The Netherlands), insulin (5 μg/ml), transferrin (5 μg/ml), selenium (5 ng/ml), triiodothyronine (40 ng/ml), epidermal growth factor (10 ng/ml), and hydrocortisone (36 ng/ml, all purchased from Sigma, Zwijndrecht, The Netherlands).
Cells from the A549 human lung carcinoma cell line were obtained from the American Type Culture Collection (ATCC, Manassas, VA). The cells were routinely cultured in RPMI 1640 medium (Gibco, Grand Island, NY), supplemented with 2 mM l-glutamine, 100 U/ml penicillin, 100 μg/ml streptomycin (Cambrex, East Rutherford, NJ, USA) and 10% (v/v) heat-inactivated FCS (Gibco) at 37°C in a 5% CO2-humidified atmosphere.
ER stress was induced in epithelial cells by exposure to thapsigargin or tunicamycin. After reaching near-confluence, PBEC were exposed to thapsigargin (50 nM, Sigma) for various time periods. For the dose–response experiment PBEC from 3 different donors were stimulated with various concentrations of thapsigargin or tunicamycin (Sigma) for 6 h. Dimethyl sulfoxide (DMSO) (Merck, Darmstadt, Germany) served as a solvent control for both thapsigargin and tunicamycin. The dose–response experiments were repeated on HK-2 cells and A549 cells with 2 h stimulation instead of 6 h. This shorter duration of exposure in HK-2 and A549 cells was based on pilot experiments using these cell lines.
Total RNA isolation and reverse-transcription
After stimulation the cells were washed twice with PBS and total mRNA was isolated using the RNeasy mini kit (Qiagen, Valencia CA, USA). DNase I amplification grade (Invitrogen) was used to remove genomic DNA. Total RNA concentration and purity were measured on a NanoDrop spectrophotometer (NanoDrop technologies, Wilmington USA). Next, cDNA synthesis was performed with M-MLV Reverse Transcriptase (Promega, Madison WI, USA).
Semi-quantitative RT-PCR
To amplify the spliced and unspliced XBP1 mRNA, XBP1 primers were used as described previously (Yoshida et al. 2001). PCR products were electrophoresed on 2.5% agarose gel. GAPDH (forward 5′GGATGATGTTCTGGAGAGCC3′, reverse 5′CATCACCATCTTCCAGGAGC3′) was used as a loading control. The size difference between the spliced and the unspliced XBP1 is 26 nucleotides.
Real-time RT-PCR
Primers were designed to span the 26 base pair intron that is removed by IRE1 to obtain the spliced XBP1 mRNA (XBP1spl) (forward 5′TGCTGAGTCCGCAGCAGGTG3′ and reverse 5′GCTGGCAGGCTCTGGGGAAG3′). Also specific primers for CHOP (forward 5′GCACCTCCCAGAGCCCTCACTCTCC3′ and reverse 5′GTCTACTCCAAGCCTTCCCCCTGCG3′) and BiP (Hirota et al. 2006) were used. Quantitative PCR was carried out at 95°C for an initial 3 min followed by 40 cycles of denaturation at 95°C for 10 s, annealing at 62°C for 15 s and extension at 72°C for 30 s using IQ SYBRGreen supermix (Bio-Rad, Hercules, CA, USA). Each assay was run on a Bio-Rad CFX Real-time PCR system in triplicates and arbitrary mRNA concentrations were calculated by the Bio-Rad software, using the relative standard curve method. Stable housekeeping genes were selected using the Genorm software (Vandesompele et al. 2002). Relative mRNA concentrations of ATP5B and RPL13A (GeNorm, Primerdesign, Southampton, UK) were used as reference genes to calculate the normalized expression of the XBP1spl mRNA. The identity of the PCR products obtained with the XBP1spl primers was verified by DNA sequencing.
Statistical analysis
The results of the dose–response experiment were expressed as mean±SEM. The correlation coefficient was determined by the use of Pearson’s correlation statistics. The correlation coefficient was considered significant at p values < 0.05.
Results and discussion
Several publications described methods for monitoring ER stress and the UPR, and spliced XBP1 mRNA is generally considered to be a relevant marker for ER stress. However, the semi-quantitative conventional RT-PCR method is currently used to assess the splicing of the XBP1 mRNA. Only Hirota et al. (2006) developed a quantitative real-time RT-PCR method for measuring spliced XBP1, but this method does involve an additional step with a restriction enzyme during the PCR reaction, which we consider to be more laborious and more complex. Both Samali et al. (2010) and Zhao et al. (2011) recently reviewed methods for monitoring ER stress, and recommended the analysis of spliced XBP1 by conventional RT-PCR for detection of ER stress.
In our study, we have designed primers that span the 26 bp intron of the XBP1 mRNA, in order to amplify only the spliced XBP1 mRNA. Because of the similarities between the sequence of the XBP1 mRNA just before this intron and the last part of the intron itself, only a very few options were possible to design a specific forward primer for the XBP1spl mRNA (Fig. 1). We tested the specificity of the XBP1spl primers by sequencing. The PCR product of the thapsigargin-treated, as well as the DMSO-treated cells, both matched the spliced XBP1 mRNA and no unspliced mRNA was detected with the new primers. These results also indicate that in DMSO-treated cells there is a low level of spliced XBP1 mRNA present.
Fig. 1.
Location of the forward XBP1spl primer on the spliced and unspliced XBP1 mRNA
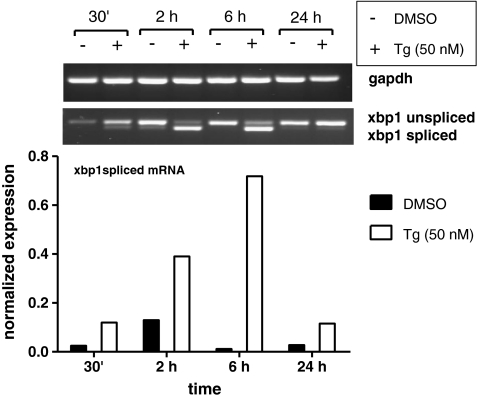
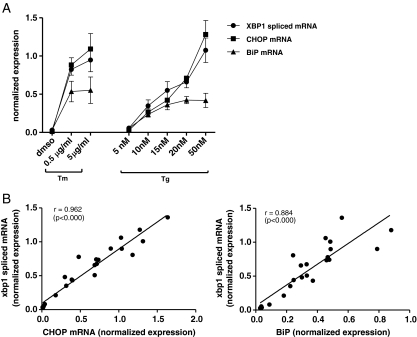
We compared the semi-quantitative conventional RT-PCR method with the newly developed quantitative real-time RT-PCR method by conducting a time course experiment with thapsigargin and DMSO on PBEC. In both methods, the spliced mRNA was mostly expressed after 6 h, and the levels of spliced XBP1 mRNA were found to be comparable between the two methods (Fig. 2). Next, we used the XBP1spl primers to perform a real-time RT-PCR in a dose–response experiment on PBEC, using various concentrations of thapsigargin as well as two concentrations of tunicamycin. In addition, CHOP and BiP mRNA was analyzed and correlated with levels of spliced XBP1 mRNA (Fig. 3a and b). We found a significant and high correlation between CHOP and XBP1spl mRNA (r = 0.962, p < 0.000) as well as between BiP and XBP1spl mRNA (r = 0.884, p < 0.000). Since both CHOP and BiP genes contain an ERSE region which is recognized by the XBP1-protein, a good correlation between the spliced XBP1 and the more downstream ER stress markers CHOP and BiP was anticipated.
Fig. 2.
Effect of thapsigargin exposure for various time periods on XBP1 expression in PBEC. The spliced XBP1 mRNA was mostly expressed after 6 h of stimulation with 50 nM thapsigargin, as shown by conventional RT-PCR (top) as well as by quantitative real-time RT-PCR (bottom)
Fig. 3.
Effect of thapsigargin and tunicamycin on markers of ER stress in PBEC. PBEC were exposed to various concentrations of thapsigargin or tunicamycin for 6 h, and next RNA was isolated for real-time RT-PCR-based detection of spliced XBP1, CHOP and BiP mRNA. The results showed a dose-dependent increase in spliced XBP1 mRNA after exposure to both stimuli (a), that showed a significant correlation with levels of CHOP and BiP mRNA (b). Data are mean±SEM using cells from three different donors (a), and data points represent the result of a single experiment (b)
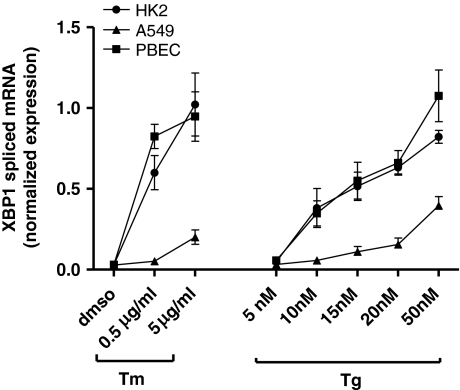
To evaluate whether the new XBP1spl primers could also be used in other cell lines, experiments were performed in two different epithelial cell lines, HK-2 (a proximal tubule epithelial cell line from normal adult human kidney) and A549 (a human lung carcinoma cell line with type II alveolar epithelial cell characteristics). We repeated the dose–response experiments on these cell lines and compared the results with those previously obtained with the PBEC (Fig. 4). We found a dose-dependent increase of spliced XBP1 mRNA in both cell lines, similar to the results found in PBEC.
Fig. 4.
Effect of thapsigargin and tunicamycin on spliced XBP1 mRNA in different cell lines. PBEC, HK-2, and A549 cells were exposed to various concentrations of thapsigargin or tunicamycin, and next RNA was isolated for real-time RT-PCR-based detection of spliced XBP1 mRNA. The results showed a dose-dependent increase in spliced XBP1 mRNA after exposure to both stimuli for all cell lines. Data are mean±SEM using cells from three different donors (PBEC) or three separate experiments (HK-2, A549). XBP1 data for PBEC are the same as those shown in Fig. 3a
In conclusion, the novel real-time RT-PCR method described in this report is a reliable quantitative method to measure spliced human XBP1 mRNA as a marker for ER stress.
Acknowledgments
This work was supported in part by a grant from the Netherlands Asthma Foundation (grant number 3.2.08.032). We like to thank Nicole Schlagwein from the Department of Nephrology, Leiden University Medical Center, Leiden, the Netherlands, for providing the HK-2 cell line.
Open Access
This article is distributed under the terms of the Creative Commons Attribution Noncommercial License which permits any noncommercial use, distribution, and reproduction in any medium, provided the original author(s) and source are credited.
References
- Hirota M, Kitagaki M, Itagaki H, Aiba S. Quantitative measurement of spliced XBP1 mRNA as an indicator of endoplasmic reticulum stress. J Toxicol Sci. 2006;31:149–156. doi: 10.2131/jts.31.149. [DOI] [PubMed] [Google Scholar]
- Ron D, Walter P. Signal integration in the endoplasmic reticulum unfolded protein response. Nat Rev Mol Cell Biol. 2007;8:519–529. doi: 10.1038/nrm2199. [DOI] [PubMed] [Google Scholar]
- Rutkowski DT, Kaufman RJ. A trip to the ER: coping with stress. Trends Cell Biol. 2004;14:20–28. doi: 10.1016/j.tcb.2003.11.001. [DOI] [PubMed] [Google Scholar]
- Samali A, Fitzgerald U, Deegan S, Gupta S. Methods for monitoring endoplasmic reticulum stress and the unfolded protein response. Int J Cell Biol. 2010;2010:830307. doi: 10.1155/2010/830307. [DOI] [PMC free article] [PubMed] [Google Scholar]
- Schroder M, Kaufman RJ. The mammalian unfolded protein response. Annu Rev Biochem. 2005;74:739–789. doi: 10.1146/annurev.biochem.73.011303.074134. [DOI] [PubMed] [Google Scholar]
- van Wetering S, van der Linden AC, van Sterkenburg MA, Rabe KF, Schalkwijk J, Hiemstra PS. Regulation of secretory leukocyte proteinase inhibitor (SLPI) production by human bronchial epithelial cells: increase of cell-associated SLPI by neutrophil elastase. J Investig Med. 2000;48:359–366. [PubMed] [Google Scholar]
- Vandesompele J, de Preter K, Pattyn F, Poppe B, van Roy N, de Paepe A, Speleman F. Accurate normalization of real-time quantitative RT-PCR data by geometric averaging of multiple internal control genes. Genome Biol. 2002;3:RESEARCH0034. doi: 10.1186/gb-2002-3-7-research0034. [DOI] [PMC free article] [PubMed] [Google Scholar]
- Yoshida H, Matsui T, Yamamoto A, Okada T, Mori K. XBP1 mRNA is induced by ATF6 and spliced by IRE1 in response to ER stress to produce a highly active transcription factor. Cell. 2001;107:881–891. doi: 10.1016/S0092-8674(01)00611-0. [DOI] [PubMed] [Google Scholar]
- Zhao H, Yang J, Shan L, Jorgensen ED. Measuring the impact of cigarette smoke on the UPR. Methods Enzymol. 2011;489:147–164. doi: 10.1016/B978-0-12-385116-1.00009-1. [DOI] [PubMed] [Google Scholar]


