Abstract
Background
Right ventricular (RV) failure is a significant complication following implantation of a left ventricular assist device (LVAD). It is therefore important to identify patients at risk a-priori. However, prognostic models derived from multivariate analyses have had limited predictive power.
Methods
This study retrospectively analyzed 183 patient records of LVAD recipients between May 1996 and Oct. 2009; 27 of which later required a right ventricular assist device (RVAD+) and 156 remained on LVAD only (RVAD−) until the time of transplantation or death. A decision tree model was constructed to represent combinatorial nonlinear relationships of the preoperative data that are predictive of the need for RVAD support.
Results
An optimal set of eight preoperative variables were identified: transpulmonary gradient, age, right atrial pressure, international normalized ratio, heart rate, white blood cell count, alanine aminotransferase and the number of inotropic agents. The resultant decision tree, comprised of 28 branches and 14 leaves, identified RVAD+ patients with 85% sensitivity, RVAD− patients with 83% specificity, and exhibited an area under the ROC curve of 0.87.
Conclusions
The decision tree model developed in this study exhibited several advantages over existing risk scores. Quantitatively, it provided improved prognosis of RV support by encoding the nonlinear, synergic interactions among preoperative variables. Because of its intuitive structure, it more closely mimics clinical reasoning and therefore can be more readily interpreted. Further development with additional multi-center, longitudinal data may provide a valuable prognostic tool for triage of LVAD therapy, and potentially improve outcomes.
Keywords: left/right ventricular assist device, right ventricular failure, decision tree, machine learning, decision support
INTRODUCTION
Mechanical circulatory support for end-stage heart failure has become an established therapeutic option with significant survival benefit. However, patients receiving a left ventricular assist device (LVAD) alone periodically develop postoperative right ventricular (RV) failure necessitating pharmacological or mechanical support. This applies to approximately 10 to 30% of all LVAD patients1–4, and is associated with increased morbidity and mortality5. Severe RV failure results in renal and hepatic dysfunction due to elevated central venous pressure as well as under-filling of the LVAD6. Postoperative RV failure also adversely affects outcomes of patients who are ultimately bridged to transplant3, 7, 8.
Conversely, implanting an RVAD bears its own risk of increased morbidity9, effectively doubling the likelihood of thrombosis, infection, and mechanical failure. Therefore, the prediction of RV failure prior to VAD implantation is critically important to optimal course of treatment and clinical outcome. This prognosis is sometimes obscured by the complex interaction between pre-operative conditions, intra-operative factors, and immediate post-operative hemodynamic status9–11. Consequently, previous predictors of RV failure based on uni- and multi-variate statistical analyses1, 3, 5, 11–16 have not provided adequate sensitivity and specificity for practical use. For example, a popular right ventricular failure risk score (RVFRS)11 that has demonstrated high positive predictive value (80%) of RV failure in LVAD candidates (based on a threshold value of 5.5), reports an overall sensitivity of only 35%. Furthermore the performance of this index is prognostically inconsistent when evaluated on independent samples. Thus there remains a need for a more accurate, sensitive, specific, and robust method to identify LVAD candidates at risk for RV failure.
This study aimed to develop an improved prognostic tool by capitalizing on recent advances in data mining and machine learning theory. These techniques are gaining popularity to predict future trends and discover unknown patterns in clinical outcomes, including breast cancer, pneumonitis17, 18 and others19–21. The Decision Tree is one such algorithm that has been used extensively in medicine22–25. It has proven to be reliable and effective, providing high classification accuracy with a simple representation of gathered knowledge. Because of its tree structure, it can be readily interpreted and therefore more likely to be adopted than, say, an ambiguous numerical risk score26. This study employed the decision tree algorithm in combination with over-sampling and feature selection techniques to identify and represent the nonlinear interactions between preoperative variables.
METHODS
Study Design
This study retrospectively analyzed 183 de-identified patient enrolled in Artificial Heart Program at the University of Pittsburgh Medical Center (UPMC) from May 1996 to Oct. 2009. These patients initially received an LVAD, but 27 (15%) later required a RVAD (RVAD+) and 156 (85%) remained on LVAD until the time of transplantation or death (RVAD−). Multiple devices were used throughout this time period (Table 1 and Table 2) including: BVS 5000 and AB 5000 (Abiomed, Danvers, MA), Bio-Medicus Perfusion System (Medtronic, Inc., Minneapolis, MN), Novacor (Worldheart, Salt Lake City, Utah), CentriMag, HeartMate XVE, Thoratec IVAD, Thoratec PVAD, HeartMate II (Thoratec, Pleasanton, CA), Jarvik 2000 (Jarvik Heart, Inc., New York, NY), and Ventrassist (Ventracor Limited, Chatswood, Australia). Among these, the initial pulsatile-flow LVADs comprised 78.1% (n=143) of the total cohort with 121 RVAD+ and 22 RVAD− patients; continuous-flow LVADs comprised 21.9% (n=40) with 35 RVAD+ and 5 RVAD− patients, respectively.
Table 1.
Devices utilized in the RVAD− group.
| Pulsatile | 121 (77.6%) |
| Abiomed AB 5000 | 6 (3.8%) |
| Novacor | 43 (27.6%) |
| HeartMate XVE | 33 (21.2%) |
| Thoratec IVAD | 6 (3.8%) |
| Thoratec PVAD | 33 (21.2%) |
| * Continuous Flow | 35 (22.4%) |
| HeartMate II | 15 (9.6%) |
| JARVIK 2000 | 2 (1.3%) |
| Ventrassist | 18 (11.5%) |
| Total | 156 |
lists the number (percentage) of patients with initial continuous-flow LVAD in RVAD− group.
Table 2.
Device combination utilized in the RVAD+ group.
| RVAD Device | LVAD Device | N (%) |
|---|---|---|
| ABIOMED BVS 5000 | Abiomed AB 5000 | 2 (7.4%) |
| ABIOMED BVS 5000 | Novacor | 1 (3.7%) |
| Biomedicus | HeartMate XVE | 1 (3.7%) |
| CentriMag | * HeartMate II | 3 (11.1%) |
| CentriMag | Thoratec IVAD | 1 (3.7%) |
| CentriMag | Thoratec PVAD | 3 (11.1%) |
| CentriMag | * Ventrassist | 1 (3.7%) |
| Thoratec PVAD | * HeartMate II | 1 (3.7%) |
| Thoratec PVAD | HeartMate XVE | 2 (7.4%) |
| Thoratec PVAD | Novacor | 3 (11.1%) |
| Thoratec PVAD | Thoratec PVAD | 9 (33.3%) |
| Total | 27 |
indicates the cases with initial continuous-flow LVAD in RVAD+ group (n=5 in total.)
A total of 39 preoperative variables were selected based on a survey of the literature and their availability in the patient records, categorized as follows: patient demographics (n=6), hemodynamics (n=14), blood chemistry and hematologic laboratory values (n=13) and medications (n=6) including digoxin, angiotensin-converting enzyme inhibitors/angiotensin II receptor antagonists, beta-blocker, antiarrhythmics and inotropic agents (See Table 3.) Data were reviewed retrospectively the UPMC Transplant Patient Management System (TPMS), a password-protected, HIPAA compliant, IRB approved, web-based data repository for all patients who receive mechanical circulatory support. Data were extracted from preoperative day 14 to 1. For variables with multiple values, the value closest to the time of surgery was used. In circumstances where data elements were missing, various interpolation techniques (mean, median, nearest neighbor) were implemented, indicated in Table 3. The primary end point was whether the LVAD patient received an RVAD implantation subsequent to the index LVAD surgery and the secondary end point was 1-year survival.
Table 3.
Pre-implant characteristics for two groups of patients.
| RVAD− (n=156) mean (±std) | RVAD+ (n=27) mean (±std) | p-value | |
|---|---|---|---|
| Demographics | |||
| Age (yrs) | 53.3 (±12.7) | 49.9 (±10.5) | † 0.04 |
| female (%) | 14% | 37% | † 0.01 |
| Pulsatile-flow LVAD (%) | 78% | 81% | 0.80 |
| Body mass index (kg/m2) – mean | 28.2 (±6.1) | 27.8 (±5.4) | 0.99 |
| Weight (kg) – 15nn | 89.3 (±21.7) | 76.0 (±17.3) | 0.06 |
| Ischemic etiology (%) | 54% | 56% | 0.99 |
| Hemodynamics | |||
| Cadiac index (liter/min/m2) – 20nn | 2.3 (±0.8) | 2.3 (±0.8) | 0.80 |
| Cardiac output (liter/min) – 10nn | 4.3 (±1.0) | 4.3 (±1.4) | 0.22 |
| Pulmonary capillary wedge pressure (mmHg) –10nn | 26.6(±8.4) | 24.2(±8.9) | 0.42 |
| Transpulmonary gradient (mmHg) – 10nn | 11.3 (±6.0) | 13.4 (±3.9) | 0.10 |
| Pulmonary vascular resistance (wood units) – mean | 2.2 (±2.6) | 3.6 (±1.7) | 0.35 |
| Mean pulmonary artery pressure (mmHg) – 7nn | 38.1 (±9.4) | 37.8 (±10.8) | 0.86 |
| Pulmonary arterial systolic pressure (mmHg) – 10nn | 55.6 (±14.6) | 56.8 (±16.8) | 0.81 |
| Pulmonary arterial diastolic pressure (mmHg) –10nn | 27.4 (±8.2) | 26.8 (±9.8) | 0.75 |
| Right atrial pressure (mmHg) – 10nn | 12.1 (±6.2) | 9.9 (±6.1) | 0.26 |
| Right ventricular diastolic pressure (mmHg) – 10nn | 10 (±6.3) | 11 (±7.0) | 0.70 |
| Right ventricular systolic pressure (mmHg) – 5nn | 54.4 (±15.8) | 56.4 (±14.2) | 0.67 |
| Pulmonary arterial oxygen saturation (%) – 15nn | 51.8 (±12.7) | 53.7 (±13.8) | 0.53 |
| Heart rate (beat/min) – 15nn | 93.0 (±25.1) | 81.3 (±28.5) | 0.18 |
| Intra aortic balloon pump (%) – mean | 76% | 74% | 0.81 |
| Laboratory tests | |||
| Creatinine (mg/dL) – 15nn | 1.5 (±0.7) | 1.4 (±0.7) | 0.23 |
| Blood urea nitrogen (mg/dL) – 15nn | 32.0 (±20.5) | 28.6 (±18.9) | 0.37 |
| Aspartate aminotransferase (IU/L) – 7nn | 83.7 (±162.8) | 60.7 (±50.6) | 0.47 |
| Alanine asminotransferase (IU/L) – 15nn | 92.8 (±174.1) | 53.5 (±36.3) | 0.76 |
| Total bilirubin (mg/dL) – 15nn | 1.2 (±0.9) | 1.4 (±1.6) | 0.75 |
| Hematocrit (%) – 15nn | 33 (±7.0) | 35 (±7.4) | 0.34 |
| White blood cell count (109/L) – 10nn | 9.4 (±3.9) | 11.8 (±7.3) | 0.16 |
| Platelet count (109/L) – 20nn | 207.7 (±78.8) | 187.7 (±94.0) | 0.23 |
| International normalized ratio – 15nn | 1.3 (±0.4) | 1.5 (±0.7) | 0.48 |
| Hemoglobin (g/dL) – 20nn | 13.8 (±10.4) | 14.6 (±10.1) | 0.30 |
| Albumin (g/dL) – 5nn | 3.3 (±0.6) | 3.4 (±0.8) | 0.46 |
| Prothrombin time (sec) – mean | 56.6 (±28.7) | 58.3 (±29.6) | 0.92 |
| Sodium (MEQ/L) – median | 134.2 (±5.8) | 133.5 (±5.8) | 0.58 |
Imputing methods indicated following dash line.
nn: nearest neighbor.
Analysis
The set of pre-operative variables was first ranked by Chi-Square analysis, and then combined into incrementally sized subsets (n=1, 2,…, 39). Further analyses were performed on each of the subsets to determine the optimal set that provided sufficient information without overfitting. A well-known decision tree algorithm, C4.5, was employed, implemented in an open-source software library27 (WEKA, J48, University of Waikato, New Zealand). This analysis uses recursive partitioning methods to separate the two groups of patients into distinct subsets by identifying the significant nonlinear interactions among the pre-operative variables and automatically constructing the decision branches. The corresponding breakpoints for each of the variables were selected with the criterion of maximization the purity of the cohort after splitting. The algorithm also includes a “pruning” procedure to reflexively eliminate unnecessary branches, reduce the estimated errors and generalize the model. The objective function for this analysis was to minimize the error between predicted and historical decision of RVAD implantation (RVAD+/RVAD−, defined above.) It was assumed here that the clinical cost of failing to initially implant an RVAD in a patient who develops RV failure is comparable to the cost of implanting an RVAD unnecessarily. Synthetic Minority over Sampling Technique (SMOTE)28–30 was applied to supplement the RVAD+ data to compensate for the imbalanced ratio of RVAD+ to RVAD− in the current cohort (1:6) and avoid unintended bias in the calculation of error rate.
Ten-fold cross-validation was used to evaluate the predictive performance of decision tree model, whereby the data was divided into 10 mutually exclusive subsets, nine of which were used for training and one for evaluation. This was repeated ten times, thereby employing ten different, but overlapping training sets, and 10 unique testing sets. The performance measures for evaluation of the decision tree analysis were: (1) true positive rate, RVAD+/+ (in which the algorithm agrees with historical clinical decision to implant an RVAD); (2) true negative rate, RVAD−/− (in which both agree to forgo an RVAD), (3) false positive rate, RVAD−/+ (in which the model predicts RVAD implantation while historical decision forwent RVAD), and (4) false negative rate, RVAD+/− (in which the model prediction disagreed with the historical decision of RVAD implantation.) Additional measures of performance were the area under the receiver operating characteristic (ROC) curve and kappa statistics. The specificity and sensitivity of the model were defined as the RVAD−/− and RVAD+/+ rates, respectively. To investigate the dependence of late-RVAD implantation on the generation of the initial LVAD, the above analysis was repeated on the subgroups of patients with initial pulsatile-flow LVAD (n=143) and initial continuous-flow LVAD (n=40).
The performance in terms of survival was provided by Kaplan-Meier analysis. Differences in actuarial survival were evaluated using log-rank test. For comparison, the University of Michigan Right Ventricular Failure Risk Score (RVFRS)11 was also calculated for each patient, which stratified the cohort according to the published definition. Standard ROC curves were constructed to illustrate overall sensitivity and specificity.
RESULTS
Baseline data and comparison between RVAD− (n=156) and RVAD+ (n=27) groups are summarized in Table 3. The RVAD+ group included 8 (30%) CentriMag, 3 (11%) Abiomed BVS 5000, 1 (4%) Biomedicus RVAD and 15 (55%) Thoratec PVAD. The demographics, hemodynamic and laboratory data were typical of patients with advanced heart failure and were similar between RVAD− and RVAD+ groups. The RVAD+ group was younger (50 versus 53; p=0.04) and had a higher proportion of women (37% versus 15% overall; p=0.01). Pearson product-moment pairwise analysis identified 2 variables that were significantly positively correlated with the need of post-RVAD individually: female gender and elevated white blood cell (WBC) count (RVAD−: 9.4 ±3.9*109/L vs. RVAD+: 11.8 ±7.3*109/L). Pre-operative weight was inversely correlated with the late-use of RVAD, (RVAD−: 89.3 ±21.7 kg vs. RVAD+: 76.0 ±17.3 kg). The corresponding correlation coefficients and 95% confidence intervals are summarized in Table 4, which demonstrates significant differences between groups (p<0.05) but generally weak correlations (≪ 1).
Table 4.
Pre-operative variables significantly correlated with late-RVAD support.
| Pre-operative variables | Late-RVAD support | ||
|---|---|---|---|
| Correlation | 95% CI | Significant Probability | |
| Gender | 0.21 | (0.07, 0.35) | 0.004 |
| WBC | 0.18 | (0.04, 0.32) | 0.012 |
| Weight | −0.16 | (−0.29, −0.01) | 0.004 |
Decision Tree Model
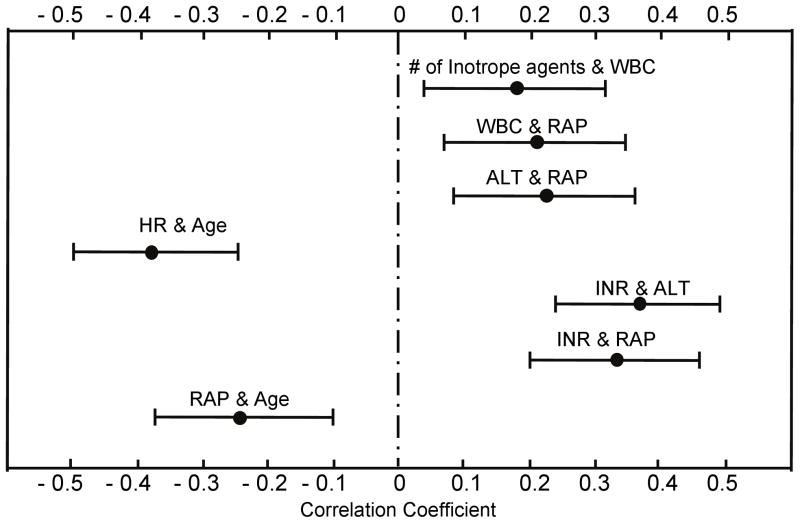
Feature selection resulted in 8 pre-operative variables comprising the decision tree model for the complete cohort: transpulmonary gradient (TPG), age, right atrial pressure (RAP), international normalized ratio (INR), heart rate (HR), white blood cell count (WBC), alanine aminotransferase (ALT) and the number of inotropic agents (# inotrope). Pearson product-moment pairwise analysis identified seven significant correlations (p<0.05): # inotrope was positively correlated with WBC, which indicated that elevated WBC was associated with a greater number of inotropic agents. Similar observations were found between WBC and RAP, ALT and RAP, INR and ALT as well as INR and RAP. Yet, RAP and HR were inversely correlated with age, which reflects younger patients tending to have greater RAP and HR in this cohort. Figure 1 shows the corresponding correlation coefficients as well as 95% confidence intervals.
Figure 1.
Significant correlations among the pre-operative variables involved in the decision tree. 95% confidence intervals of correlation coefficients were indicated.
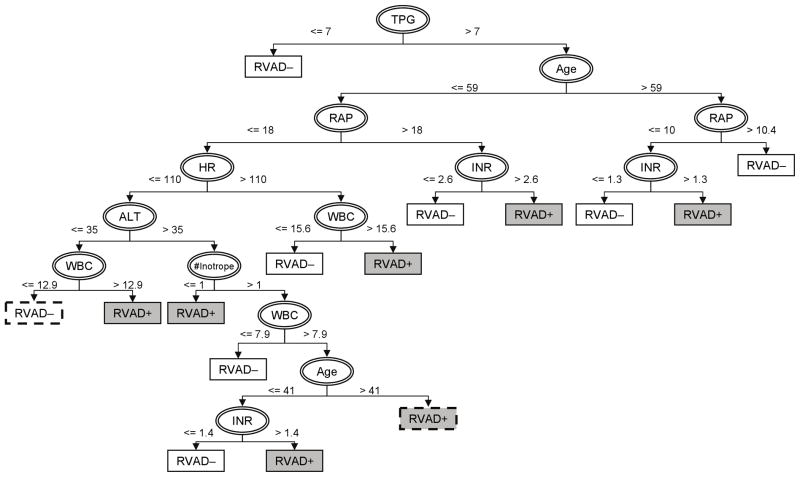
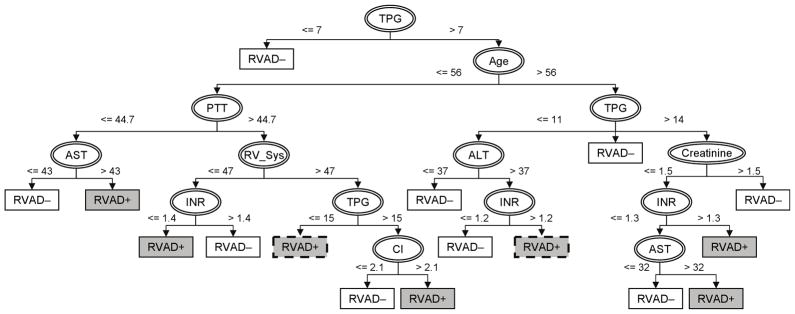
The resulting decision tree built upon the above dataset with 5X synthetic RVAD+ samples is provided in Figure 2. In this model, TPG is the initial splitting feature with a breakpoint of 7 mmHg. The branch of TPG ≤ 7 mmHg predicts no need of RVAD support; and the branch of TPG > 7 mmHg leads to age as the secondary splitting feature with a breakpoint of 59. On the third level, there exist different thresholds of RAP depending on age: 18 mmHg (≤ 59yo), 10 mmHg (> 59yo). This demonstrates the apparent nonlinear relationship among these pre-operative features. Thereafter, additional splits unveil the complicated patterns embedded in the RVAD+ and RVAD− data sets. The tree eventually terminates in a total of 14 leaves representing one of two outcomes (RVAD− or RVAD+). This model indicates that elevated INR and/or WBC are common to the branches with increased risk of the need of RVAD support. This model achieved 85% sensitivity, 83% specificity (See Table 5a.)
Figure 2.
Decision tree for optimal identification of RVAD support in LVAD patients. Features used for splitting the cohort are indicated by ellipses. Rectangles indicate the predicted outcomes following corresponding branches (white: freedom of RVAD support; gray: necessity of RVAD; dashed borderline: simplified leaves.)
Table 5.
The expected performance of aggregate model. Predictive outcomes are suggested by the model; clinical decisions are made by the experts in hospital.
| (a) Performance evaluated on the complete cohort (n=183.)
| |||
|---|---|---|---|
| CLINICAL DECISION
|
|||
| RVAD+ | RVAD− | ||
| PREDICTION | RVAD+ | RVAD+/+ (True Positive) | RVAD−/+ (False Positive) |
| Sensitivity: 85% | False Positive Rate: 17% | ||
|
| |||
| RVAD− | RVAD+/− (False Negative) | RVAD−/− (True Negative) | |
| False Negative Rate: 15% | Specificity: 83% | ||
| (b) Performance evaluated on the sub-group with initial continuous-flow LVAD (n=40.)
| |||
|---|---|---|---|
| CLINICAL DECISION
|
|||
| RVAD+ | RVAD− | ||
| PREDICTION | RVAD+ | RVAD+/+ (True Positive) | RVAD−/+ (False Positive) |
| Sensitivity: 80% | False Positive Rate: 20% | ||
|
| |||
| RVAD− | RVAD+/− (False Negative) | RVAD−/− (True Negative) | |
| False Negative Rate: 14% | Specificity: 86% | ||
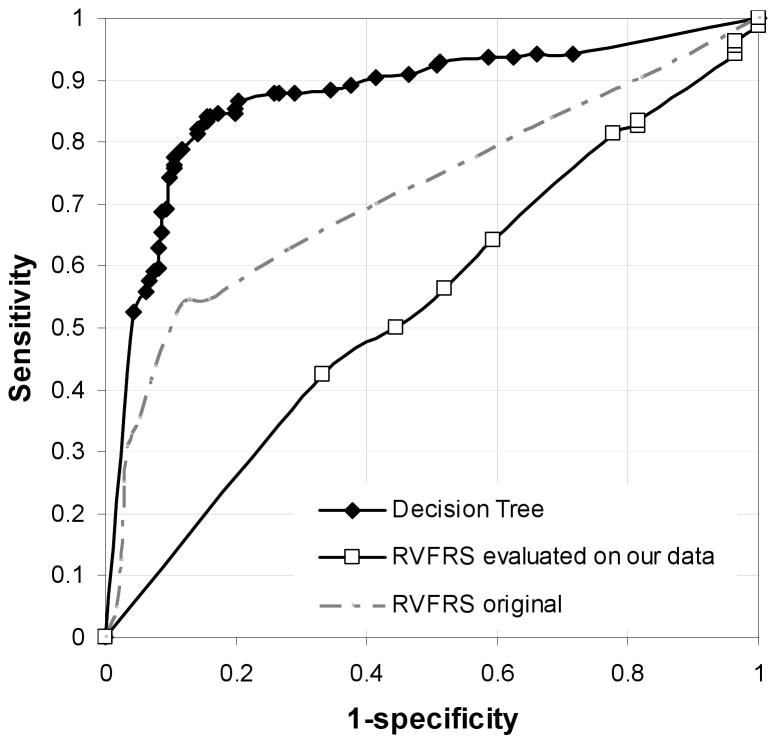
Receiver operating characteristic curves were generated for both the decision tree model and the RVFRS calculated for this cohort (See Figure 3.) Comparison of AUC showed that decision tree exhibited better performance than RVFRS on this cohort of patients (AUC: 0.87 versus 0.54.) The figure also depicts the RVFRS ROC curve reported in Matthews et al. in which the reported AUC is 0.7311. Applying this weighted score on the present cohort, it was found that 18.5% RVAD+ patients were identified as high risk, 64.1% RVAD− as low risk leaving 22.2% RVAD+ patients and 19.2% RVAD− patients as medium risk.
Figure 3.
ROC curve of our decision tree model, RVFRS evaluated on our cohort and RVFRS published in Matthews et al.’s study11.
Survival Outcome
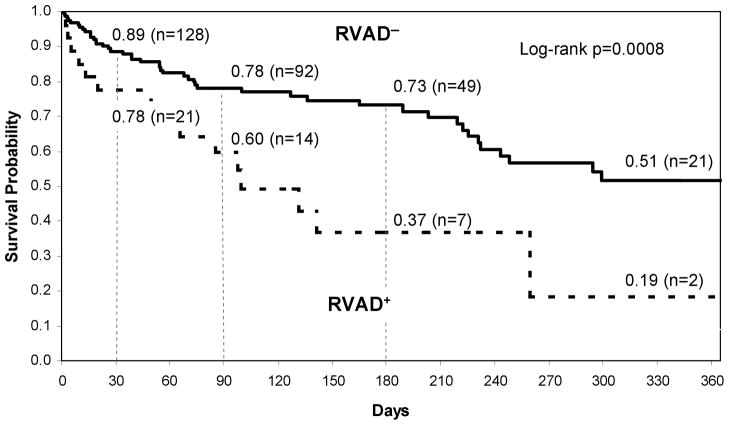
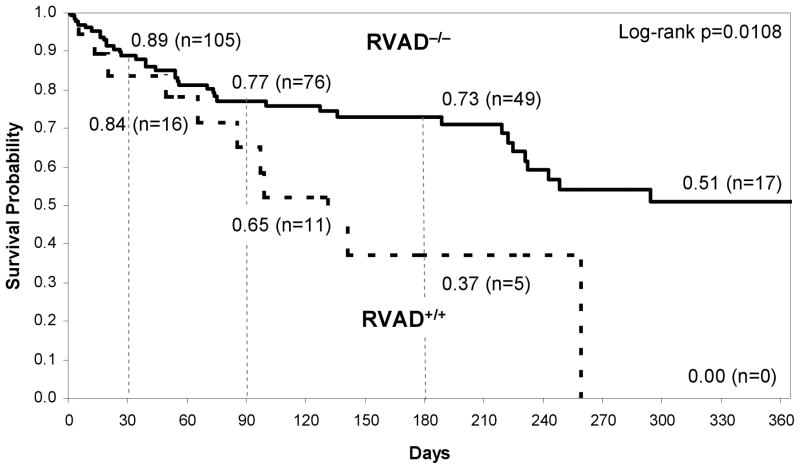
Kaplan Meier 1-year survival curves of the two groups of patients with respect to historical decisions of RVAD− and RVAD+ are provided in Figure 4 (log rank p = 0.0008). Thirty-day post-LVAD survival for the RVAD− and RVAD+ groups were 89% and 78% respectively. The corresponding survivals at 90 days were 78% and 60%, respectively, and at 180 days 73% and 37%. Survival at 1 year was 51% and 19%, respectively. Figure 5 provides the survival curves for the subset of patients belonging to RVAD−/− and RVAD+/+ groups. Compared to Figure 4, short-term post-LVAD survivals between the groups were similar: 89%, 84% at 30 days and 77%, 65% at 90 days respectively. However, the 1-year survivals are much more distinct: 51% for RVAD−/− and 0% RVAD+/+. The overall curves were found to be statistically different (log rank p = 0.0108).
Figure 4.
Kaplan Meier survival curve for retrospective clinical decision RVAD+ and RVAD− patients.
Figure 5.
Kaplan-Meier survival curve for RVAD+/+ patients and RVAD−/− patients.
Comparison of First and Second Generation LVAD
In the subgroup of patients receiving continuous flow continuous-flow (second generation) LVAD the incidence of late-RVAD implantation was relatively lower than those who received a pulsatile-flow (first generation) LVAD: 12.5% versus 15.4%. The performance of the aggregate model (Figure 2) with this sub-group was: 80% sensitivity and 86% specificity, which was similar to the full cohort. (See Table 5b.) The decision tree model developed exclusively on the continuous-flow cohort re-prioritized the predictive variables, promoting the importance of body mass index (BMI), cardiac output (CO), and diastolic pulmonary artery pressure (PA_Dia). It also demoted the prognostic values of INR and WBC. It exhibited 100% sensitivity and 97% specificity based on 10-fold cross validation. However, when tested on the pulsatile-flow LVAD group, it exhibited only 18% sensitivity (RVAD+/+) and 84% specificity (RVAD−/−). Similarly, the model developed exclusively with the subset of patients with initial pulsatile-flow (first generation) LVAD performed poorly when tested on the continuous-flow LVAD group, exhibiting 20% sensitivity (RVAD+/+) and 89% specificity (RVAD−/−).
DISCUSSION
The complex pathophysiology of post-operative RV failure11 and care31 makes the pre-operative prediction of RV failure difficult and hinders the optimal course of treatment for an individual candidate8, 10, 31, 32. In lieu of sole univariate analysis or traditional linear multivariate analysis, the current study sought to develop a decision tree to facilitate the identification of patients who may require RV support. As contrasted to a weighted combination of independent variables, the decision tree is better able to represent the complicated, nonlinear relationships and synergy between variables that underlie the development of RV failure after LVAD implantation. An added benefit of the decision tree model is its ability to graphically illustrate the prediction logic – as compared a purely mathematically derived index that requires “blind faith” of the decision-maker.
The decision tree presented here includes predictive pre-operative variables that are supported by previous right ventricular failure studies and further reveals potentially counter-intuitive dependencies on variables not previously emphasized. For example, the first splitting variable found by the model, elevated TPG, has been previously identified as a significant predictor of right ventricular dysfunction after LVAD implantation33. However, the decision tree model further qualifies this splitting criterion for instances in which TPG is greater than 7 mmHg, in which case additional factors should be taken into consideration. While this cut point would not appear to be clinically relevant, particularly with respect to historical linear analyses, the current study suggests that even modest elevation of TPG may impart risk when taken into consideration with other variables. Likewise, age, also identified by Fukamachi to be an important predictor15, appears twice in the decision tree, in each case further qualified by subordinate variables. INR, also previously correlated with RV failure2, 11, 16, is incorporated into the decision tree in a somewhat complex fashion. For example, for a patient with TPG > 7 mmHg, age < 59, and RAP > 18 mmHg, and elevated INR > 2.6 the model indicates the need of an RVAD; yet for a patient with the same profile except RAP < 18 mmHg, the prediction is much more complicated, and depends on HR, WBC, ALT and # inotropes. This interdependence of variables may possibly reflect their causality: for example it is less likely that elevated INR contributes directly to RV failure than it is indicative of other underlying pathologies that adversely effect outcomes. Accordingly, the model does not imply that altering a patient’s INR would affect the risk of RV failure. Rather, it is more likely that prevailing condition leading to a high INR is further associated with multiple other physiologic abnormalities that eventually culminate in RV failure. Being a retrospective study, it is impossible to eliminate the bias potentially introduced by the “human in the loop.”
The present study also revealed that multiple decision tree structures may provide equivalent results. (See, for example the decision tree of Figure 6 which is a variant of the present model with comparative performance to the model shown in Figure 2.) This non-uniqueness can be considered an asset inasmuch as it accommodates multiple sets of data elements. Therefore the user may select from an assortment of decision trees most consistent with the (limited) data available.
Figure 6.
A variant of the aggregate Decision Tree model with comparative performance to the model shown in Figure 2 (white: freedom of RVAD support; gray: necessity of RVAD; dashed borderline: simplified leaves.)
Although not reported here, it is intuitive that the performance of the decision tree would deteriorate as data elements are excluded. Conversely, the addition of more sensitive indices of RV function, such as echo-derived ejection-phase metrics34 would improve the decision tree. But again, in practical situations, the data are often incomplete; and therefore the decision tree can make the best use of the limited data available – in contradistinction to existing functional scores that cannot be computed without each of the component data elements.
It is important to note that the objective function for this study was the “error” between prediction and eventual decision, as contrasted with a definitive measure of RV failure. Therefore, the model as it stands serves essentially to replicate expert judgment prior to LVAD insertion. Its clinical utility in its present form is twofold: (1) to codify best practices within a single institution, and perhaps alert the clinician or practice when an initial evaluation prior to LVAD insertion is at variance with the model, and (2) to transfer expertise from experienced, successful medical centers to those less experienced. The single-center experience might negatively impact the generality of this model, and the reader is cautioned from blindly extrapolating these results to their clinical service. Until the model has been calibrated and validated on a multi-center data set, the reader would be advised to repeat the analysis with data from their own VAD program to assure consistency before it is employed in clinical practice.
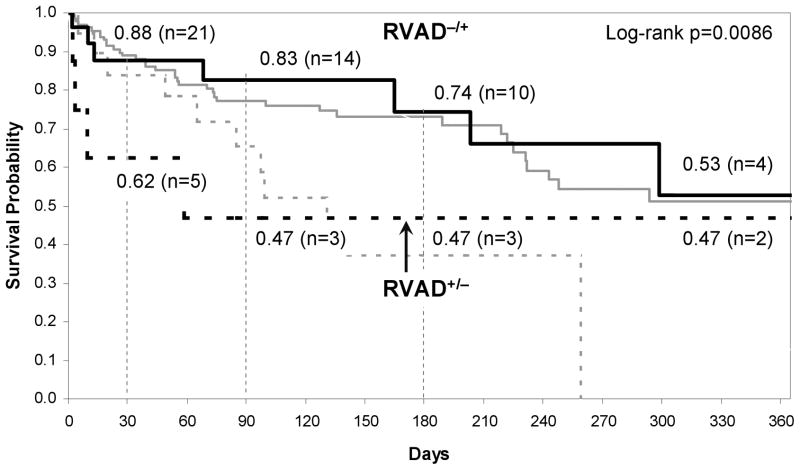
A related limitation is the very definition of what constitutes RV failure, which is a continuum of disease with varying severity, and which has changed over the extended time course of this study, and is also somewhat subjective, hence influenced by institutional bias. This study assumed that the expert decisions represented ground truth, i.e. “more correct” than the model. This would imply that additional, perhaps subconscious, factors35 may have been overlooked by the model. This applies to both the set of independent variables, and to the definition of optimal outcome. In this regard, it is intriguing to consider the cases in which the model disagreed with the historical clinical decision (See Figure 7.) Those that the model predicted the need for RVAD but in which the patient did not receive one (RVAD−/+) appear to have very similar survival characteristics to RVAD−/−. In these cases, it may be concluded that the expert decision was correct, and the model incorrect. Those patients who did receive an RVAD contrary to the model prediction (RVAD+/−) faired much more poorly than those RVAD recipients for whom the model and expert agreed (RVAD+/+). Early mortality was far more common in this, albeit small, subset of eight patients. However two patients who survived past the critical 90 day period exhibited similar 1 year survival as the RVAD- cohort. It is difficult to explain this disparity without knowledge of the patient history and re-examination of the raw data. This illustrates that clinical judgment cannot be defined in terms of pure mathematics35. There are many circumstances in which a bi-ventricular assistance is plainly obvious, such as the presentation of ventricular tachycardia, cardiogenic shock with multi-organ failure or confounding issues such as a ventricular septal defect. Likewise there are circumstances in which an RVAD is clearly unnecessary and does not require a computer to make a decision. The practical utility of a decision support model therefore may be to discriminate the marginal cases: to determine who will recover with a temporary RVAD and who will require chronic support. While this is beyond the scope of the current report, it is clearly the most likely instance where a decision support model can make a clinical impact.
Figure 7.
Kaplan-Meier survival curve for RVAD−/+ patients and RVAD+/− patients, superimposed the survival curves of RVAD−/− and RVAD+/+ (gray line).
Future improvements to this model will inevitably require additional complexity and sophistication. It would also clearly benefit from enlarging the data set and inclusion of more patients from multiple centers being implanted with the current generation of LVAD technology, which would alleviate many of the deficits caused by the limited patient cohort and single center experience. A prospective study would allow differentiation between various degree of RV failure, the need for short-term versus long-term support, eliminate subjectivity and related institutional bias, and allow focus on more modern LVAD devices, rather than the wide assortment devices spanning from 1996 to 2009.
Acknowledgments
The research was supported in part by NIH grant R01HL086918-01. Special thanks to Michelle D. Navoney who de-identified patient records for this study.
Footnotes
Publisher's Disclaimer: This is a PDF file of an unedited manuscript that has been accepted for publication. As a service to our customers we are providing this early version of the manuscript. The manuscript will undergo copyediting, typesetting, and review of the resulting proof before it is published in its final citable form. Please note that during the production process errors may be discovered which could affect the content, and all legal disclaimers that apply to the journal pertain.
References
- 1.Dang NC, Topkara VK, Mercando M, et al. Right heart failure after left ventricular assist device implantation in patients with chronic congestive heart failure. J Heart Lung Transplant. 2006;25:1–6. doi: 10.1016/j.healun.2005.07.008. [DOI] [PubMed] [Google Scholar]
- 2.Potapov EV, Stepanenko A, Dandel M, et al. Tricuspid Incompetence and Geometry of the Right Ventricle as Predictors of Right Ventricular Function After Implantation of a Left Ventricular Assist Device. Journal of International Society of Heart and Lung Transplantation. 2008;27:1275–81. doi: 10.1016/j.healun.2008.08.012. [DOI] [PubMed] [Google Scholar]
- 3.Morgan JA, John R, Lee BJ, Oz MC, Naka Y. Is severe right ventricular failure in left ventricular assist device recipients a risk factor for unsuccessful bridging to transplant and post-transplant mortality. Annual of Thoracic Surgery. 2004;77:859–63. doi: 10.1016/j.athoracsur.2003.09.048. [DOI] [PubMed] [Google Scholar]
- 4.Furukawa K, Motomura T, Nosé Y. Right Ventricular Failure After Left Ventricular Assist Device Implantation: The Need for an Implantable Right Ventricular Assist Device. Artificial Organs. 2005;29:369–77. doi: 10.1111/j.1525-1594.2005.29063.x. [DOI] [PubMed] [Google Scholar]
- 5.Kavarana MN, Pessin-Minsley MS, Urtecho J, et al. Right ventricular dysfunction and organ failure in left ventricular assist device recipients: a continuing problem. The Annals of thoracic surgery. 2002;73:745–50. doi: 10.1016/s0003-4975(01)03406-3. [DOI] [PubMed] [Google Scholar]
- 6.Lietz K, Miller LW. Patient selection for left-ventricular assist devices. Current opinion in cardiology. 2009;24:246–51. doi: 10.1097/HCO.0b013e32832a0743. [DOI] [PubMed] [Google Scholar]
- 7.Kormos RL, Gasior TA, Kawai A, et al. Transplant candidate’s clinical status rather than right ventricular function defines need for univentricular versus biventricular support. The Journal of thoracic and cardiovascular surgery. 1996;111:773–82. doi: 10.1016/s0022-5223(96)70337-9. discussion 82–3. [DOI] [PubMed] [Google Scholar]
- 8.Farrar DJ, Hill JD, Pennington DG, et al. Preoperative and postoperative comparison of patients with univentricular and biventricular support with the thoratec ventricular assist device as a bridge to cardiac transplantation. The Journal of thoracic and cardiovascular surgery. 1997;113:202–9. doi: 10.1016/S0022-5223(97)70416-1. [DOI] [PubMed] [Google Scholar]
- 9.El-Banayosy A, Arusoglu L, Kizner L, et al. Predictors of survival in patients bridged to transplantation with the thoratec VAD device: a single-center retrospective study on more than 100 patients. J Heart Lung Transplant. 2000;19:964–8. doi: 10.1016/s1053-2498(00)00174-1. [DOI] [PubMed] [Google Scholar]
- 10.Schmid C, Radovancevic B. When should we consider right ventricular support? The Thoracic and cardiovascular surgeon. 2002;50:204–7. doi: 10.1055/s-2002-33103. [DOI] [PubMed] [Google Scholar]
- 11.Matthews JC, Koelling TM, Pagani FD, Aaronson KD. The right ventricular failure risk score a pre-operative tool for assessing the risk of right ventricular failure in left ventricular assist device candidates. Journal of the American College of Cardiology. 2008;51:2163–72. doi: 10.1016/j.jacc.2008.03.009. [DOI] [PMC free article] [PubMed] [Google Scholar]
- 12.Santambrogioa L, Bianchia T, Fuardoa M, et al. Right ventricular failure after left ventricular assist device insertion: preoperative risk factors. Interact CardioVasc Thorac Surg. 2006;5:379–82. doi: 10.1510/icvts.2006.128322. [DOI] [PubMed] [Google Scholar]
- 13.Ochiai Y, McCarthy PM, Smedira NG, et al. Predictors of severe right ventricular failure after implantable left ventricular assist device insertion: analysis of 245 patients. Circulation. 2002;106:I198–202. [PubMed] [Google Scholar]
- 14.Kormos RL, Teuteberg JJ, Pagani FD, et al. Right ventricular failure in patients with the HeartMate II continuous-flow left ventricular assist device: incidence, risk factors, and effect on outcomes. The Journal of thoracic and cardiovascular surgery. 2010;139:1316–24. doi: 10.1016/j.jtcvs.2009.11.020. [DOI] [PubMed] [Google Scholar]
- 15.Fukamachi K, McCarthy PM, Smedira NG, Vargo RL, Starling RC, Young JB. Preoperative risk factors for right ventricular failure after implantable left ventricular assist device insertion. The Annals of thoracic surgery. 1999;68:2181–4. doi: 10.1016/s0003-4975(99)00753-5. [DOI] [PubMed] [Google Scholar]
- 16.Fitzpatrick JR, 3rd, Frederick JR, Hsu VM, et al. Risk score derived from pre-operative data analysis predicts the need for biventricular mechanical circulatory support. J Heart Lung Transplant. 2008;27:1286–92. doi: 10.1016/j.healun.2008.09.006. [DOI] [PMC free article] [PubMed] [Google Scholar]
- 17.Green AR, Garibaldi JM, Soria D, et al. Identification and definition of novel clinical phenotypes of breast cancer through consensus derived from automated clustering methods. Breast Cancer Research. 2008;10:S36–S. [Google Scholar]
- 18.Das SK, Chen SF, Deasy JO, Zhou SM, Yin FF, Marks LB. Combining multiple models to generate consensus: Application to radiation-induced pneumonitis prediction. Medical Physics. 2008;35:5098–109. doi: 10.1118/1.2996012. [DOI] [PMC free article] [PubMed] [Google Scholar]
- 19.Verduijn M, Rosseel PM, Peek N, de Jonge E, de Mol BA. Prognostic Bayesian networks II: an application in the domain of cardiac surgery. Journal of biomedical informatics. 2007;40:619–30. doi: 10.1016/j.jbi.2007.07.004. [DOI] [PubMed] [Google Scholar]
- 20.Kukar M, Kononenko I, Groselj C, Kralj K, Fettich J. Analysing and improving the diagnosis of ischaemic heart disease with machine learning. Artificial intelligence in medicine. 1999;16:25–50. doi: 10.1016/s0933-3657(98)00063-3. [DOI] [PubMed] [Google Scholar]
- 21.van Gerven MAJ, Taal BG, Lucas PJF. Dynamic Bayesian networks as prognostic models for clinical patient management. Journal of biomedical informatics. 2008;41:515–29. doi: 10.1016/j.jbi.2008.01.006. [DOI] [PubMed] [Google Scholar]
- 22.Karaolis MA, Moutiris JA, Hadjipanayi D, Pattichis CS. Assessment of the Risk Factors of Coronary Heart Events Based on Data Mining With Decision Trees. Ieee Transactions on Information Technology in Biomedicine. 2010;14:559–66. doi: 10.1109/TITB.2009.2038906. [DOI] [PubMed] [Google Scholar]
- 23.Quellec G, Lamard M, Bekri L, Cazuguel G, Roux C, Cochener B. Medical Case Retrieval From a Committee of Decision Trees. Ieee Transactions on Information Technology in Biomedicine. 2010;14:1227–35. doi: 10.1109/TITB.2010.2053716. [DOI] [PubMed] [Google Scholar]
- 24.Toledo P, Rios PM, Ledezma A, Sanchis A, Alen JF, Lagares A. Predicting the Outcome of Patients With Subarachnoid Hemorrhage Using Machine Learning Techniques. Ieee Transactions on Information Technology in Biomedicine. 2009;13:794–801. doi: 10.1109/TITB.2009.2020434. [DOI] [PubMed] [Google Scholar]
- 25.Wu LC, Horng JT, Huang HD, Chen WL. Identifying Discriminative Amino Acids Within the Hemagglutinin of Human Influenza A H5N1 Virus Using a Decision Tree. Ieee Transactions on Information Technology in Biomedicine. 2008;12:689–95. doi: 10.1109/TITB.2008.896871. [DOI] [PubMed] [Google Scholar]
- 26.Podgorelec V, Kokol P, Stiglic B, Rozman I. Decision trees: an overview and their use in medicine. Journal of medical systems. 2002;26:445–63. doi: 10.1023/a:1016409317640. [DOI] [PubMed] [Google Scholar]
- 27.Witten IH, Frank E. Data Mining: practical machine learning tools and techniques. 2. Diane Cerra; 2005. pp. 187–99. [Google Scholar]
- 28.Chawla NV, Bowyer KW, Hall LO, Kegelmeyer WP. SMOTE: Synthetic minority over-sampling technique. Journal of Artificial Intelligence Research. 2002;16:321–57. [Google Scholar]
- 29.Han H, Wang WY, Mao BH. Borderline-SMOTE: A new over-sampling method in imbalanced data sets learning. Advances in Intelligent Computing, Pt 1, Proceedings. 2005;3644:878–87. [Google Scholar]
- 30.Taft LM, Evans RS, Shyu CR, et al. Countering imbalanced datasets to improve adverse drug event predictive models in labor and delivery. Journal of biomedical informatics. 2009;42:356–64. doi: 10.1016/j.jbi.2008.09.001. [DOI] [PMC free article] [PubMed] [Google Scholar]
- 31.Van Meter CH., Jr Right heart failure: best treated by avoidance. Ann Thorac Surg. 2001;71:S220–2. doi: 10.1016/s0003-4975(00)02637-0. [DOI] [PubMed] [Google Scholar]
- 32.Chen JM, Levin HR, Rose EA, et al. Experience with right ventricular assist devices for perioperative right-sided circulatory failure. Ann Thorac Surg. 1996;61:305–10. doi: 10.1016/0003-4975(95)01010-6. discussion 11–3. [DOI] [PubMed] [Google Scholar]
- 33.Nakatani S, Thomas JD, Savage RM, Vargo RL, Smedira NG, McCarthy PM. Prediction of right ventricular dysfunction after left ventricular assist device implantation. Circulation. 1996;94:II216–21. [PubMed] [Google Scholar]
- 34.Gorcsan J, 3rd, Murali S, Counihan PJ, Mandarino WA, Kormos RL. Right ventricular performance and contractile reserve in patients with severe heart failure. Assessment by pressure-area relations and association with outcome. Circulation. 1996;94:3190–7. doi: 10.1161/01.cir.94.12.3190. [DOI] [PubMed] [Google Scholar]
- 35.de Vries M, Witteman CL, Holland RW, Dijksterhuis A. The unconscious thought effect in clinical decision making: an example in diagnosis. Med Decis Making. 2010;30:578–81. doi: 10.1177/0272989X09360820. [DOI] [PubMed] [Google Scholar]


