

Abstract
Neurons are chiefly non-renewable; thus, cytolytic immune strategies to clear or control neurotropic viral infections could have lasting neurological consequences. Interferon-gamma (IFNγ) is a potent anti-viral cytokine that is critical for non-cytolytic clearance of multiple neurotropic viral infections, including measles virus (MV); however, the downstream pathways through which IFNγ functions in neurons have not been defined. Unlike most cell types studied to date in which IFNγ affects gene expression via rapid and robust activation of STAT1, basal STAT1 levels in primary hippocampal neurons are constitutively low, resulting in attenuated STAT1 activation and consequently slower kinetics of IFNγ–driven STAT1-dependent gene expression. Given this altered expression and activation of STAT1 in neurons, we sought to determine whether STAT1 was required for IFNγ-mediated protection from infection in neurons. To do so, we evaluated the consequences of MV challenge of STAT1-deficient mice and primary hippocampal neurons explanted from these mice. Surprisingly, the absence of STAT1 did not restrict the ability of IFNγ to control viral infection either in vivo or ex vivo. Moreover, the canonical IFNγ-triggered STAT1 gene expression profile was not induced in STAT1-deficient neurons, suggesting that IFNγ regulates neuronal STAT1-independent pathways to control viral replication.
Introduction
Central nervous system (CNS) invasion is a rare but typically severe, consequence of several human viral infections that include most herpesviruses, poliovirus, measles virus, flaviviruses (e.g., West Nile virus), and HIV. When CNS infections do occur, complications typically result in lasting neurological damage and often in death, especially in the young, elderly, and immunocompromised. The severity of neurotropic virus pathogenicity may be due to the delicate balance that must be achieved by the antiviral immune response: effective immunity must control the infection while minimizing cytotoxic T lymphocyte (CTL)-mediated lysis of this chiefly nonrenewable cell population. While multiple animal models have demonstrated that cytokines, including interferon-gamma (IFNγ), can limit viral spread in the brain via non-cytopathic mechanisms, the downstream signaling pathways that result in clearance remain largely undefined. This becomes clinically significant in those instances in which viral clearance fails, as in many cases of pediatric encephalitis including measles and rubella, and neurotropic infections of the elderly, including West Nile virus and St. Louis encephalitis virus.
IFNγ is the only type II member of the interferon family, which also consists of type I interferons (IFNα/β) and type III interferons. Unlike type I interferons, which are expressed by most cells soon after infection, IFNγ is chiefly produced by activated immune cells such as natural killer cells and T cells. IFNγ initiates a cellular response by binding to the IFNγ receptor complex (consisting of a hetero-tetramer of IFNγ-R1 and R2 subunits), which triggers activation of receptor-associated Janus Kinases (JAK)-1/2 and subsequent tyrosine phosphorylation of the cytoplasmic tail of the IFNγR1 subunits. Signal Transducer and Activator of Transcription (STAT)-1 is recruited to the phosphorylated R1 subunit, where it is phosphorylated, homodimerizes and translocates to the nucleus. The phosphorylated STAT1 homodimer binds to Gamma Activated Sequence (GAS) elements within IFNγ-responsive genes (ISGs) to initiate transcription. Over 250 genes are induced in this manner to inhibit viral spread. While STAT1 is central to a classical IFNγ response, a substantial number of studies have also demonstrated the presence of IFNγ-dependent, STAT1-independent pathways.
IFNγ is required for viral clearance of many neurotropic viral and bacterial infections. Of note, however, distinct immune strategies may be employed to resolve CNS infections, depending on the cell type that is infected. For example, mouse hepatitis virus (MHV) can infect CNS resident astrocytes, microglia, and oligodendrocytes; while perforin is sufficient to mediate viral clearance from astrocytes and microglia, IFNγ is sufficient for MHV control in oligodendrocytes. In addition, certain subsets of neural cells, such as neural precursors in the retina, preferentially utilize STAT3 instead of STAT1 in response to IFNγ. Numerous studies have also shown that both STAT1-dependent and independent pathways are likely to be important for IFN-mediated viral clearance in other regions of the body. For example, STAT1 plays a biphasic role in control of systemic Dengue infection in mice: STAT1-dependent pathways are required for early viral control, but STAT1-independent pathways are required for later control and eventual viral clearance. Thus, while IFNγ has been conclusively linked with noncytolytic clearance of multiple neurotropic infections, the role of STAT1, particularly in neurons, remains less well-defined.
We have developed a mouse model of neuron-restricted measles virus (MV) infection, in which CNS neurons express the MV receptor (CD46) under the control of the neuron-specific enolase (NSE) promoter (NSE-CD46+ mice). Using this model, we previously showed that adult NSE-CD46+ mice clear MV infection from CNS neurons without neurological damage or neuronal loss in an IFNγ-dependent and T-cell-dependent manner. IFNγ can act directly upon neurons to induce an anti-viral state, as demonstrated by the direct antiviral ability of IFNγ to limit MV replication in purified CD46+ neurons cultured ex vivo. Surprisingly, however, the neuronal signaling response to IFNγ treatment was distinct from that observed in control mouse embryonic fibroblasts (MEFs). Specifically, neurons responded to IFNγ with delayed and attenuated STAT1 expression and activation kinetics in comparison to control fibroblasts. This was reflected in the delayed and reduced expression of classical IFNγ-dependent genes. These previous studies suggest that IFNγ activates a critical anti-viral program in neurons, but that STAT1 may play a subordinated role in this response.
In this report, we examined the requirement for STAT1 in the IFNγ-mediated control of MV infection and spread using both an ex vivo model (infected primary hippocampal neurons), as well as infection of NSE-CD46+ mice on a STAT1-deficient background. We observed that STAT-1 was dispensable for the resolution of a MV CNS infection and that the canonical gene profile induced by IFNγ was not activated in neurons. These data indicate that IFNγ-triggered STAT1-independent pathways are likely operative in CNS neurons.
Materials and Methods
Cells, Viruses, Mice and Infections
Primary hippocampal neurons were prepared from embryonic (E15-16) mice as previously described. Neurons were plated on 15mm glass coverslips or in 12-well plates coated with poly-L-lysine (Sigma) at a density of 2.5×10⁵ cells/well, unless otherwise noted. Neuron cultures were routinely >95% MAP2 positive. Neurons were plated and incubated at 37°C in a humidified incubator with 5% CO2 for 5d prior to IFNγ treatment or infection to allow for full differentiation.
Primary astrocyte cultures were prepared from E16 cortices as described previously and were routinely >95% GFAP positive. After 7d in culture, monolayers were trypsinized and replated in poly-L-lysine coated 6-well plates (2×10⁵ cells/well) and incubated for 48h before treatment.
MV-Edmonston (vaccine strain) was purchased from American Type Culture Collection and passaged and titered in Vero cells. Passages 2 or 3 of the MV stock were used for intracerebral (IC) injections and in vitro infection assays.
Inbred C57BL/6 (H-2b) and homozygous NSE-CD46+ transgenic mice (line 18; H-2b) were maintained in the closed breeding colony of The Fox Chase Cancer Center. All experimental protocols were reviewed and approved by the Institutional Animal Care and Use Committee. Homozygous NSE-CD46+ and haplotype-matched homozygous immune knockout (KO) mice were intercrossed for three or more generations to obtain NSE-CD46+ mice on the desired KO background. STAT1-KO mice were originally obtained from Jackson Laboratories. Genotypes of all mice used in these experiments were confirmed by either PCR analysis of tail biopsy DNA, or by flow cytometry of peripheral blood lymphocytes immunostained with fluorophore-conjugated antibodies to mouse B and T cell markers.
Anafane-anesthetized mice were infected with MV via IC inoculation (2×10⁴ PFU in a volume of 20 μl, delivered along the midline using a 27g needle). Mice were monitored daily post-infection for signs of illness, including weight loss, ruffled fur, ataxia, and seizures. Moribund mice were euthanized in accordance with IACUC guidelines.
Primary neuron infections and IFNγ treatments
Five days post-plating, primary hippocampal neurons from NSE-CD46+ mice and NSE-CD46+/STAT1-KO mice were infected with MV (MOI 1.0) for 1h. Thereafter, the inoculum was removed, the neurons were washed twice in DPBS, and the cells were placed in conditioned Neurobasal media.
For cells treated with IFNγ, murine IFNγ (BD Transduction Labs) was diluted in B27-free Neurobasal Media, added to the cultures (100 U/ml final concentration) and incubated for the indicated times prior to collection.
Immunofluorescence Assay
At the indicated timepoints post-IFNγ addition, cells on coverslips were fixed in a 1:1 solution of methanol:acetone for 5 min at −20°C, and rehydrated in DPBS. To prevent nonspecific antibody binding, cells were incubated in a 10% goat serum/20% fetal bovine serum solution in DPBS for 1h at RT. A primary antibody was then added in blocking solution for 1h at RT. Antibodies, sources and concentrations used included: monoclonal anti-phospho-STAT1 (pY701), BD Biosciences Pharmingen (1:500); rabbit polyclonal anti-MAP2, Chemicon (1:250); rabbit polyclonal anti-GFAP, Novus Biologicals (1:250); and Keller anti-MV human serum, a gift from Michael Oldstone (1:1000). After three washes in DPBS, the cells were incubated in the appropriate secondary antibody in blocking solution for 1h at RT: anti-mouse-AlexaFluor-555 (1:10,000), or anti-rabbit-AlexaFluor-488 (1:10,000) with Hoechst 33342 (10 μM) nuclear stain; all from Molecular Probes. After three washes in DPBS, coverslips were mounted onto glass slides using Citi-Fluor AF1 (Electron Microscopy Sciences, Inc). Images were captured using an Inverted TE2000 with Nikon C1 confocal scanhead (40X objective) in the Fox Chase Cancer Center Confocal Facility.
Immunoblots
Cells were treated with IFNγ and collected at the indicated times, and immunoblots performed as previously described. Antibodies used included: anti-STAT1 (1:1000), phospho-specific STAT1 (pY701; 1:1000); Keller anti-MV (1:1000); and anti-glyceraldehyde-3-phosphate dehydrogenase (GAPDH; 1:10,000; Chemicon). All were diluted in PBS-T containing 5% milk. After three washes in PBS-T (10 min each), the blots were incubated in secondary antibody solution for 1h at RT. Antibodies included: goat anti-rabbit horseradish peroxidase (HRP; 1:1000; Vector Laboratories Inc.) for anti-STAT1, goat anti-mouse HRP (1:2000; Santa Cruz) for anti-pSTAT1; anti-human-HRP for Keller anti-MV (1:10,000), all diluted in PBS-T with 5% milk. For quantitative analysis of immunoblots, densitometric analysis was performed using NIH Image software (v.1.63). When reprobing was necessary, blots were stripped in an acidic glycine/SDS solution for 2h at RT.
Immunohistochemical analysis of mouse tissues
Brains from 4 to 5 mice/time point were removed, immersed in tissue embedding compound (Fisher), snap-frozen in a dry ice-isopentane bath, and stored at −70°C. Horizontal cryosections (10 μm) were air dried and stored at −70°C. Standard immunohistochemistry using diaminobenizidene precipitation was performed. To detect MV-infected cells, Keller anti-MV serum was used at a dilution of 1:2000, followed by a biotinylated anti-human secondary antibody (1:300; Vector). Rat anti-mouse CD4 (clone RM4-5; 1:100; Pharmingen) or rat anti-mouse CD8 alpha/CD8 beta antibodies (clones 53-6.7 and 53-5.8, respectively; 1:100 each; Pharmingen) were used to identify T lymphocyte subsets. Sections were then sequentially incubated for 1 h at RT with a biotinylated anti-rat immunoglobulin G secondary antibody (1:200; Vector), 30 min with a streptavidin-peroxidase conjugate (ABC Elite; Vector), and finally for 5–10 min with diaminobenzidine (0.7mg/ml in 60 mM Tris) and urea-H2O2 (0.2 mg/ml), purchased as pre-weighed tablets (Sigma). All cells were counterstained with hematoxylin and mounted with an aqueous mounting medium. Uninfected tissues or omission of the primary antibody served as negative controls. For all histological analyses, at least three sections per brain were examined from three different horizontal levels, and at least four mice per experimental group were assessed.
Reverse transcriptase quantitative real-time PCR (qRT-PCR)
Mouse brains were snap-frozen in liquid nitrogen and stored at −80°C. RNA was isolated by Trizol according to the manufacturer’s instructions (Sigma). Contaminating DNA was removed from RNA preparations using DNAse I treatment (Invitrogen). Purified RNA was quantified using a Nanodrop instrument. RNA was reverse-transcribed using M-MLV reverse transcriptase (Ambion) and a mixture of anchored oligo-dT and random decamers. For each sample, 2 RT reactions were performed with inputs of 100 and 20 ng. An aliquot of the cDNA was used for 5′-nuclease assays using Taqman chemistry. For IFNγ expression, Assay-on-Demand Mm00801778_m1 was used. A Taqman set specific for the N gene of MV (GenBank sequence AB046218) were used for detecting viral RNA. Sequences were: Forward: CGCAGGACAGTCGAAGGTC, Reverse: TTCCGAGATTCCTGCCATG, Probe: 6Fam-TGACGCCCTGCTTAGGCTGCAA-BHQ1. Assays were used in combination with Universal Master mix and run on a 7900 HT sequence detection system (Applied Biosystems). Cycling conditions were 95°C, 15 min followed by 40 (2-step) cycles (95°C, 15 sec; 60°C, 60 sec). The assay for MV-N was validated with a 4-fold 5-points dilution curve of cDNA. The slope was −3.54, corresponding to a PCR efficiency of 95%. For each sample, the values are averaged and standard deviation of data is derived from 2 independent PCR reactions. Relative quantification to the control was done using the comparative Ct method.
Flow cytometric analysis of brain infiltrates
On the indicated DPI, mice were deeply anesthetized with 400 μl 3.8% chloral hydrate in PBS, delivered intraperitoneally (IP). Once animals were confirmed to be nonresponsive, the mice were perfused with 30 ml PBS. Following perfusion, each brain and spleen were removed and pressed through a nylon mesh cell strainer in PBS. Dissociated tissue was run over a 30/70% discontinuous Percoll gradient for 20 min at 4°C. Mononuclear cells (MNCs) were recovered from the interface, washed with PBS, treated with 0.84% ammonium chloride to remove contaminating red blood cells (RBCs) and washed again. Collected MNCs were counted using a standard hemocytometer and plated into a v-bottom 96-well plate for subsequent antibody staining for multicolor flow cytometry. The following antibodies (eBioscience) were used: PE-Cy5-CD8a, APC-Ax750-CD4, PE-CD3e, FITC-CD11c, APC-CD161c (NK1.1), PB-CD19, PE-Cy5.5 Gr-1 (Ly-6G), PE-Cy7-CD49b (DX5), and Ax700-CD11b. Cells were allowed to incubate with antibody for 1h at 4°C and then washed following the incubation period. Pelleted, stained cells were resuspended and read in a BD LSR II system. Percentages obtained from flow cytometry were combined with hemocytometer counts in order to calculate total cell numbers.
Microarray
Primary hippocampal neurons were plated in poly-L-lysine coated 6-well plates at a density of 1×10⁶ cells/well. RNA was purified from whole cell lysates using the RNeasy Mini kit (Qiagen), and contaminating DNA was removed using an RNase-Free DNase set. 500 ng total RNA was amplified and labeled using the Low RNA input linear amplification kit (Agilent). Labeled cRNA targets were hybridized onto Agilent 4×44k mouse whole genome arrays. Microarray images were processed using Agilent Feature Extraction software (version 9.5). Data were background-corrected using the normexp method (PMID: 17720982) implemented in the Bioconductor package limma, and quantile normalized. Identification of differentially expressed genes was performed with empirical Bayes moderated t-tests using limma. Biological pathways and networks were examined with Ingenuity Pathway Analysis software (www.ingenuity.com). The dataset is at the Gene Expression Omnibus (GEO) (http://www.ncbi.nlm.nih.gov/geo/), accession number GSE33057.
Results
IFNγ-mediated STAT1 signaling is attenuated in CNS neurons
We previously showed that IFNγ is required for control of MV in a transgenic mouse model (NSE-CD46+), in which infection is neuron-restricted. To define the mechanism by which IFNγ functions, we determined the efficacy of IFNγ-mediated control of MV replication in primary neurons. Explanted CD46+ hippocampal neurons were treated with recombinant murine IFNγ (100U/ml) or an equivalent amount of heat-inactivated IFNγ; 18h thereafter, the neurons were infected with MV-Ed (MOI=1) and relative infection levels were determined by quantifying viral protein load. Note that standard plaque assays cannot be used to measure viral levels because no infectious virus is released from infected neurons.
Neuronal lysates were harvested 48 hpi for western blot analysis. As shown in Figure 1A and B, viral protein levels were >75% reduced in the presence of IFNγ, while heat inactivated IFNγ had no effect. These results confirm that IFNγ limits MV replication in primary neurons. Our previous work suggested that the downstream signaling response of primary neurons following IFNγ engagement was distinct from classical IFNγ-activated STAT1-dependent signaling. To determine if this altered signaling profile was true for other brain parenchymal cells, primary hippocampal neurons were compared with primary astrocytes, which are derived from the same pool of neural precursor cells. Both primary cultures were consistently >95% pure, as defined by MAP2 and GFAP staining, respectively (Figure 1D). Cultures were treated with IFNγ (100 U/ml) for the indicated times, and samples were then analyzed for both total and phosphorylated STAT1 by western blot (Figure 1C) and by immunofluorescence (Figure 1D). Like mouse embryonic fibroblasts, astrocytes expressed abundant endogenous levels of STAT1, which was rapidly phosphorylated after IFNγ treatment (Figure 1C and 1D, top row). In contrast, primary hippocampal neurons expressed low basal levels of STAT1, and phosphorylated STAT1 was detectable in neurons only after extended IFNγ stimulation (24h), coincident with an increase in available STAT1 protein (Figure 1C). These data demonstrate that delayed STAT1 phosphorylation is not a general characteristic of resident brain parenchymal cells, but rather is unique to neurons.
Figure 1. IFNγtreatment limits MV neuronal infection, despite low basal levels of STAT1 and delayed STAT1 phosphorylation.

(A) Hippocampal neurons explanted from NSE-CD46+ embryos were treated with IFNγ (100U/ml, 18h) or heat-inactivated (ΔH) IFNγ (100U/ml, 18h) and infected with MV-Ed (MOI=1). 48 hpi, neurons were lysed in protein solubilization buffer and subjected to western blot for MV antigen and GAPDH as a loading control. (B) Western blots from (A) were quantified by densitometry using ImageJ software. MV signal was normalized to GAPDH as loading control. Statistical analysis was applied using a paired t-test (n=4, *p < 0.05 versus MV-infected). (C/D) Hippocampal neurons and cortical astrocytes from NSE-CD46+ embryonic mice were treated with IFNγ (100U/ml) for the indicated times and collected for western blot analysis (C) or fixed for immunofluorescence (D). For western blots (C), whole cell lysates were subjected to western blot for phosphorylated STAT1 (STAT1-P; tyrosine 701), total STAT1, and GAPDH. (D) Coverslips were stained with a monoclonal antibody against STAT1-P (red), and a polyclonal antibody against GFAP or MAP2 as astrocyte or neuronal markers, respectively (green). All experiments were conducted in triplicate. Original magnification 400X.
STAT1 is not required for MV control in primary neurons
Despite reduced expression and activation of neuronal STAT1, it was possible that these low levels were still sufficient to initiate an effective anti-viral signal. Thus, to determine what role STAT1 played in IFNγ-mediated MV clearance, CD46+ and CD46+/STAT1-KO neurons were treated with IFNγ and infected with MV as described above; neurons were then harvested for western blot analysis for MV antigen or fixed for immunofluorescence. Quantified results are shown in Figure 2A, and representative images are shown in Figure 2B. Without IFNγ, increasing levels of MV antigen were detectable in both CD46+ and CD46+/STAT1-KO neurons from 24–72 hpi, evidenced by the increasing size of viral antigen-positive foci (Figure 2B). In contrast, infected CD46+ and CD46+/STAT1-KO neurons treated with IFNγ showed equivalently less MV antigen at each timepoint; there were no statistical differences between STAT1-expressing and knockout neurons. These data suggest that STAT1 is not required for IFNγ-mediated control of MV in neurons.
Figure 2. Primary neurons utilize STAT1-independent pathways during IFNγ-mediated viral control.

(A) NSE-CD46+ and NSE-CD46+/STAT1-KO hippocampal neurons were treated with IFNγ (100 U/ml) and infected with MV (MOI=1) for 24 or 48 h. Whole cell lysates were harvested, subjected to Western blot analysis, and quantified on ImageJ software, with MV signal normalized to GAPDH. The average MV signal is plotted with MV infection at 24h set to 100%, and error bars represent SEM (n=3). (B) Immunofluorescence analysis of MV antigen in CD46+ and CD46+/STAT1-KO neurons. Neurons were treated as in (A) and stained for MV antigen (red), MAP2 (green) and Hoescht (blue). Original magnification = 400X. (C) Primary CD46+ neurons were either treated with IFNγ 24h before infection (lane 2), coincident with infection (lane 3), or 24h post-infection (lane 4). Lysates were collected from infected (and corresponding uninfected) neurons, and blots probed for MV antigen and GAPDH as described. (D) CD46+ neurons were either treated with IFNγ (100 U/ml) or left untreated and 24 h later, infected with MV. 48 hpi, coverslips were collected and immunostained for MV antigens, and nuclei within immunopositive clusters counted. Clusters were “binned” into groups of 1–3, 4–6, 7–10 or greater than 10 (n=3). Standard deviations are shown from three such experiments.
IFNγ could abate MV growth either by directly eliminating MV from infected neurons, by limiting trans-synaptic spread, or by some combination of the two. To assess this, receptor-expressing CD46+ neurons were infected with MV, and treated with IFNγ either 24h before, 24h after, or coincident with MV infection. IFNγ-mediated control was most effective when neurons were pre-treated with IFNγ (Figure 2C, compare lanes 2 and 1); the anti-viral effect was negligible when IFNγ was added post-infection (compare lanes 4 and 1). Moreover, in the presence of IFNγ, MV antigen-positive neurons were typically found as single immunopositive cells, in contrast to abundant multi-neuronal networks in the absence of IFNγ (Figure 2B, quantified in Figure 2D), suggesting that IFNγ may play a role in blocking viral spread rather than directly resolving the infection.
STAT1-deficient mice survive viral infection in CNS neurons
To determine what role STAT1 plays in the resolution of a neuronal viral infection in vivo, we infected NSE-CD46+ transgenic mice that had been backcrossed to selective immune knockout mice. NSE-CD46+ mice lacking T and B cells (NSE-CD46+/RAG2-KO), IFNγ (NSE-CD46+/IFNγ-KO), or STAT1 (NSE-CD46+/STAT1-KO) were infected IC with MV and monitored daily for signs of illness (Table I) and mortality (Figure 3). Consistent with our published results, immunocompetent NSE-CD46+ mice remained disease-free, and all survived, whereas >95% of NSE-CD46+/RAG-2 KO mice and ~50% of NSE-CD46+/IFNγ KO mice died of unrestricted MV infection between 7–17 dpi, during the period of maximal T cell presence within the brain parenchyma (dotted horizontal line, Figure 3; 34). Of note, surviving NSE-CD46+/IFNγ-KO mice showed lasting signs of neurological damage, including ataxia, piloerection, and hunched posture (Table I). Unexpectedly, NSE-CD46+/STAT1-KO mice segregated into two groups following MV infection. Consistently, a small proportion (~25%; 9/35 mice in the experiment shown) died between 4–6 dpi, earlier than any other knockout mouse tested in this model system, and prior to the entry of CD4+ and CD8+ T cells into the CNS. This early death was accompanied by grade 5 “popcorn” seizures (based on a modified Racine scale;) and temporary paralysis, followed by death within 24h. Importantly, however, the majority of NSE-CD46+/STAT1-KO mice survived this initial 6d period, and showed no signs of neurological damage at any timepoint thereafter (Table I). Pairwise analysis contingent on survival to 8 dpi indicated no statistically significant difference between NSE-CD46+ mice and NSE-CD46+/STAT1 KO mice, though survival differences did reach significance (p<0.05) for the other genotypes tested. Based on these observations, we conclude that STAT1 plays a biphasic role during MV infection, and that STAT1 is dispensable for MV clearance from neurons during the adaptive immune phase.
Table 1.
Measles virus-induced CNS disease in mice of various immunodeficient backgrounds.
| Average Illness Score (% surviving) | ||||
|---|---|---|---|---|
| Genotype | Week 1 | Week 2 | Week 3 | Week 4 |
| NSE-CD46+ | 0 (100) | 0 (100) | 0 (100) | 0 (100) |
| NSE-CD46+/RAG-2 KO | 0.6 (100) | 2.8 (30) | 2.3 (20) | 2.5 (10) |
| NSE-CD46+/IFNγ KO | 0 (100) | 1.9 (60) | 1.8 (60) | 1.3 (50) |
| NSE-CD46+/STAT1 KO | 1.2 (70) | 1.0 (70) | 0.5 (70) | 0 (70) |
Mice were subjectively assessed for signs of morbidity every other day post-infection. Average scores (0–3) of surviving mice for a four week observation interval are shown (n=10 for each genotype):
0 = healthy
1 = ruffled fur/piloerection; ataxic
2 = above, plus seizures
3 = moribund
Figure 3. STAT1 is not required for T cell-mediated resolution of a neuron-restricted MV infection.

Kaplan-Meier survival plot of MV-challenged NSE-CD46+ mice on various knockout backgrounds. NSE-CD46+, NSE-CD46+/STAT1-KO, NSE-CD46+/IFNγ-KO, and NSE-CD46+/RAG2-KO mice were infected as described in Materials and Methods. Results from 3 separate experiments were pooled (n= 10–35 mice/condition). Mice were monitored daily for signs of morbidity and were euthanized when signs of illness were apparent. The dotted horizontal line indicates the peak of T cell entry into the CNS parenchyma of NSE-CD46+ mice. Pairwise analysis, contingent on survival to 8 dpi, was performed between infected NSE-CD46+ mice and the other three genotypes. NSE-CD46+ versus NSE-CD46+/STAT1 KO: not significant. NSE-CD46+ versus NSE-CD46+/IFNγ KO: p<0.05. NSE-CD46+ versus NSE-CD46+/RAG KO: p<0.05.
T cell infiltration into the CNS and control and clearance of MV in neurons are STAT1-independent
Studies using STAT1 knockout mice have implicated a role for STAT1 in both lymphocyte proliferation and migration. To address whether the absence of STAT1 affected the timing or magnitude of T cell infiltration into the infected brain parenchyma, immune cell profiles were determined in brain tissues of MV-infected NSE-CD46+ and NSE-CD46+/STAT1-KO mice by flow cytometry and immunohistochemistry. At 7 dpi, the profile of immune cells (including both innate and adaptive cell types) in the spleens of NSE-CD46+, NSE-CD46+/IFNγ KO and NSE-CD46+/STAT1 KO mice were statistically similar (Figure 4A; left panel). In brains, however, a lower percentage of CD4+ and CD8+ T cells were found in the CNS of IFNγ-deficient mice despite similar overall numbers of infiltrating cells within the CNS, confirming IFNγ as a chemoattractant (Figure 4A, right panel). However, no differences in either profile (Figure 4A; right panel) or localization (Figure 4B) of intraparenchymal T cells were observed between MV-permissive wild type and STAT1 KO mice.
Figure 4. Comparable immune cell profiles in brains of wild type and STAT-deficient mice.

NSE-CD46+, NSE-CD46+/IFNγ-KO, and NSE-CD46+/STAT1-KO mice were inoculated with MV IC (2 × 10⁴ PFU). (A) Multi-color flow cytometry analysis of total lymphocyte populations was performed on spleens and brains of MV-infected mice at 7 dpi. Each bar represents the average of the total lymphocyte population from each organ for each cell type (n=5). Error bars represent standard deviation. Statistical analysis was applied using the Student’s t-test (*p<0.05 versus NSE-CD46+; # p<0.05 versus NSE-CD46+/IFNγ-KO). N.D. = Not detected. (B) Representative, horizontal brain sections immunostained for CD4+ T cells (top) and CD8+ T cells (bottom) from NSE-CD46+ mice and NSE-CD46+/STAT1-KO mice at 7 and 11 dpi. Magnification = 100X.
To compare relative levels of IFNγ, we quantified IFNγ RNA in brain tissue at the peak of T cell infiltration (11 dpi) by quantitative RT-PCR (Figure 5A) and compared MV RNA levels in the CNS at various dpi (Figure 5B). As expected, NSE-CD46+/IFNγ-KO mice did not produce IFNγ (data not shown), and were unable to clear MV RNA to levels seen in NSE-CD46+ or NSE-CD46+/STAT1-KO mice (Figure 5B). Brains of NSE-CD46+/STAT1-KO mice expressed significantly higher levels of IFNγ RNA at 11 dpi than NSE-CD46+ mice, which correlated with the decrease in MV RNA seen in non-seizing NSE-CD46+/STAT1-KO brains between 4 and 11 dpi (Figure 5B). Importantly, NSE-CD46+ mice had consistently low levels of MV RNA, indicating that STAT1 likely plays a pivotal role in the type I interferon innate response at early times post-infection. Note also that, though approximately 20% of NSE-CD46+/STAT1-KO mice develop lethal seizures at 4 dpi, there was no statistical difference in viral load between seizing and healthy mice. Together, these data indicate that the adaptive immune response of NSE-CD46+/STAT1-KO mice is comparable to that made by wild type mice, leading to viral resolution in the absence of the canonical STAT1-mediated pathway.
Figure 5. STAT1 is necessary for early MV control but is not required for MV clearance from CNS neurons.

(A) Brains were removed at 11 dpi from NSE-CD46+ and NSE-CD46+/STAT1-KO mice and assessed by qRT-PCR for levels of IFNγ message (n= 8). (B) MV RNA in the brains of MV-infected mice. Animals were infected IC with MV (2×10⁴ PFU), and brains were harvested at 4, 11, and 40 dpi. RNA was extracted and subjected to qRT-PCR for MV-N. (n= 6–10 mice per time point). Statistical analysis was applied via unpaired t-test (*p<0.04 versus NSE-CD46+ mice on the same dpi; **p<0.003 versus NSE-CD46+ mice on the same dpi).
Canonical IFNγ-dependent genes are not expressed in STAT1-KO neurons
Finally, to address the possibility that IFNγ resulted in the expression of a classic profile of genes via an alternative (non-STAT1-mediated) pathway, we used a microarray strategy to identify the top 50 genes that were activated by IFNγ in mouse embryonic fibroblasts, and then determined if these same genes were induced in IFNγ-treated neurons, with and without STAT1. Microarrays were performed on both primary MEFs and primary NSE-CD46+ and NSE-CD46+/STAT1 KO neurons following IFNγ-exposure for 0, 3, 6 or 24 h. Three individual cultures were analyzed for each timepoint. Heat maps, reflective of expression levels, are shown in Figure 6. Yellow represents the baseline for each gene in each cell type; progression to red indicates induction of gene expression. The top 50 IFNγ-activated genes in MEFs are shown in the first three columns; as expected, the majority of these genes achieved maximal levels by 3h post-treatment. Primary STAT1+ neurons induced a similar profile of genes, though some genes were not induced at all, and most others showed delayed induction kinetics, consistent with the delayed activation of STAT1 in neurons. Importantly, despite the capacity to control MV as effectively as STAT1+ neurons, STAT1 KO neurons did not induce the majority of canonical IFNγ-driven genes. Thus, it is likely that alternative genes are induced in STAT1 KO neurons that mediate viral control. A complete list of genes that were induced or suppressed in neurons following IFNγ exposure, independent of STAT1 expression, is provided in Supplemental Figures 1 and 2.
Figure 6. Microarray expression profiles following IFNγ stimulation.
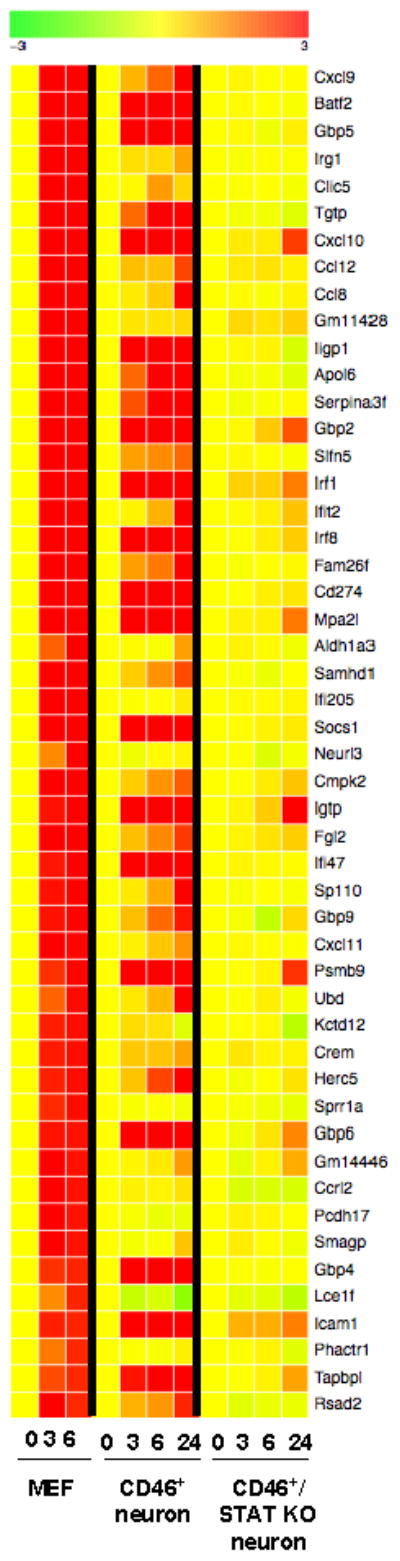
MEFs and primary NSE-CD46+ and NSE-CD46+/STAT1 KO neurons were incubated for the indicated times with IFNγ, followed by RNA purification. RNA was then subjected to microarray as described in Materials and Methods, and analyzed by Ingenuity software. In this heat map, yellow represents basal expression, and shades from yellow to red indicate increasing expression levels (log2 scale).
Discussion
In this manuscript, we make three key observations: 1) distinct from other parenchymal CNS cell types, the IFNγ-triggered, STAT1-dependent signaling profile in neurons is delayed and restricted; 2) STAT1 is not required for IFNγ-mediated control of MV either in primary neurons or in a permissive mouse model; and 3) alternative signaling pathways are likely operative in STAT1 deficient neurons (and perhaps also in STAT1 positive neurons) to result in viral control.
A number of points warrant further discussion. First, these data add to a growing literature that shows that the cellular response to extracellular cytokines is not monolithic. While signaling pathways and the genes they regulate are generally maintained across distinct cell populations, subtle differences in expression levels can exert major changes in the antiviral response. Specifically, the delayed and muted neuronal response to IFNγ, in contrast to the rapid and robust signal seen in MEFs and astrocytes (Figure 1C) has a marked impact on the kinetics and magnitude of IFNγ-responsive genes expressed in neurons. Relevant to published studies, these primary neurons are ~95% pure cultures, and in this report, we assessed pSTAT1 levels within 3–24 hours post-IFNγ treatment; while untreated neurons do have detectable levels of unphosphorylated STAT1, and eventually respond to IFNγ (as shown in other studies) the signature of the early neuronal response is appreciably different from that observed in control cells. Of note as well, while these data specifically compare primary hippocampal neurons to primary astrocytes, differences may also be present in neuronal subpopulations as well. The primary neurons used in these experiments are mainly derived from the embryonic hippocampus, though dissection of this substructure from day E15-16 embryos can be imprecise, and likely includes some cortical tissue. Moreover, both glutamatergic and GABAergic neurons are present in the hippocampus at this stage of development; thus, these cultures are likely comprised of different neuronal subtypes. This may be relevant to the STAT1 activation profile seen in neurons: at 24 hours post-treatment, about half of the neurons have a detectable pSTAT1 signal, whereas the remainder appears non-responsive (Figure 1D, lower right panel). Efforts are underway to determine if there is a correlation between neuronal subtype in the CNS and IFNγ responsiveness.
A second issue is the apparent dispensability of STAT1 in IFNγ-mediated viral control. In both infected mice and in infected primary neurons, IFNγ plays a central role in protection: its absence from mice results in death of ~50% of MV-challenged animals, and permanent neurological impairment in the survivors. Similarly, addition of recombinant murine IFNγ to infected neurons restricts viral load, and may afford a survival advantage to these vulnerable cells. Given the crucial role of IFNγ in survival from MV CNS disease, we were therefore surprised that, during the period of adaptive immune cell presence in the brain of infected mice (7–17 dpi), STAT1 played no role in mouse survival. This was in contrast to an extensive body of evidence that supports a central and pivotal role for STAT1 in mouse survival following infection by many viruses. In these papers, STAT1 knockout mice demonstrated greater viremia and mortality from both peripheral viral challenges as well as from CNS infections, leading to the conclusion that STAT1 was a key feature of protection against multiple infections. Yet, evidence for STAT1-independent antiviral pathways also exists for other viral infections, suggesting that particular viruses or target tissues may not be as reliant on STAT1-dependent pathways for viral clearance. The difference between our results and those that underscore the importance of STAT1 in CNS infections may be because the only cell type infected in NSE-CD46+ mice is CNS neurons, which may allow neuronal STAT1-independent pathways to be effective against this limited viral tropism.
While STAT1 is not required during the 7–17 dpi window when T cells are abundant in the CNS, there is a small but reproducible effect of STAT1 deficiency at early stages post-infection (3–6 dpi), resulting in death of 20–30% of infected mice. We presume that this implies participation of STAT1 in the type I interferon response (mediated by interferons alpha and beta), where, along with STAT-2 and IRF-9, it is part of the interferon-stimulated gene factor 3 (ISGF3) complex that binds to interferon-stimulated gene promoter elements. While this hypothesis awaits confirmation, one issue that this model does not address is that neurons, in vivo, may encounter interferons sequentially; that is, it is likely that cellular exposure to type I IFNs precedes IFNγ exposure. As such, when a neuron encounters IFNγ, it may already have made a transcriptional response to type I IFN. Thus, an ultimate appreciation of the role of IFNs and their subsequent signaling pathways in antiviral immunity will likely require an integrated evaluation of the neuronal response to serial IFN encounters.
Finally, the uncoupling of STAT1 dependence from IFNγ dependence makes it likely that a different constellation of genes is induced in neurons that influence viral control. As shown in Figure 6, the standard IFNγ profile is not induced in STAT1 KO neurons, and thus our current efforts are aimed at identifying what role IFNγ-inducible, STAT1-independent genes may play in viral control.
From these data, we propose a “signaling factor density” model: in MEFs and astrocytes, the abundant cytoplasmic levels of STAT1 facilitates rapid and complete occupation of binding sites on the intracellular domain of the IFNγ receptors, triggering a primarily STAT1-driven response. In contrast, neurons with lower constitutive expression of STAT1 may allow for other signal transduction factors to bind and eventually trigger transcription of a distinct subset of genes, creating a unique neuronal response profile. Indeed, the relevance of these alternative signaling pathways is supported by the impairment-free survival of STAT1 KO mice, implying that the canonical STAT1 signaling pathway plays a modest, perhaps negligible, role in viral control in neurons.
As the field of cell-specific cytokine responses progresses, one can envision that the use of cytokines as antivirals will need to be reassessed in the context of the disease or pathogen that is targeted, and the cell populations affected.
Supplementary Material
Neurons were prepared and RNA analyzed as described in Figure 6. In this heat map, yellow represents basal expression, and shades from yellow to red indicate increasing expression levels (log2 scale).
Neurons were prepared and RNA analyzed as described in Figure 6. In this heat map, yellow represents basal expression, and shades from yellow to green indicate decreasing expression levels (log2 scale).
Acknowledgments
The authors gratefully acknowledge Kerry Campbell, Luis Sigal, Christine Matullo, Kevin O’Regan, and Sarah Cavanaugh for critical input on this manuscript.
Footnotes
This work was supported by the following sources: RO1 NS40500 (GFR), F32 NS062519-01 (LAO’D), a grant from Autism Speaks (GFR), a gift from the F. M. Kirby Foundation (GFR), and by P30CA006927 from the National Cancer Institute.
Associated Data
This section collects any data citations, data availability statements, or supplementary materials included in this article.
Supplementary Materials
Neurons were prepared and RNA analyzed as described in Figure 6. In this heat map, yellow represents basal expression, and shades from yellow to red indicate increasing expression levels (log2 scale).
Neurons were prepared and RNA analyzed as described in Figure 6. In this heat map, yellow represents basal expression, and shades from yellow to green indicate decreasing expression levels (log2 scale).