Abstract
Ultrasound molecular imaging is a powerful diagnostic modality employing microbubbles coated with targeting ligands specific for endothelial biomarkers. The circulation persistence of ligand-bearing contrast agents is a key determinant in their contrast enhancement and targeting capability. Prior studies have shown that targeted microbubbles with ligands attached to the shell using the conventional exposed-ligand architecture (ELA) could trigger undesired ligand-induced complement activation and decreased circulation time. Microbubbles with the buried-ligand architecture (BLA), however, were found to inhibit complement activation and prolong circulation time. In the present study, we extended the stealth BLA microbubble design to size-selected (4–5 µm diameter) microbubbles targeted with cyclic RGD peptide using the post-labeling technique. Microbubble circulation persistence was measured in the healthy mouse kidney using a Visualsonics Vevo 770 scanner operating at 40 MHz in fundamental mode. The circulation persistence for targeted BLA microbubbles was significantly longer compared to their ELA counterparts and similar to no-ligand controls. Use of the BLA instead of the ELA increased the circulation half-life by approximately 2-fold. Analysis of the time-intensity and time-fluctuation curves with a two-compartment pharmacokinetic model showed a minimal degree of nonspecific vascular adhesion for any group. These results demonstrate the importance of surface architecture in the design of targeted microbubbles for ultrasound molecular imaging.
Keywords: molecular imaging, targeting, RGD peptide, complement activation, mononuclear phagocyte system, clearance, mouse kidney
1. Introduction
In recent years, targeted microbubbles have been successfully used in preclinical research for ultrasound imaging of vascular pathology, including tumor angiogenesis (Anderson, Rychak 2010, Lyshchik, Fleischer 2007, Tardy, Pochon 2010, Willmann, Cheng 2008), thrombosis (Kaufmann, Carr 2010, Wang, Zhou 2010) and inflammation (Ferrante, Pickard 2009, Leong-Poi, Christiansen 2005, Lindner, Dayton 2000). In these applications, molecular ligands, such as antibodies and peptides, are attached to the microbubble shell to generate targeted microbubbles. Following intravenous injection, the targeted microbubbles circulate systemically and adhere through multiple ligand-receptor interactions to vasculature expressing the biomarker of interest. Adherent microbubbles are detected with ultrasound to image and quantify biomarker expression in the target tissue (Borden and Dayton 2008, Borden, Qin 2010, Ferrara, Pollard 2007, Sirsi and Borden 2009). Following this paradigm, ultrasound molecular imaging is emerging as a powerful method to diagnose vascular pathology and monitor therapy (Deshpande, Ren 2011, Palmowski, Huppert 2008, Pysz, Foygel 2010, Xuan, Bygrave 2009).
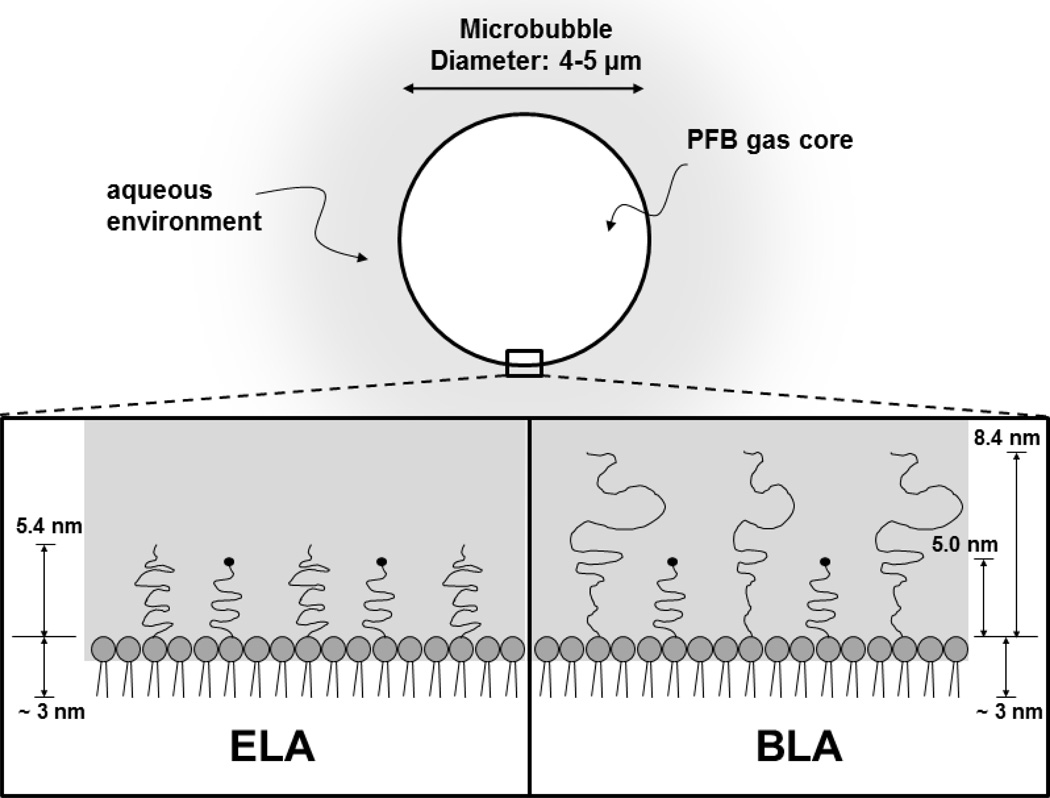
The design of a clinically safe and efficacious targeted microbubble for ultrasound molecular imaging requires inhibition of immune recognition through complement protein fixation to the ligand. Complement binding can (i) interfere with ligand-receptor binding to target endothelium, (ii) lead to nonspecific adhesion to inflamed vessels (Anderson, Tsutsui 2007, Lindner, Coggins 2000), (iii) initiate an anaphylactoid reaction, such as complement activation related pseudo-allergy (CARPA) (Herzog 2008, Main 2009, Szebeni 2005, Wei, Mulvagh 2008) and (iv) reduce the circulation persistence of the microbubbles owing to uptake by the mononuclear phagocyte system (MPS) and accumulation in the lung, liver and spleen (Moghimi and Hunter 2001, Vonarbourg, Passirani 2006). One possible approach to circumvent complement activation is to bury the ligand by using a bimodal polymer brush, with the ligand attached to the shorter chains and concealed by the longer chains (Borden, Sarantos 2006, Borden, Zhang 2008, Chen and Borden 2010, Chen and Borden 2011). Figure 1 shows a schematic of the buried-ligand architecture (BLA) versus the exposed-ligand architecture (ELA). Targeting of BLA-microbubbles to receptor-bearing surfaces and cells is possible with the application of ultrasound radiation force. The BLA was shown to reduce complement protein C3/C3b fixation to the microbubble surface, reduce anaphylatoxin C3a production in vitro and in vivo, and increase in vivo circulation persistence compared to the conventional ELA motif.
Figure 1.
Cartoon illustrating microbubble surface architecture design for in vivo perfusion imaging studies. The PEG chain length was estimated by self-consistent field (SCF) theory (Lai and Zhulina 1992) using values of 0.44 nm2 for the average projected area per lipid molecule (Hollinshead, Harvey 2009) and 0.35 nm for PEG monomer length. The lipid monolayer thickness was estimated to be ~3 nm based on the persistence length of the stearoyl chains (Israelachvili 1992).
In the aforementioned study, which used a clinical ultrasound imaging system with nonlinear contrast detection, the circulation persistence was found to be approximately 30–50% longer in the healthy rat kidney for the BLA compared to the ELA when biotin was used as the ligand (Borden, Sarantos 2006). However, aside from using a non-clinical ligand, this study used suboptimal, polydisperse-size microbubbles with a mean diameter near 1 µm. Recent work with both clinical and small-animal ultrasound imaging systems and rodent models has shown that size-selected microbubbles above 3 µm diameter provide superior contrast and longer circulation persistence than their smaller counterparts (Sirsi, Feshitan 2010, Streeter, Gessner 2010). Microbubbles in this size range were also found to increase the safety and efficacy of sonoporation of the blood-brain barrier (BBB) in mouse and nonhuman primate models (Choi, Feshitan 2010, Tung, Marquet 2011). Given the previous work on the potential clinical advantages of these larger, more monodisperse microbubbles, it is now important to establish the influence of surface chemistry and molecular architecture on the circulation persistence and potential for nonspecific adhesion and retention in the microvasculature. Thus, we hold microbubble size, polydispersity and concentration constant in this study and vary only surface chemistry.
Lipid-coated microbubbles were size-selected to 4–5 µm diameter using the differential centrifugation technique (Feshitan, Chen 2009). Cyclic arginine-glycine-aspartic acid (RGD), a small-molecule peptide ligand commonly employed to target the αvβ3 integrin marker of angiogenesis (Dsouza, Ginsberg 1988), was attached to the microbubble surface using a post-labeling technique in both the ELA and BLA motifs (Chen and Borden 2010, Chen and Borden 2011). Contrast enhancement and persistence in the healthy mouse kidney was monitored using a Visualsonics Vevo 770 scanner operating at 40 MHz in fundamental mode. Pharmacokinetic parameters were determined using single- and two-compartment models to assess the role of nonspecific adhesion and microbubble retention in the kidney vasculature. Results from this study are relevant to contrast-enhanced ultrasound imaging and offer insights into the design of stealth contrast agents for molecular imaging.
2. Materials and Methods
2.1. Materials
Phospholipids were purchased from NOF America Corporation (White Plains, NY), including 1,2-distearyol-sn-glycero-3-phosphocholine (DSPC), 1,2-distearyol-sn-glycero-3-phosphoethanolamine-N-[methoxy(polyethylene glycol)2000] (DSPE-PEG2000), 1,2-distearyol-sn-glycero-3-phosphoethanolamine-N-[maleimide(polyethylene glycol)2000] (DSPE-PEG2000-M) and 1,2-distearyol-sn-glycero-3-phosphoethanolamine-N-[methoxy(polyethylene glycol)5000] (DSPE-PEG5000). All phospholipids were stored in the freezer at −20 °C. Perfluorobutane gas (PFB, 99 wt% purity) was obtained from FluoroMed, L.P. (Round Rock, TX). Cyclic cysteine-tagged RGD peptide (99.9% purity) was purchased from Peptides International (Louisville, KY) and dissolved in 3 vol% degassed acetic acid. The dissolved RGD peptide was aliquoted into 50-µL volume and stored in nitrogen at −20 °C. All other reagents were purchased from Sigma-Aldrich (St. Louis, MO) and used without further purification, unless otherwise noted.
2.2. Microbubble Generation and Size Isolation
The microbubble compositions are listed in Table 1. Microbubbles were generated using the probe sonication method, as described elsewhere (Feshitan, Chen 2009). Briefly, the indicated amounts of each phospholipid species were mixed and hydrated with a phosphate buffered saline (PBS) mixture (90 vol% PBS, 10 vol% 1,2-propanediol and 10 vol% glycerol) to a final lipid concentration of 2.0 mg/mL. The lipid suspension was heated in a water bath to 65 °C for 15 min, and then sonicated with a 20 kHz probe (model 250A, Branson Ultrasonics; Danbury, CT) at low power (power setting dialed to 3/10; 3W) in order to heat the lipid suspension above the DSPC main phase transition temperature (55 °C (Marsh 1990)) and further disperse the lipid aggregates into small, unilamellar liposomes. PFB was introduced by flowing it over the surface of the lipid suspension. Microbubbles were generated through high-power sonication (power setting dialed to 10/10; 33 W) at the gas-liquid interface for 10 s. A Multisizer III particle counter (Beckman Coulter; Opa Locka, FL) with a 50-µm aperture was used to measure the size distribution and particle concentration. The microbubbles were concentrated by centrifugation flotation in a bucket-rotor centrifuge (Model 5804, Eppendorf; Westbury, NY) at 300G for 3 min. The infranatant, which contained residual lipids and vesicles that did not form part of the microbubble shells, was recycled to produce the next batch of microbubbles. The resulting microbubble cakes were pooled and re-suspended in PBS.
Table 1.
Microbubble compositions.
| Phospholipid Composition (mol %) | ||||
|---|---|---|---|---|
| Samples | DSPC | DSPE-PEG2000 | DSPE-PEG2000-M | DSPE-PEG5000 |
| ELA-control | 90 | 10 | - | - |
| ELA-RGD | 90 | - | 10 | - |
| BLA-control | 90 | 5 | - | 5 |
| BLA-RGD | 90 | - | 5 | 5 |
Microbubbles were size selected to the 4–5 µm diameter range using differential centrifugation, as previously described (Feshitan, Chen 2009). First, microbubbles with diameter less than 4 µm were removed by centrifuging at 110G for 1 min. The cake was collected and re-suspended in PBS, while the infranatant was recycled or discarded. This washing step was repeated 5–7 times to ensure that all smaller microbubbles were removed. Next, microbubbles with diameter greater than 5 µm were removed by centrifuging at 70G for 1 min. The infranatant containing 4–5 µm microbubbles was saved and centrifuged again at 120G for 1 min to concentrate the sample to >1×10⁹ #/mL. These steps were repeated 3–5 times until the total volume was >1 mL. The final concentrated 4–5 µm microbubble sample was stored at room temperature overnight. Although we have previously shown that size isolated microbubble samples were stable at 4 °C for at least 2 weeks (Feshitan, Chen 2009), all the microbubble samples used for this study were freshly prepared within 24 hrs to ensure experimental consistency.
2.3. RGD Peptide Conjugation to Targeted Microbubbles
The microbubble sample was centrifuged to expel the PBS, and the cake re-suspended in 1 mL PBS with 5 mM EDTA (pH 6.5). Cyclic cysteine-tagged RGD peptide was added to react with the maleimide functional groups presented on the distal ends of the PEG chains, at a molar ratio of 30:1 (RGD:maleimide) (Chen and Borden 2010). The reaction was carried out on a benchtop rotator for 12 hours at room temperature. Unreacted RGD peptide was removed by centrifuging the microbubble suspension at 110G for 1 min. The microbubble cake was then re-suspended in 1 mL PBS and analyzed for size and concentration by the Multisizer III. We have previously shown that small ligands with molecular weight <1 kDa, such as RGD peptide, can diffuse freely through the longer PEG brush layer and react completely with the functional groups at the distal end of the shorter PEG chains (Chen and Borden 2010).
2.4. Ultrasound Imaging
All animal experiments were conducted according to the National Institutes of Health guidelines and approved by the Columbia University Institutional Animal Care and Use Committee. Female CD-1 mice between 4 to 8 weeks of age (Charles River Laboratories; Wilmington, MA) were used for the contrast persistence studies. The mouse was first anesthetized in an induction chamber using aerosolized 2% isoflurane in an oxygen carrier. Once sedated, the mouse was placed in the prone position on a heated platform while continuously breathing 1–2% isoflurane in oxygen via nosecone delivery for the duration of the experiment. The animal heart rate, respiratory rate and temperature were monitored using a TMH-150 physiological monitoring unit (VisualSonics; Toronto, Ontario, Canada). The mouse back was shaved with an electric clipper, and depilatory cream was applied to dissolve any remaining hair that would interfere with the ultrasound imaging. A modified 27-gauge, ½-inch butterfly catheter (Terumo Medical Corporation; Somerset, NJ) was inserted into the tail vein for microbubble injections. A Visualsonics Vevo 770 small animal ultrasound imaging scanner with a 40-MHz imaging transducer was placed over the kidney region and coupled with Aquasonic-100 ultrasound transmission gel (Parker Laboratories; Fairfield, NJ).
In order to ensure stability, the concentrations of all microbubble samples were maintained above 1×10⁹ #/mL during storage. Just before the contrast agent injection, the microbubble sample was diluted to 500 µL at 1×10⁸ #/mL concentration in sterilized 0.9% NaCl saline solution (Hospira, Inc.; Lake Forest, IL). A 50-µL bolus of the diluted microbubble sample was injected while imaging data were continuously acquired, followed immediately by 50 µL sterilized saline flushing solution. The kidney was selected because of the proximity to the skin surface and the high percentage of cardiac output. Contrast mode images were collected while respiratory gating was applied to reduce motion artifact during data analysis. The effective frame rate during image acquisition was between 1–2 frames/sec. At the focal length (6 mm), the peak negative pressure was 3.49 MPa with an acoustic power of 0.017 mW and a mechanical index of 0.57. The time-gain compensation (TGC) settings were kept at a value of 10 throughout all imaging sessions to allow signal linearization during data analysis. The video data were collected prior to the bolus injection of microbubbles and was continued for up to 30 min to allow the majority of microbubbles to be cleared by the animal. Data were acquired in intervals of 5–10 minutes imaging with 2–5 minute breaks. If microbubbles were still visibly circulating after 30 minutes in the bloodstream, the image acquisition was prolonged to accommodate the longer persistence. Only one microbubble injection was given to each mouse to minimize effects of a potential immune response caused by repeated injections (n = 6–8 per group). Following the imaging session, the anesthesia was removed, and the mouse was returned to its cage after regaining consciousness.
2.5. Data Analysis
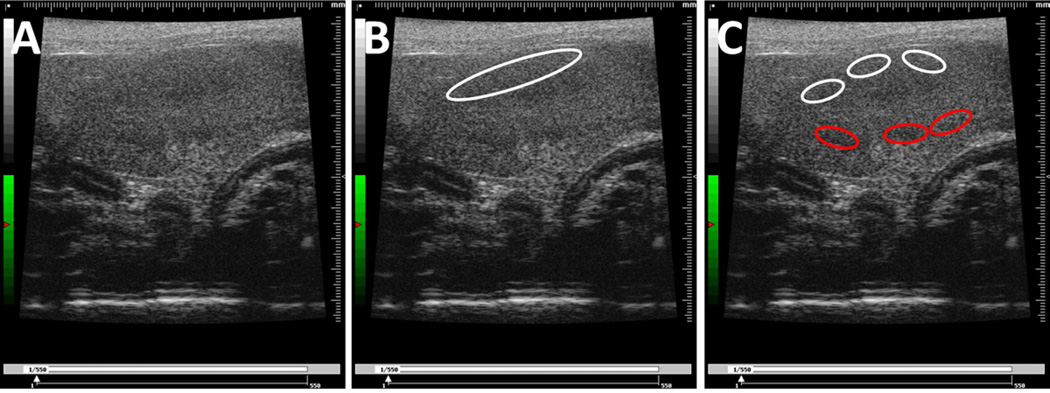
Image analysis was done using the Visualsonics Vevo 770 application software and a custom image processing program in LabView (National Instruments Corporation; Austin, TX). Several regions of interest (ROIs) were selected and analyzed to ensure data consistency and estimate pharmacokinetic parameters (Fig. 2). First, one large ROI in the upper portion of the kidney was selected to give the maximum increase of signal intensity while minimizing effects of signal attenuation and shadowing (Fig. 2B). Second, multiple ROIs were drawn across different regions of the kidney (Fig. 2C). The multiple ROIs were divided into two groups: three in the upper region and three in the lower region of the kidney. The measured signal intensity was averaged within these two groups, and the final values were used for analysis. All images were examined to ensure that there was no gross movement of the kidney to cause ROI shifting. The contrast enhancement was calculated using the linearized mean grayscale video intensity and determined by integrating the pixel intensity values over the ROI in every acquired frame. All computed contrast enhancement data sets were baseline adjusted and plotted using Prism 5 graphing software (Graphpad Software, Inc.; La Jolla, CA).
Figure 2.
Typical images of the mouse kidney showing the drawing of two sets of regions of interest (ROIs) following two different selection criteria. (A) The original image of the kidney. (B) The image of the kidney with one large ROI selected in the upper portion. (C) The image of the kidney with multiple smaller ROIs selected across different regions of the kidney, with upper ROIs labeled white and lower ROIs labeled red.
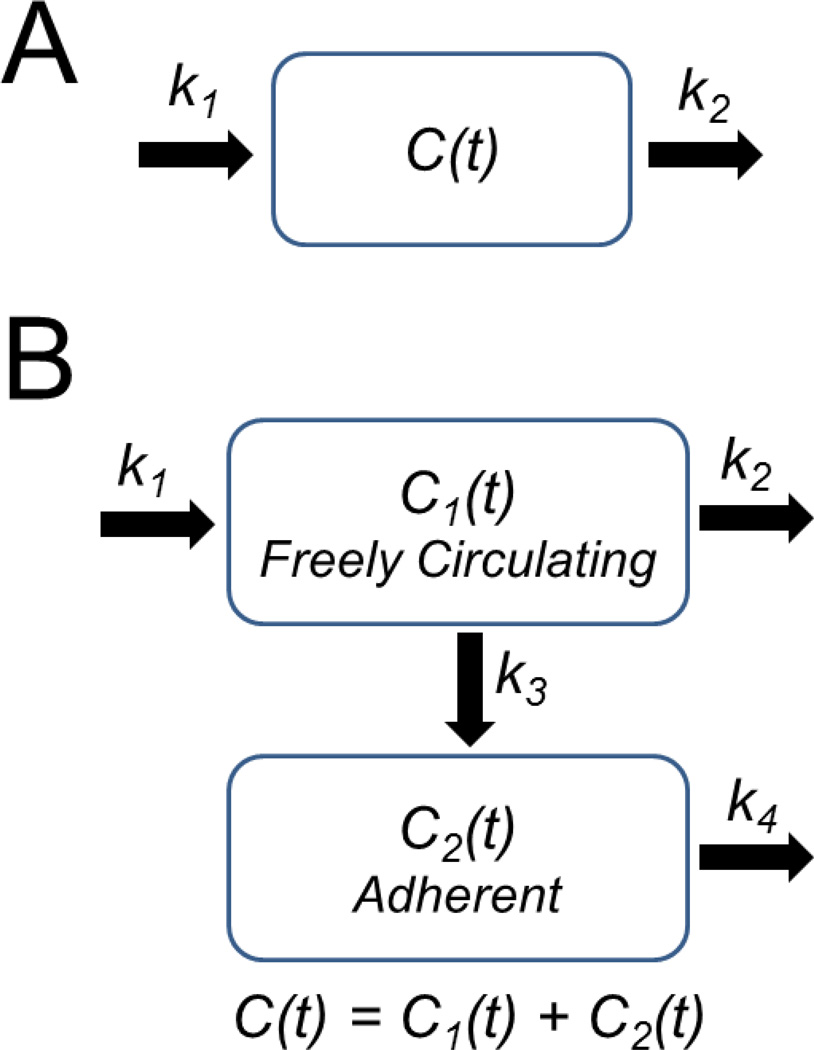
Two pharmacokinetic models were used to describe microbubble perfusion in the kidney: a standard single-compartment model (Saltzman 2001, Sirsi, Feshitan 2010) and a two-compartment model recently developed by Sirsi et al. (Sirsi, Hernandez 2011) (Fig. 3). The single-compartment model assumes first-order kinetics for the uptake and elimination of microbubbles in the vasculature (Fig. 3A). The contrast signal, C, is given as a function of time, t, according to the following relation:
| (1) |
where C0 is the “dose” of contrast, k1 is a pseudo-first-order rate constant describing the influx of the contrast agent into the kidney vasculature and k2 is a pseudo-first-order rate constant describing elimination of the contrast agent from the kidney vasculature.
Figure 3.
Schematic of pharmacokinetic models. A) Single-compartment model. The coefficients k1 and k2 are pseudo-first-order rate constants that describe the influx or efflux of ultrasound contrast from the intravasculature compartment. B) Two-compartment model. Compartment 1 contains freely circulating microbubbles, and compartment 2 contains trapped microbubbles. The coefficients k1 through k4 are pseudo-first-order rate constants that describe the influx or efflux of ultrasound contrast for compartments 1 and 2, as shown.
The two-compartment model assumes that circulating contrast agents can irreversibly adhere to the vascular wall or otherwise become trapped in the microvasculature, where they slowly degrade through dissolution and other mechanisms (Fig. 3B). Microbubble trapping in the vasculature contributes to loss of contrast from freely circulating microbubbles. The total contrast, C, is given by the sum of the contributions from freely circulating and trapped microbubbles:
| (2) |
| (3) |
| (4) |
where C1 is the contrast enhancement from the freely circulating microbubbles (compartment 1), C2 is the contrast enhancement from trapped microbubbles (compartment 2), k3 is a pseudo-first-order rate constant describing the influx into compartment 2 and k4 is a pseudo-first-order rate constant describing the elimination of microbubbles from compartment 2.
The two-compartment model parameters were determined from time-intensity curves (TICs) and time-fluctuation curves (TFCs) as follows. TICs were generated by plotting the integrated (average) contrast in the selected ROIs as a function of time and represented the total contrast enhancement (compartments 1 and 2). TFCs were generated by speckle decorrelation and represented the contrast from only freely circulating microbubbles (Sirsi, Hernandez 2011). The speckle decorrelation technique used to determine TFCs employed a normalized cross-correlation algorithm (Rubin, Fowlkes 1999):
| (5) |
where f(x,y) is the pixel value at a given time t, t-1 indicates the previous frame, f̄ is the mean pixel intensity in the ROI and σ is the standard deviation. R(t) is a relative index of similarity between two neighboring ultrasound images and a measure of the change in the speckle pattern caused by circulating microbubbles. The time-fluctuation signal, R(t), was used to determine the parameter kout = k2 + k3, which describes the rate of total contrast elimination. The time-intensity signal, C(t), was then fit with equations 2–4 to estimate C0, k1, k2, k3 and k4. A detailed methodology for performing the two-compartment analysis was described by Sirsi et al. (Sirsi, Hernandez 2011).
Single-compartment model parameters were determined from TICs using Prism 5 software. The fitted TICs were used to obtain maximum contrast signal intensity and persistence half-life. TFCs and TICs were obtained using a custom Labview program to determine the two-compartment model parameters. Students’ t-tests were done to compare statistical significance.
3. Results and Discussion
3.1. Microbubble Size Distribution
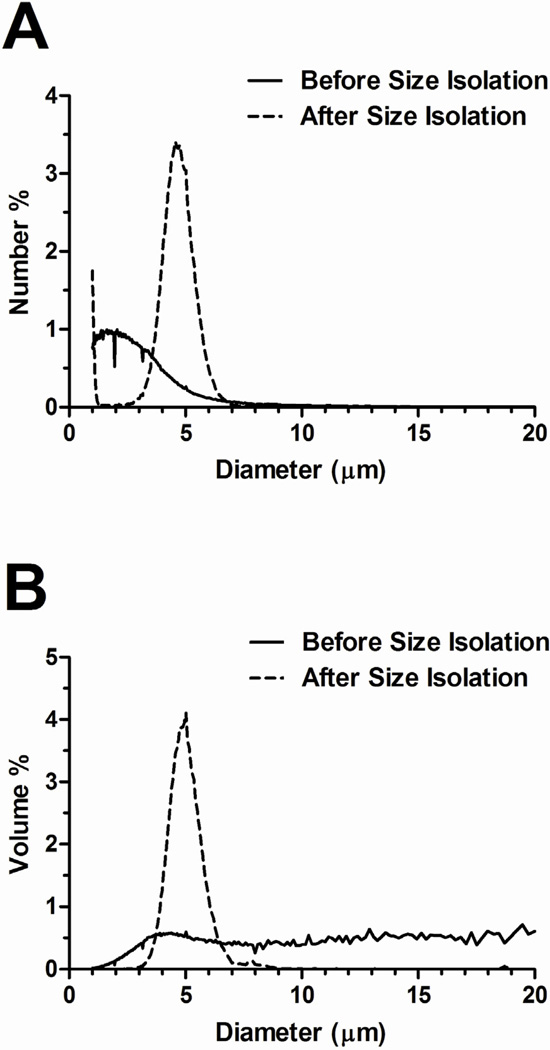
The probe sonication method produced a milky, white microbubble suspension that was stable over the experimental timeframe. Fresh microbubble suspensions were highly polydisperse in size as measured by the Multisizer III (Fig. 4). The number-weighted size distribution showed that most of the microbubbles (>90%) were smaller than 4 µm diameter. Interestingly, the Multisizer III measurement did not show distinct peaks (at 1–2 µm, 4–5 µm and 6–8 µm) to indicate a multimodal size distribution in either number- or volume-weighted data, as we previously reported using the Accusizer 280A (Particle Sizing Systems, Santa Barbara, CA) (Feshitan, Chen 2009).
Figure 4.
Typical microbubble number- (A) and volume-weighted (B) size distributions before and after size isolation. Freshly made microbubble suspensions were highly polydisperse, with most of the microbubbles (>90%) smaller than 4 µm (based on number-weighted size distribution).
Differential centrifugation was used to isolate 4–5 µm diameter microbubbles from the polydisperse mix (Feshitan, Chen 2009, Sirsi, Feshitan 2010). Size selection significantly reduced size polydispersity (Fig. 4). Additionally, the size distributions were similar between samples. Table 2 lists the initial concentration, mean diameter and injected gas volume for each microbubble group. The initial size distributions were statistically the same for the ELA and BLA microbubbles, since any initial differences were effectively eliminated through the size selection protocol. Therefore, there was no significant difference in the injected gas volume, which was calculated based on the volume-weighted mean diameter.
Table 2.
Microbubble size distributions and concentrations.
| Initial Concentration (#/mL) |
Number-Weighted Mean Diameter (µm) |
Volume-Weighted Mean Diameter (µm) |
Injected Gas Volume (µL) |
|
|---|---|---|---|---|
| Samples | (Mean) | (Mean ± SD) | (Mean ± SD) | (Mean) |
| ELA-control | 3.93E+09 | 4.3 ± 0.1 | 5.0 ± 0.0 | 0.32 |
| ELA-RGD | 2.39E+09 | 4.2 ± 0.2 | 4.9 ± 0.1 | 0.31 |
| BLA-control | 2.09E+09 | 4.4 ± 0.2 | 5.2 ± 0.1 | 0.37 |
| BLA-RGD | 2.04E+09 | 4.0 ± 0.2 | 4.8 ± 0.2 | 0.29 |
3.2. High Frequency In Vivo Imaging
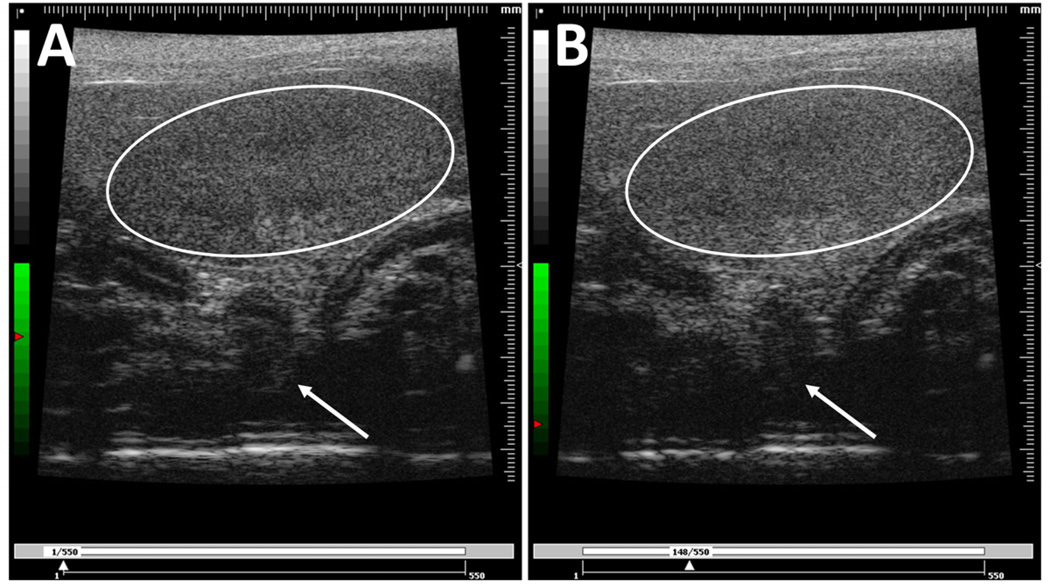
All mice were given a 50-µL bolus injection of microbubbles at 1×10⁸ #/mL concentration. Images of the left kidney were recorded using a high-resolution small-animal ultrasound scanner operating the fundamental mode with a 40-MHz transducer. Figure 5 shows representative ultrasound images of the mouse kidney before and after a bolus injection of ELA-RGD microbubbles. All four microbubble groups showed noticeable positive contrast enhancement after the bolus injection. An increase of brightness and speckling was observed throughout the kidney region. However, shadowing was observed in the lower regions of the video images, as denoted by the arrow in Fig. 5. The change of signal intensity calculated using the contrast detection software was similar between ELA and BLA samples, regardless of the presence of the targeting ligands, indicating that the surface architecture of the microbubbles did not affect the signal enhancement ability of these contrast agents.
Figure 5.
Typical images of the mouse kidney before (A) and after (B) a bolus injection of microbubbles. The kidney region is outlined in white. An observable increase of pixel intensity and speckling was seen in the kidney region. Arrows point to the microbubble shadowing effect.
3.2.1. ROI Selection
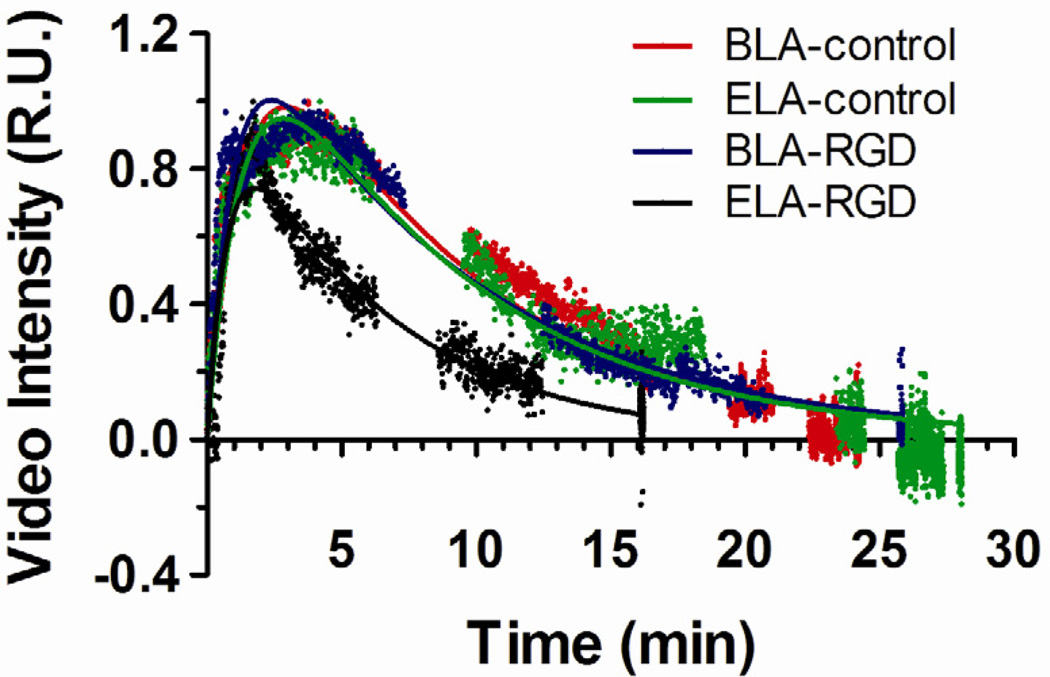
In order to ensure that the selection of ROIs correctly represented the signal change of the entire kidney, two sets of ROIs were drawn for analysis following two different selection criteria (Fig. 2). Time-intensity curves (TICs) of both sets of ROIs were generated for comparison to ensure data consistency. Figure 6 shows typical normalized TICs generated from the single large ROI in the upper portion of the kidney (Fig. 2B) for each microbubble formulation, together with the fitted one-compartment pharmacokinetic model results (discussed below). Both ELA-control and BLA-control microbubbles gave similar persistence in circulation. The TICs for BLA-RGD microbubbles were similar to the ones for BLA-control, with similar contrast enhancement level and persistence time. For ELA-RGD microbubbles, the observed circulation time was noticeably shorter than for ELA-control.
Figure 6.
Typical time-intensity curves (TICs) generated using the single large ROI in the upper portion of the mouse kidney. All data were baseline corrected using background images before injection as the corresponding reference. TICs were normalized by the maximum video intensity for comparison. The one-compartment pharmacokinetic model fits are shown as solid lines.
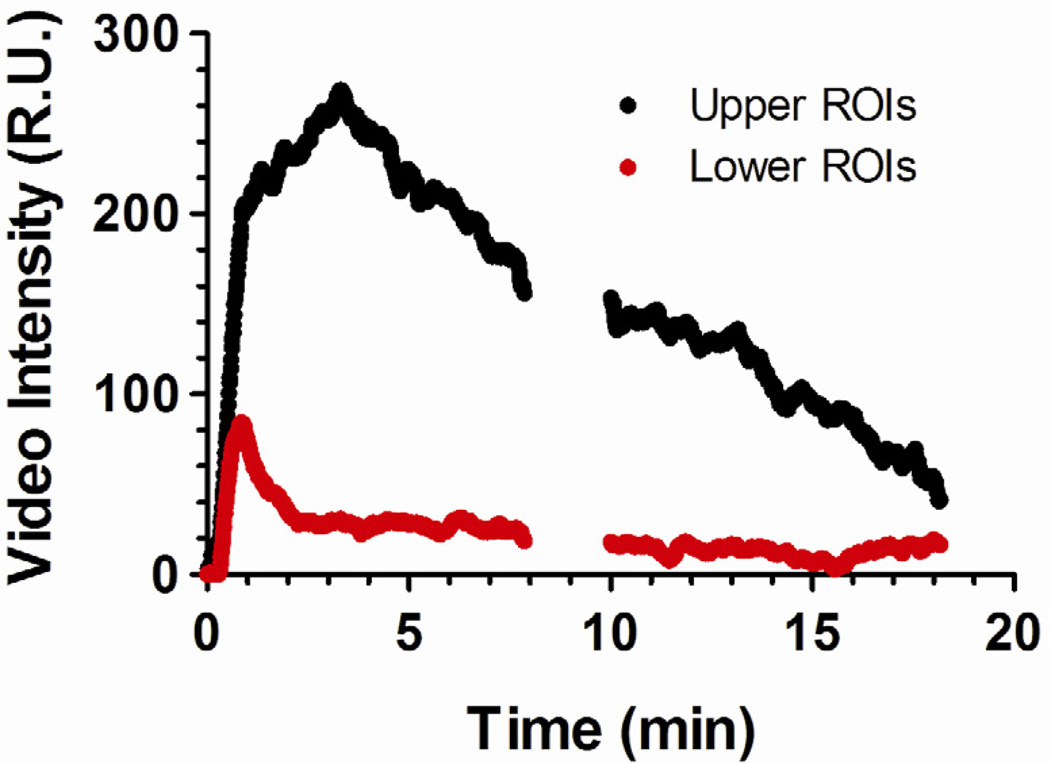
A second set of TICs were generated using the averaged intensity values from the multiple smaller ROIs in both the upper and lower portions of the kidney. Figure 7 compares representative TICs. The lower ROIs (red ROIs in Fig. 2C) provided less signal intensity when compared to the upper ROIs (white ROIs in Fig. 2C), ranging between 20% and 65% for each microbubble group. This result was attributed to signal attenuation (shadowing) from microbubbles in the upper portion of the kidney. The reduced signal in the lower ROIs therefore did not correlate with the amount of contrast perfusion through the tissue and consequently were not used to generate the TICs for pharmacokinetic analysis. However, the lower ROIs encompassed more hypoechoic portions of the kidney and could be used to evaluate the fluctuation of the ultrasound contrast signal caused by microbubble motion. Therefore, the lower ROIs were used to generate TFCs for use in the two-compartment model.
Figure 7.
Representative time-intensity curve (TICs) obtained for BLA-RGD microbubbles in the mouse kidney using the smaller ROIs shown in Figure 2. Significantly reduced signal intensities were observed in the lower ROIs for all microbubble groups, indicating microbubble-induced attenuation.
3.2.2. One-Compartment Pharmacokinetic Model
A one-compartment pharmacokinetic model was used to analyze the TICs generated using the single large ROI, in order to determine the signal amplitude and contrast persistence for microbubbles with different surface architectures. The model assumes that microbubbles are well mixed within the intravascular compartment and there is no passive accumulation (trapping) of contrast agents within the kidney vasculature. While these assumptions may not fully describe the kinetics of microbubble influx and clearance in circulation, the model fit the data generally well (Fig. 6), with typical R2 > 0.90, and allowed the quantification and comparison of several important pharmacokinetic parameters.
The signal amplitude was determined by the maximum signal intensity increase using the model curve fits to the TICs. There was no significant difference in signal amplitude between exposed and buried surface architectures as determined by a Students’ t-test (P = 0.50 for ELA-control vs. BLA-control). In addition, the presence of the targeting ligand did not affect the signal amplitude (P = 0.18 for ELA-control vs. ELA-RGD and P = 0.88 for BLA-control vs. BLA-RGD), indicating that contrast enhancement depended on microbubble diameter, or the gas core volume, not the surface architecture.
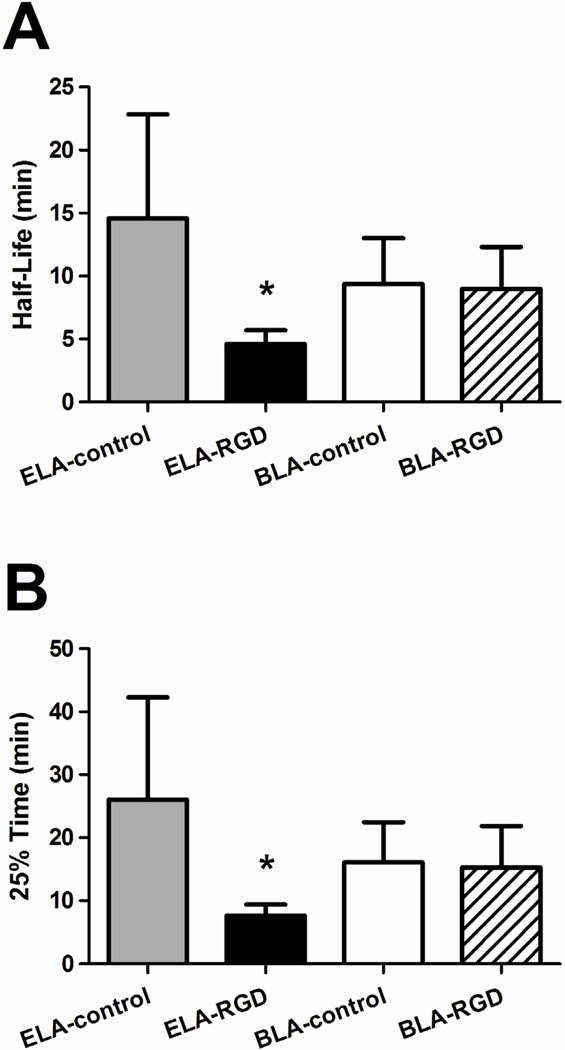
The contrast circulation time was characterized by two parameters: persistence half-life and 25% time point, which was the time point when the signal intensity dropped down to 25% of its maximum amplitude value (Fig. 8) (Mullin, Gessner 2011). For the same number of microbubbles injected (5×10⁶ #/bolus), ELA-control showed the longest persistence half-life with the largest uncertainties (14.6 ± 8.3 min), while BLA-control had a non-statistically different persistence half-life (9.4 ± 3.7 min, P = 0.20). Likewise, ELA-control showed the longest 25% time (26.0 ± 16.2 min), while BLA-control gave a comparable measurement (16.0 ± 6.4 min) with no statistical difference (P = 0.19) (Fig. 8B).
Figure 8.
Persistence half-life and 25% time point of microbubbles obtained using the one-compartment pharmacokinetic model. The half-life (A) was determined from the TIC data at which the signal intensity decayed to half of its maximum amplitude, and the 25% time point (B) was determined at which the signal intensity decayed to 25% of its maximum amplitude. Significant persistence difference was measured between ELA-RGD and ELA-control (P < 0.01 for both persistence half-life and 25% time point), while BLA-RGD and BLA-control microbubbles showed similar circulation time (P = 0.86 for persistence half-lfie and P = 0.84 for 25% time point). This data supported the hypotheses that exposed RGD may lower in vivo circulation time, and the PEG overbrush may increase it back to control levels.
For the targeted microbubbles, ELA-RGD showed significantly reduced persistence half-life (4.6 ± 1.1 min) when compared to ELA-control (P < 0.01). The exposure of RGD peptide on the surface shortened the microbubble circulation time by ~68%. The 2-fold longer persistence between BLA-RGD and ELA-RGD for these 4–5 µm diameter microbubbles was greater than that observed previously for ~1-µm polydisperse microbubbles (Borden, Sarantos 2006). Likewise, the 25% time point for ELA-RGD microbubbles was shortened significantly as well, down to 7.6 ± 1.8 min, representing a 71% decrease when compared to ELA-control. On the other hand, BLA-RGD microbubbles showed a remarkably similar persistence half-life (9.0 ± 3.3 min) as BLA-control with no statistical difference (P = 0.86), supporting the hypothesis that the buried-ligand architecture protected the RGD peptide from being detected by the immune system, and therefore prolonged the contrast persistence. Similarly, the 25% time point for targeted BLA-RGD microbubbles did not show a difference from BLA-control (P = 0.84), once again rendering support to the protective role of the PEG overbrush.
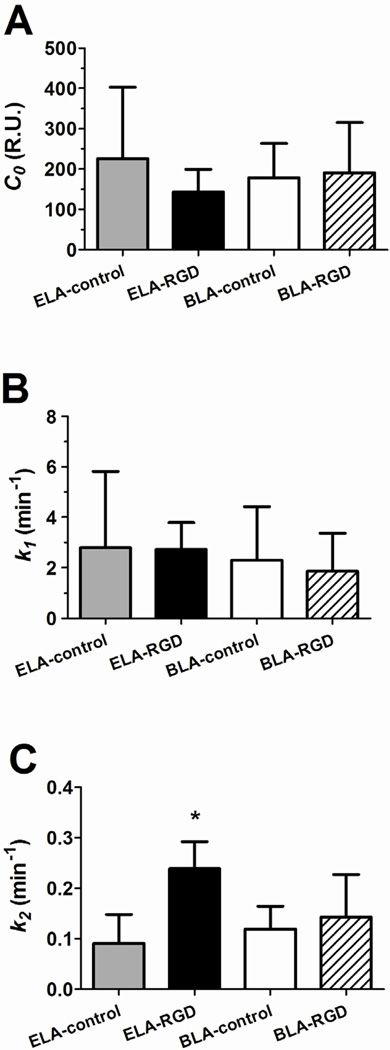
Figure 9 compares the single-compartment model fitted parameters C0, k1 and k2 among the different microbubble surface architectures. The C0 parameter (Fig. 9A) is the fitted “dose” of contrast intensity and, as with the maximum signal amplitude, showed no statistical difference between the groups.
Figure 9.
Fitted parameters of the TIC data using the one-compartment pharmacokinetic model. The parameters were determined using least-squares regression. (A) C0 is proportional to the signal amplitude. No significant difference was measured across microbubble samples (P = 0.23 for ELA-control vs. ELA-RGD, P = 0.57 for ELA-control vs. BLA-control and P = 0.85 for BLA-RGD vs. BLA-control). (B) k1 is a measure of the influx rate of the microbubbles into the kidney. No significant difference was measured across the samples (P = 0.95 for ELA-control vs. ELA-RGD, P = 0.75 for ELA-control vs. BLA-control and P = 0.69 for BLA-RGD vs. BLA-control). (C) k2 is a measure of the decay rate of the microbubble signal. ELA-RGD showed significantly more rapid contrast elimination when compared to BLA-RGD (P < 0.05), ELA-control (P < 0.001) or BLA-control (P < 0.001).
The k1 parameter (Fig. 9B) is a measure of the inflow rate of the contrast agents in the mouse kidney. No trend was observed among the tested microbubble groups with mean k1 values ranging between 1.9 and 2.8 min−1. The lack of a trend was as expected since the influx rate depended on the bolus injection speed, spreading of microbubbles in circulation and perfusion into the kidney.
The k2 parameter (Fig. 9C) is a measure of the clearance rate of the contrast agents in the mouse kidney. No significant difference of the k2 parameter was detected between ELA-control and BLA-control (P = 0.36). For targeted microbubbles, however, ELA-RGD showed a significantly higher k2 value when compared to ELA-control (P < 0.001), while BLA-RGD microbubbles gave a similar k2 value as their BLA-control counterparts (P = 0.56).
3.2.3. Two-Compartment Pharmacokinetic Model
For surface-modified microbubbles, it is possible that specific or non-specific interactions may result in accumulation of these contrast agents onto the vasculature during imaging. Cationic, anionic and amphoteric microbubbles may be prone to nonspecific adhesion to the vasculature, possibly through mediation by complement proteins (Anderson, Tsutsui 2007, Lindner, Coggins 2000, Sirsi, Hernandez 2011). We recently found that ELA-RGD microbubbles have a net negative surface charge and fix complement C3/C3b (Chen and Borden 2011). To test for nonspecific vascular adhesion and microvascular trapping, we used a two-compartment pharmacokinetic model (Fig. 3B). The model separates the total signal into two subcomponents that describe (1) the signal intensity generated by freely circulating microbubbles and (2) the signal intensity generated by non-circulating microbubbles. This two-compartment model has been used successfully to delineate the contrast signal from freely circulating and adherent gene therapy microbubbles in the kidney vasculature (Sirsi, Hernandez 2011).
Figure 10 shows a comparison of the two-compartment model fitted parameters among the four microbubble groups. Similar to the result obtained using the one-compartment model, the fitted C0 parameter once again did not show a significant difference between either the control and targeted microbubbles, or microbubbles with different surface architectures.
Figure 10.
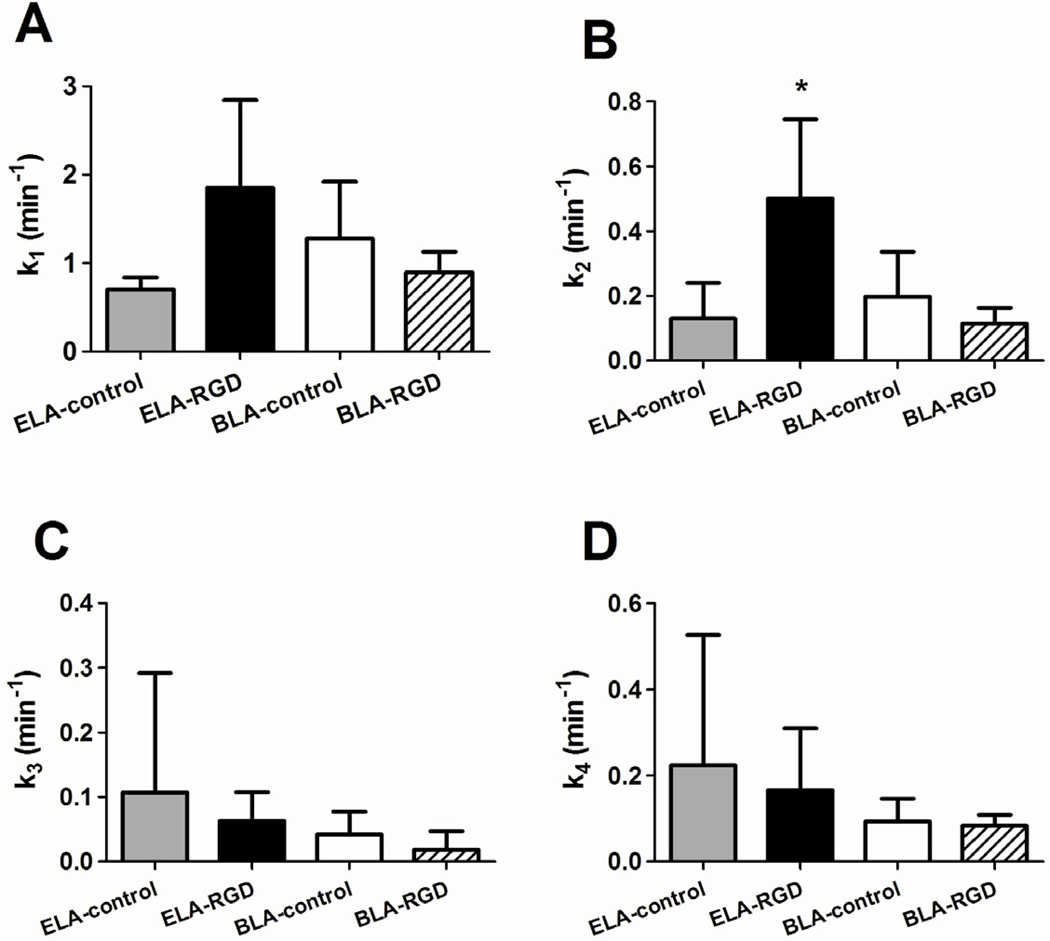
Fitted parameters using the two-compartment pharmacokinetic model. (A) k1 is a measure of the influx rate of microbubbles into the kidney. No significant difference was detected among the four groups (P = 0.09 for ELA-control vs. ELA-RGD, P = 0.20 for ELA-control vs. BLA-control and P = 0.30 for BLA-RGD vs. BLA-control). (B) k2 is the microbubble elimination rate due to mechanisms other than trapping in the kidney vasculature. ELA-RGD showed significantly faster clearance rate than BLA-RGD (P < 0.05) and ELA-control (P < 0.05), but not BLA-control (P = 0.05). (C) k3 is the adhesion rate constant of microbubbles adherent to the kidney vasculature. No significant difference was observed among the groups (P = 0.58 for ELA-control vs. ELA-RGD, P = 0.51 for ELA-control vs. BLA-control and P = 0.34 for BLA-RGD vs. BLA-control). (D) k4 is the microbubble dissolution rate constant. No significant difference was detected among the groups (P = 0.68 for ELA-control vs. ELA-RGD, P = 0.42 for ELA-control vs. BLA-control and P = 0.74 for BLA-RGD vs. BLA-control).
Analogous to the one-compartment model, the k1 parameter (Fig. 10A) is the rate constant that describes the influx of microbubbles into the mouse kidney vasculature upon injection. Once again, no statistical difference of the k1 parameter was detected among the microbubble groups.
The k2 parameter (Fig. 10B) in the two-compartment model is the rate constant that describes the elimination of microbubbles from circulation owing to mechanisms other than trapping in the kidney vasculature, such as dissolution, active clearance by the MPS and filtering by the lung, liver and spleen. No significant difference of the k2 parameter was detected between ELA-control and BLA-control (P = 0.52). For targeted microbubbles, ELA-RGD showed a significantly faster clearance rate in comparison to ELA-control (P < 0.05), once again, indicating ligand exposure-induced elimination. On the other hand, BLA-RGD microbubbles had a similar k2 value as their BLA-control counterparts (P = 0.30).
The k3 parameter (Fig. 10C) is the rate constant that describes the elimination of microbubbles from circulation due to passive accumulation or non-specific adhesion. No trend was observed among the four groups with mean k3 values ranging between 0.02 and 0.11 min−1, which was on average ~25% lower than the corresponding k2 values. This result indicated that none of the microbubble groups, including those exposing RGD, were being trapped to a significant degree within the kidney vasculature.
Finally, the k4 parameter (Fig. 10D) is the rate constant that describes the elimination of trapped microbubbles from the kidney vasculature. Since the model assumes irreversible accumulation of contrast agents onto to the kidney endothelium, the k4 parameter mainly accounts for the dissolution rate of the trapped microbubbles. No significant difference was detected for the k4 parameter, which ranged from 0.08 to 0.22 min−1. Therefore, we may conclude that none of the microbubble samples adhered significantly to the kidney vasculature, and that the assumption of a single intravascular compartment of freely circulating contrast agents was valid. Furthermore, since size, polydispersity and concentration were held constant, within experimental error, we concluded that surface chemistry was responsible for the differences in circulation time.
4. Conclusion
Microbubbles with various surface architectures were generated and size selected using the differential centrifugation technique. RGD peptide was conjugated to the surface as the targeting ligand by post-labeling. The contrast enhancement and circulation persistence of these microbubbles were determined from images of the mouse kidney using a high-frequency ultrasound scanner. For the same injected size, polydispersity and concentration, microbubbles with various surface architectures produced similar contrast enhancement regardless of the presentation of the targeting ligands on the surface. However, their contrast persistence was highly influenced by the surface chemistry and PEG brush architecture. Exposure of RGD resulted in significantly shortened circulation time for ELA-RGD microbubbles when compared to ELA-control (68% reduction in persistence half-life). On the other hand, the buried-ligand architecture successfully protected the RGD peptide from exposure to the immune system and thus prolonged the bloodstream persistence to control levels. These results demonstrate the importance of considering ligand presentation in determining the in vivo circulation profile of targeted microbubbles. We expect these trends to be relevant clinically owing to similar clearance mechanisms in humans, although the effects of lower ultrasound frequencies on microbubble oscillation and accompanying opsonization must also be considered. Ultimately, targeting with the BLA using ultrasound radiation force still remains to be shown in vivo.
Acknowledgements
We thank Dr. Shunichi Homma for access to his Vevo 770 and Dr. Shinichi Iwata for help with the animal handling. This research was supported by NIH R01 EB009066.
Footnotes
Publisher's Disclaimer: This is a PDF file of an unedited manuscript that has been accepted for publication. As a service to our customers we are providing this early version of the manuscript. The manuscript will undergo copyediting, typesetting, and review of the resulting proof before it is published in its final citable form. Please note that during the production process errors may be discovered which could affect the content, and all legal disclaimers that apply to the journal pertain.
References
- Anderson CR, Rychak JJ, Backer M, Backer J, Ley K, Klibanov AL. scVEGF Microbubble Ultrasound Contrast Agents A Novel Probe for Ultrasound Molecular Imaging of Tumor Angiogenesis. Investigative Radiology. 2010;45:579–585. doi: 10.1097/RLI.0b013e3181efd581. [DOI] [PMC free article] [PubMed] [Google Scholar]
- Anderson DR, Tsutsui JM, Xie F, Radio SJ, Porter TR. The role of complement in the adherence of microbubbles to dysfunctional arterial endothelium and atherosclerotic plaque. Cardiovascular Research. 2007;73:597–606. doi: 10.1016/j.cardiores.2006.11.029. [DOI] [PubMed] [Google Scholar]
- Borden MA, Dayton PA. Targeted ultrasound contrast agents. In: Pomper MG, Gelovani JG, editors. Molecular Imaging in Oncology. New York: Informa Healthcare USA, Inc.; 2008. p. 329. [Google Scholar]
- Borden MA, Qin S, Ferrara KW. Ultrasound Contrast Agents. In: Weissleder R, Ross BD, Rehemtulla A, Gambhir SS, editors. Molecular Imaging: Principles and Practice. 1 edn. Shelton: People's Medical Publishing House; 2010. p. 1359. [Google Scholar]
- Borden MA, Sarantos MR, Stieger SM, Simon SI, Ferrara KW, Dayton PA. Ultrasound radiation force modulates ligand availability on targeted contrast agents. Molecular Imaging. 2006;5:139–147. [PMC free article] [PubMed] [Google Scholar]
- Borden MA, Sarantos MR, Stieger SM, Simon SI, Ferrara KW, Dayton PA. Ultrasound radiation force modulates ligand availability on targeted contrast agents. B C Decker Inc; 2006. pp. 139–147. [PMC free article] [PubMed] [Google Scholar]
- Borden MA, Zhang H, Gillies RJ, Dayton PA, Ferrara KW. A stimulus-responsive contrast agent for ultrasound molecular imaging. Biomaterials. 2008;29:597–606. doi: 10.1016/j.biomaterials.2007.10.011. [DOI] [PMC free article] [PubMed] [Google Scholar]
- Chen CC, Borden MA. Ligand conjugation to bimodal poly(ethylene glycol) brush layers on microbubbles. Langmuir. 2010;26:13183–13194. doi: 10.1021/la101796p. [DOI] [PMC free article] [PubMed] [Google Scholar]
- Chen CC, Borden MA. The role of poly(ethelene glycol) brush architecture in complement activation on targeted microbubble surfaces. Biomaterials. 2011 doi: 10.1016/j.biomaterials.2011.05.027. [DOI] [PMC free article] [PubMed] [Google Scholar]
- Chen CC, Borden MA. The role of poly(ethylene glycol) brush architecture in complement activation on targeted microbubble surfaces. Biomaterials. 2011;32:6579–6587. doi: 10.1016/j.biomaterials.2011.05.027. [DOI] [PMC free article] [PubMed] [Google Scholar]
- Choi JJ, Feshitan JA, Baseri B, Wang Y-ST, Borden MA, Konofagou EE. Microbubble-size dependence of focused ultrasound-induced blood-brain barrier opening in mice in vivo. IEEE Trans. Biomed. Eng. 2010;57:145–155. doi: 10.1109/TBME.2009.2034533. [DOI] [PMC free article] [PubMed] [Google Scholar]
- Deshpande N, Ren Y, Foygel K, Rosenberg J, Willmann JK. Tumor Angiogenic Marker Expression Levels during Tumor Growth: Longitudinal Assessment with Molecularly Targeted Microbubbles and US Imaging. Radiology. 2011;258:804–811. doi: 10.1148/radiol.10101079. [DOI] [PMC free article] [PubMed] [Google Scholar]
- Dsouza SE, Ginsberg MH, Burke TA, Lam SCT, Plow EF. Localization of an Arg-Gly-Asp Recognition Site within an Integrin Adhesion Receptor. Science. 1988;242:91–93. doi: 10.1126/science.3262922. [DOI] [PubMed] [Google Scholar]
- Ferrante EA, Pickard JE, Rychak J, Klibanov A, Ley K. Dual targeting improves microbubble contrast agent adhesion to VCAM-1 and P-selectin under flow. J. Control. Release. 2009;140:100–107. doi: 10.1016/j.jconrel.2009.08.001. [DOI] [PMC free article] [PubMed] [Google Scholar]
- Ferrara K, Pollard R, Borden M. Ultrasound microbubble contrast agents: Fundamentals and application to gene and drug delivery. Annu. Rev. Biomed. Eng. 2007;9:415–447. doi: 10.1146/annurev.bioeng.8.061505.095852. [DOI] [PubMed] [Google Scholar]
- Feshitan JA, Chen CC, Kwan JJ, Borden MA. Microbubble size isolation by differential centrifugation. J Colloid Interface Sci. 2009;329:316–324. doi: 10.1016/j.jcis.2008.09.066. [DOI] [PubMed] [Google Scholar]
- Herzog CA. Incidence of adverse events associated with use of perflutren contrast agents for echocardiography. Jama-Journal of the American Medical Association. 2008;299:2023–2025. doi: 10.1001/jama.299.17.2023. [DOI] [PubMed] [Google Scholar]
- Hollinshead CM, Harvey RD, Barlow DJ, Webster JRP, Hughes AV, Weston A, Lawrence MJ. Effects of surface pressure on the structure of distearoylphosphatidylcholine monolayers formed at the air/water interface. Langmuir. 2009;25:4070–4077. doi: 10.1021/la8028319. [DOI] [PubMed] [Google Scholar]
- Israelachvili J. Intermolecular and Surface Forces. Academic Press; 1992. [Google Scholar]
- Kaufmann BA, Carr CL, Belcik JT, Xie A, Yue Q, Chadderdon S, Caplan ES, Khangura J, Bullens S, Bunting S, Lindner JR. Molecular imaging of the initial inflammatory response in atherosclerosis implications for early detection of disease. Arterioscler. Thromb. Vasc. Biol. 2010;30:54–U132. doi: 10.1161/ATVBAHA.109.196386. [DOI] [PMC free article] [PubMed] [Google Scholar]
- Lai PY, Zhulina EB. Structure of a bidisperse polymer brush: Monte Carlo simulation and self-consistent field results. Macromolecules. 1992;25:5201–5207. [Google Scholar]
- Leong-Poi H, Christiansen J, Heppner P, Lewis CW, Klibanov AL, Kaul S, Lindner JR. Assessment of endogenous and therapeutic arteriogenesis by contrast ultrasound molecular Imaging of integrin expression. Circulation. 2005;111:3248–3254. doi: 10.1161/CIRCULATIONAHA.104.481515. [DOI] [PubMed] [Google Scholar]
- Lindner JR, Coggins MP, Kaul S, Klibanov AL, Brandenburger GH, Ley K. Microbubble persistence in the microcirculation during ischemia/reperfusion and inflammation is caused by integrin- and complement-mediated adherence to activated leukocytes. Circulation. 2000;101:668–675. doi: 10.1161/01.cir.101.6.668. [DOI] [PubMed] [Google Scholar]
- Lindner JR, Dayton PA, Coggins MP, Ley K, Song J, Ferrara K, Kaul S. Noninvasive imaging of inflammation by ultrasound detection of phagocytosed microbubbles. Circulation. 2000;102:531–538. doi: 10.1161/01.cir.102.5.531. [DOI] [PubMed] [Google Scholar]
- Lyshchik A, Fleischer AC, Huamani J, Hallahan DE, Brissova M, Gore JC. Molecular Imaging of vascular endothelial growth factor receptor 2 expression using targeted contrast-enhanced high-frequency ultrasonography. Journal of Ultrasound in Medicine. 2007;26:1575–1586. doi: 10.7863/jum.2007.26.11.1575. [DOI] [PMC free article] [PubMed] [Google Scholar]
- Main ML. Ultrasound Contrast Agent Safety From Anecdote to Evidence. Jacc-Cardiovascular Imaging. 2009;2:1057–1059. doi: 10.1016/j.jcmg.2009.05.008. [DOI] [PubMed] [Google Scholar]
- Marsh D. Handbook of Lipid Bilayers. Boca Raton: CRC; 1990. [Google Scholar]
- Moghimi SM, Hunter AC. Recognition by macrophages and liver cells of opsonized phospholipid vesicles and phospholipid headgroups. Pharmaceutical Research. 2001;18:1–8. doi: 10.1023/a:1011054123304. [DOI] [PubMed] [Google Scholar]
- Mullin L, Gessner R, Kwan J, Kaya M, Borden MA, Dayton PA. Effect of anesthesia carrier gas on in vivo circulation times of ultrasound microbubble contrast agents in rats. Contrast Media & Molecular Imaging. 2011:7. doi: 10.1002/cmmi.414. [DOI] [PMC free article] [PubMed] [Google Scholar]
- Palmowski M, Huppert J, Ladewig G, Hauff P, Reinhardt M, Mueller MM, Woenne EC, Jenne JW, Maurer M, Kauffmann GW, Semmier W, Kiesslin F. Molecular profiling of angiogenesis with targeted ultrasound imaging: early assessment of antiangiogenic therapy effects. Molecular Cancer Therapeutics. 2008;7:101–109. doi: 10.1158/1535-7163.MCT-07-0409. [DOI] [PubMed] [Google Scholar]
- Pysz MA, Foygel K, Rosenberg J, Gambhir SS, Schneider M, Willmann JK. Antiangiogenic Cancer Therapy: Monitoring with Molecular US and a Clinically Translatable Contrast Agent (BR55) Radiology. 2010;256:519–527. doi: 10.1148/radiol.10091858. [DOI] [PMC free article] [PubMed] [Google Scholar]
- Rubin JM, Fowlkes JB, Tuthill TA, Moskalik AP, Rhee RT, Adler RS, Kazanjian SN, Carson PL. Speckle decorrelation flow measurement with B-mode US of contrast agent flow in a phantom and in rabbit kidney. Radiology. 1999;213:429–437. doi: 10.1148/radiology.213.2.r99nv14429. [DOI] [PubMed] [Google Scholar]
- Saltzman WM. Drug delivery: engineering principles for drug therapy. Oxford: Oxford University Press, Inc.; 2001. [Google Scholar]
- Sirsi S, Borden M. Microbubble compositions, properties and biomedical applications. Bub. Sci. Eng. Techn. 2009;1:3–17. doi: 10.1179/175889709X446507. [DOI] [PMC free article] [PubMed] [Google Scholar]
- Sirsi S, Feshitan J, Kwan J, Homma S, Borden M. Effect of microbubble size on fundamental mode high frequency ultrasound imaging in mice. Ultrasound Med. Biol. 2010;36:935–948. doi: 10.1016/j.ultrasmedbio.2010.03.015. [DOI] [PMC free article] [PubMed] [Google Scholar]
- Sirsi SR, Hernandez SL, Zielinski L, Blomback H, Koubaa A, Synder M, Homma S, Kandel J, Yamashiro DY, Borden MA. Polyplex-microbubble hybrids for ultrasound-guided plasmid DNA delivery to solid tumors. J. Control. Release. 2011 doi: 10.1016/j.jconrel.2011.09.071. [DOI] [PMC free article] [PubMed] [Google Scholar]
- Sirsi SR, Hernandez SL, Zielinski L, Blomback H, Koubaa A, Synder M, Homma S, Kandel J, Yamashiro DY, Borden MA. Polyplex-Microbubble Hybridsmicrobubble hybrids for Ultrasound-Guided Plasmidultrasound-guided plasmid DNA Deliverydelivery to Solid Tumorssolid tumors. J. Control. Release. 2011 doi: 10.1016/j.jconrel.2011.09.071. submitted. [DOI] [PMC free article] [PubMed] [Google Scholar]
- Streeter JE, Gessner R, Miles I, Dayton PA. Improving sensitivity in ultrasound molecular imaging by tailoring contrast agent size distribution: in vivo studies. Mol. Imaging. 2010;9:87–95. [PMC free article] [PubMed] [Google Scholar]
- Szebeni J. Complement activation-related pseudoallergy: A new class of drug-induced acute immune toxicity. Toxicology. 2005;216:106–121. doi: 10.1016/j.tox.2005.07.023. [DOI] [PubMed] [Google Scholar]
- Tardy I, Pochon S, Theraulaz M, Emmel P, Passantino L, Tranquart F, Schneider M. Ultrasound molecular imaging of VEGFR2 in a rat prostate tumor model using BR55. Investigative Radiology. 2010;45:573–578. doi: 10.1097/RLI.0b013e3181ee8b83. [DOI] [PubMed] [Google Scholar]
- Tung YS, Marquet F, Teichert T, Ferrera V, Konofagou EE. Feasibility of noninvasive cavitation-guided blood-brain barrier opening using focused ultrasound and microbubbles in nonhuman primates. Appl. Phys. Lett. 2011;98 doi: 10.1063/1.3580763. [DOI] [PMC free article] [PubMed] [Google Scholar]
- Vonarbourg A, Passirani C, Saulnier P, Benoit JP. Parameters influencing the stealthiness of colloidal drug delivery systems. Biomaterials. 2006;27:4356–4373. doi: 10.1016/j.biomaterials.2006.03.039. [DOI] [PubMed] [Google Scholar]
- Wang YX, Zhou J, Zhang YR, Wang XM, Chen JA. Delivery of TFPI-2 using SonoVue and adenovirus results in the suppression of thrombosis and arterial re-stenosis. Exp. Biol. Med. 2010;235:1072–1081. doi: 10.1258/ebm.2010.010046. [DOI] [PubMed] [Google Scholar]
- Wei K, Mulvagh SL, Carson L, Davidoff R, Gabriel R, Grimm RA, Wilson S, Fane L, Herzog CA, Zoghbi WA, Taylor R, Farrar M, Chaudhry FA, Porter TR, Irani W, Lang RM. The Safety of Definity and Optison for Ultrasound Image Enhancement: A Retrospective Analysis of 78,383 Administered Contrast Doses. Journal of the American Society of Echocardiography. 2008;21:1202–1206. doi: 10.1016/j.echo.2008.07.019. [DOI] [PubMed] [Google Scholar]
- Willmann JK, Cheng Z, Davis C, Lutz AM, Schipper ML, Nielsen CH, Gambhir SS. Targeted microbubbles for imaging tumor angiogenesis: Assessment of whole-body biodistribution with dynamic micro-PET in mice. Radiology. 2008;249:212–219. doi: 10.1148/radiol.2491072050. [DOI] [PMC free article] [PubMed] [Google Scholar]
- Xuan JW, Bygrave M, Valiyeva F, Moussa M, Izawa JI, Bauman GS, Klibanov A, Wang F, Greenberg NM, Fenster A. Molecular Targeted Enhanced Ultrasound Imaging of Flk1 Reveals Diagnosis and Prognosis Potential in a Genetically Engineered Mouse Prostate Cancer Model. Molecular Imaging. 2009;8:209–220. [PubMed] [Google Scholar]


