Abstract
The abrupt appearance of primates and hystricognath rodents in early Oligocene deposits of South America has puzzled mastozoologists for decades. Based on the geoclimatic changes that occurred during the Eocene/Oligocene transition period that may have favoured their dispersal, researchers have proposed the hypothesis that these groups arrived in synchrony. Nevertheless, the hypothesis of synchronous origins of platyrrhine and caviomorph in South America has not been explicitly evaluated. Our aim in this work was to apply a formal test for synchronous divergence times to the Platyrrhini and Caviomorpha splits. We have examined a previous work on platyrrhine and hystricognath origins, applied the test to a case where synchrony is known to occur and conducted simulations to show that it is possible to formally test the age of synchronous nodes. We show that the absolute ages of Platyrrhini/Catarrhini and Caviomorpha/Phiomorpha splits depend on data partitioning and that the test applied consistently detected synchronous events when they were known to have happened. The hypothesis that the arrival of primates and hystricognaths to the New World consisted of a unique event cannot be rejected
Keywords: eocene, oligocene, biogeography, South America, relaxed molecular clock
Introduction
The study of historical biogeography has changed dramatically since the appearance of cladistic methods in the 1960s. These early approaches placed biogeographical analyses in a phylogeny-based framework that relies mainly on pattern-associated taxon area cladograms.1,2 In that context, chronological information was considered unable to provide any useful substantiation to the understanding of the spatial distribution of a given species.3 Despite its popular beginning, historical biogeographic research using cladistic methods has remained relatively stagnant over the last two decades.4 In the late 1990s however, the availability of sophisticated methods to date times of species divergence5,6 revived interest in historical biogeography; the field was rejuvenated with many important insights that helped restore appreciation for the relevance of timescales.7–9 Today, it is generally accepted that chronological estimates are fundamental to understanding the spatial dimension of evolution.4
Moreover, many authors have stated the need for biogeographical analysis to be statistically grounded and allow hypothesis testing to play a central role in choosing between disputing evolutionary scenarios.10 In this sense, instead of formulating an a posteriori interpretation of historical phenomena, studies should make testable statements about the distribution of lineages in space and time. In this sense, mammalian evolution is replete with issues that can be subject to statistical scrutiny. For instance, the appearance of primates and hystricognath rodents in the Oligocene deposits of South America has for long been an issue of debate, especially with regards to the possibility of a synchronous transatlantic dispersion from Africa.11,12
The biogeographic scenario of the evolution of New World Primates (NWP, Platyrrhini) and Hystricognathi rodents (NWH, Caviomorpha) is pervaded with uncertainties, since the South American continent was an isolated landmass during the period when the earliest fossils of these mammalian orders were found.13,14 Moreover, the nearest continental source regions, North America and Antarctica, never yielded any anthropoid or hystricognath fossils older than the Eocene/Oligocene (E/O) transition period.
Nevertheless, anthropoids and hystricognaths are found in the African fossil record in earlier strata than their South American counterparts.15 Many African groups, such as parapithecid anthropoids and phiomorph rodents from the E/O deposits, also share morphological characters with South American Platyrrhini and Caviomorpha respectively.16–17 Molecular studies have also demonstrated that the living sister groups of these South American mammalian clades are African, namely, the catarrhine primates and phiomorph rodents.18–21 Therefore, it is likely that the ancestors of these endemic groups came from Africa through transatlantic rafting.22 This hypothesis is supported by climatic and geological changes that took place during the E/O transition.23
Because the fossil record is incomplete, numerous authors have used the molecular clock theory to investigate the South American invasion issue directly, by examining the specific biographical issue,7,18,24 or indirectly, by dating the Platyrrhini or Caviomorpha separation independently.19,25–27 However, such studies were unable to recover uniform divergence time estimates for NWP or NWH.
Transatlantic dispersion of a lineage occurs rarely, and thus, the arrival of primates and hystricognath rodents to the New World might have taken place under shared circumstances. Nevertheless, molecular studies that focus on both E/O mammalian invaders concomitantly are rare, with only one such report to date, which is by Poux et al.12 A joint analysis is essential to investigate whether the arrivals of primates and caviomorphs to the New World were synchronous or not. Ideally, this issue should be approached on statistical grounds to establish a credibility interval for the synchronous arrival hypothesis. This type of study would make an important contribution to the understanding of South American historical biogeography.
To achieve this goal, we used a statistical approach to formally evaluate the possibility that Platyrrhini and Caviomorpha had synchronous arrivals to the New World. We validated our method on simulated data. In addition, the efficiency of our statistical test in detecting synchronicity in cases where it is known to have happened was assessed with the analysis of a canonical example, namely, the evolution of the Hox gene family by gene duplication.
Materials and Methods
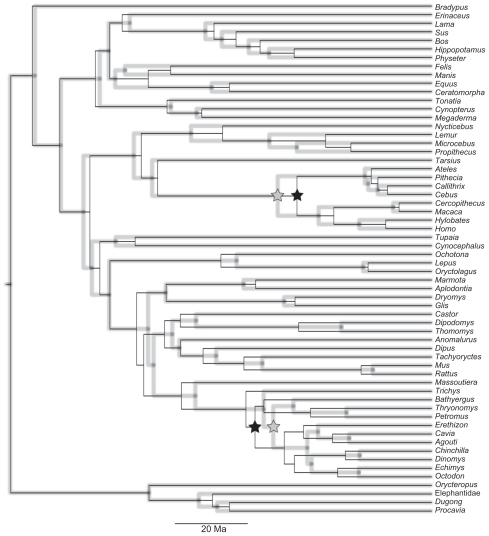
The rationale of our approach is that, in a Bayesian framework, if two divergences are synchronous, the posterior distribution of the difference D between the ages of the splits should include zero within the 95% highest probability density (HPD) interval. We used the data set of Poux et al (2006), hereafter referred to as P2006, to calculate the posterior distribution of D between the ages of the Caviomorpha/ Phiomorpha and Platyrrhini/Catarrhini splits. P2006 data set consisted of three nuclear genes: ADRA2B, vWF and IRBP (accession numbers are provided as supplementary information). To achieve this, we inferred divergence times using the same parametric settings adopted by the authors in MULTIDIVTIME (http://statgen.ncsu.edu/thorne/multidivtime.html). The F84 model of sequence evolution was used and all calibration information was identical to that of the P2006 study. We have, however, inferred divergence times by partitioning each gene by codon position independently, as implemented in P2006, and also by concatenating all genes in a single supermatrix. Bayesian divergence time inference was achieved via the Markov chain Monte Carlo (MCMC) algorithm. In both data sets, Markov chains were visited every 100th cycle. After an adjustable burn-in period, 10,000 samples were obtained to build the posterior distributions (Fig. 1). Burn-in periods and convergence of MCMC runs were accessed by calculation of the effective sample sizes (ESS) in the CODA package of the R programming environment (www.r-proiect.org). Only chains with ESS greater than 500 were used, for each sample, we have calculated the difference between the two splits. These values were used to obtain the posterior distributions of D (Fig. 2).
Figure 1.
Timescale of New World Primates and Hystricognathi rodents evolution inferred using the P2006 data set under partitioned (black line) and concatenated (grey line) schemes.
Note: Platyrrhini/Catarrhini and Caviomorpha/Phiomorpha splits are marked with stars.
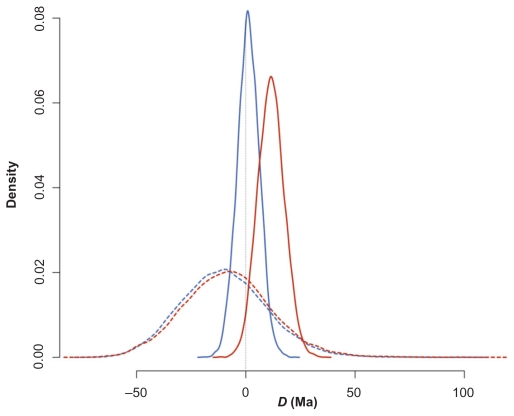
Figure 2.
Prior and posterior distribution of the difference D between the Platyrrhini/Catarrhini and Caviomorpha/Phiomorpha divergence times under partitioned (red) and concatenated (blue) data sets.
Notes: Solid lines, posterior distributions; dashed lines, prior distributions.
In synthesis, our hypothesis is that, if both divergences are statistically synchronous, ie, the null hypothesis of synchrony cannot be rejected, then the posterior distribution of the difference D between the estimates of the divergence times of NWP and NWH collected in each MCMC run, will include zero within the 95% HPD interval.
Validating the test on empirical data
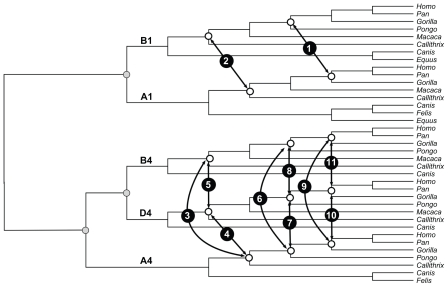
We also applied the rationale described above on an empirical data set in which the ages of the nodes are known to be synchronous. This is the case of the Hox gene family in mammals, which diversified via gene duplication. In the evolution of these genes, paralogous gene copies that had already duplicated before the diversification of mammals necessarily result in synchronous divergence (Fig. 3). Mammalian Hox genes were downloaded from OrthoMaM28 and aligned in PRANK.29 Phylogenies were inferred in PhyML 330 under the GTR+G8 model and divergence times were estimated in MULTIDIVTIME according to the previously described conditions; the posterior distributions of the differences between the ages of the node pairs shown in Figure 3 were computed.
Figure 3.
Hox gene family phylogeny depicting the pairs of splits in which the differences between divergence times were computed. Each pair is numbered respectively. Grey circles show the duplication events.
Validating the test with simulation
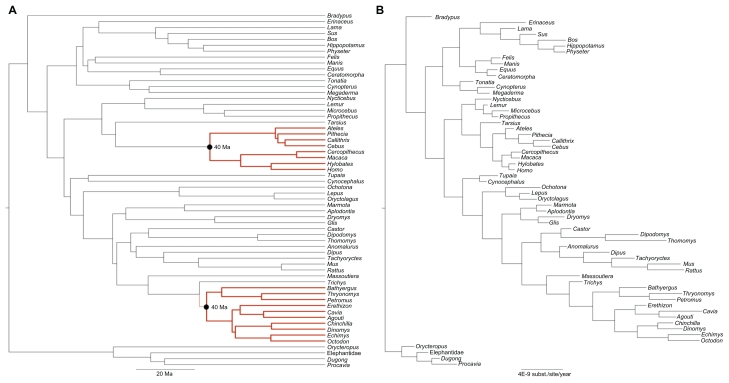
Finally, we asked what is the posterior distribution of D when node divergences are synchronous, and the evolutionary parameters of P2006 are also applied. To address this, we conducted a simulation using the same evolutionary settings inferred for the P2006 data set but constrained that the Caviomorpha and Platyrrhini splits be synchronous. The simulation was conducted in the EVOLVER program of the PAML 4.4 package.31 Sequences were evolved on a tree that presented the same number of terminals and topological relationships as P2006. Branch lengths, the product of evolutionary rate and time, were calculated as follows. Absolute evolutionary rates, measured in average substitutions/site/year for each branch were estimated from the empirical data in MULTIDIVTIME (Fig. 4). The absolute time duration of each branch was also estimated from the original P2006 data set. However, to simulate synchrony, we enforced the condition that the Caviomorpha and Platyrrhini splits occurred at 40 Ma (Fig. 4). These new time durations of the branches were then multiplied by the respective absolute evolutionary rates of each branch to obtain the lengths in average substitutions/site.
Figure 4.
Trees with branch lengths representing absolute times (A) and evolutionary rates (B) used to simulate the synchronous data set. In (A), note that the Platyrrhini/Catarrhini and Caviomorpha/Phiomorpha divergence times were forced to be synchronous (red branches). In (B), note the difference in evolutionary rates in Primates and Rodentia.
This approach constrains the age of the splits but allows for evolutionary rate variation, which is certainly an issue when primate and rodent genes are compared (Fig. 4B). We have simulated 1,000 data sets under this strategy for the concatenated and partitioned data to verify whether our 26 initial approach to evaluate synchrony by using the posterior distribution of D is valid.
Results
The inferred ages of NWP and NWH separation were different on the partitioned and concatenated data sets of P2006 (Table 1). Therefore, all analyses will be reported for each partitioning scheme independently. The 95% HPD of the posterior distribution of D ranged from −0.1 to 23.8 Ma, with mean = 11.6 Ma (partitioned) and from −9.1 to 10.8 Ma, with mean = 1.2 Ma (concatenated). Thus, data partitioning affected the statistical evaluation of the synchrony because the partitioned data set nearly excluded D = 0 in the 95% HPD, and for the concatenated data, the null value of D was close to the mean of the posterior distribution.
Table 1.
Divergence times and 95% HPD interval of Platyrhini and Hystricognathi rodents using empirical data.
| Concatenated | Partitioned | |
|---|---|---|
| Platyrrhini/Catarrhini | 39.3 (32.6–46.2) | 37.1 (29.8–44.3) |
| C aviomorpha/Phiomorpha | 40.5 (32.1–49.4) | 48.7 (38.6–59.1) |
| Difference (D) | 1.2 (−9.1–10.8) | 11.6 (0.1–23.8) |
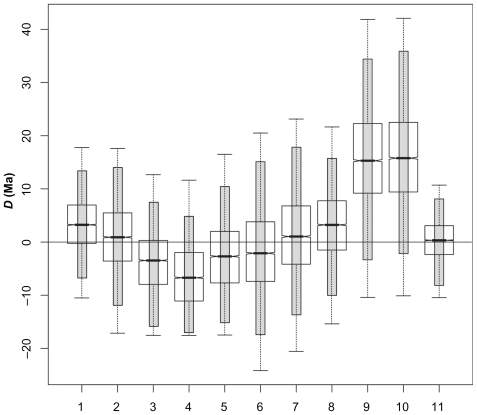
When the same reasoning was applied to paralogous Hox genes, D = 0 was present in all posterior distribution of differences investigated (Table 2). For instance, the mean of the posterior distribution of the difference between the ages of the Platyrrhini/ Catarrhini divergence estimated for Hox Al and Bl was 3.5 Ma (95% HPD interval from −6.8 to 13.4 Ma). The comparison that yielded a difference that was closest to approaching zero was that between the age of the Gorilla /(Homo, Pan) split as estimated by Hox B4 and Hox D4, with mean = 0.3 Ma (−8.0–0.9 Ma). Curiously, the same node, Gorilla/(Homo, Pan), dated the greatest value of D (mean = 16.3 Ma, 95% HPD interval from −1.9 to 36.1 Ma). Independent of the comparison, D = 0 within the 95% HPD intervals of all differences compared (Fig. 5).
Table 2.
Mean of the posterior distribution of the difference D between pairs of paralogous Hox genes.
| Pair number* | Mean D (95% HPD) |
|---|---|
| 1 | 3.5 (−6.8–3.4) |
| 2 | 0.9 (−11.7–14.0) |
| 3 | −3.6 (−15.7–7.4) |
| 4 | −6.2 (−17.0–4.9) |
| 5 | −2.6 (−15.1–10.3) |
| 6 | −1.4 (−17.3–15.0) |
| 7 | 1.6 (−13.6–17.9) |
| 8 | 3.0 (−10.0–15.5) |
| 9 | 16.0 (−3.2–34.3) |
| 10 | 16.3 (−1.9–36.0) |
| 11 | 0.3 (−8.0–7.9) |
Note: As shown in Fig. 3
Figure 5.
Boxplots of the posterior distributions of the difference between the eleven Hox gene pairs shown in Figure 3. The 95% HPD interval is depicted as the grey bar in each boxplot.
Note: D = 0 is present in all HPD intervals.
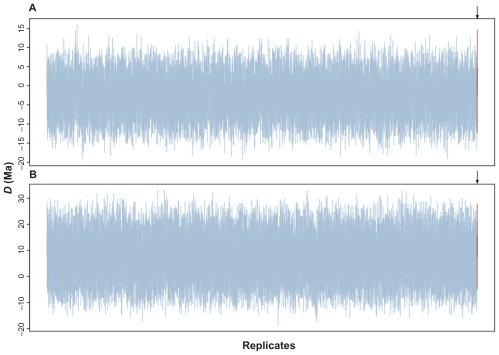
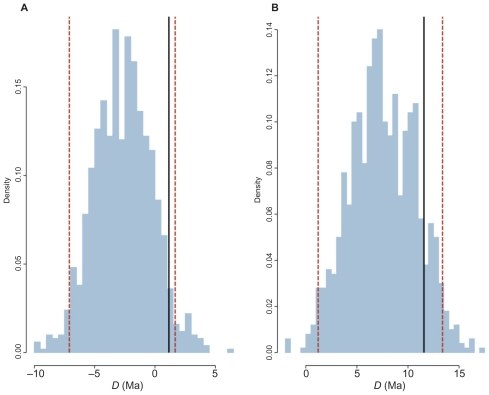
The data set simulated enforcing synchrony with allowed rate variation and yielded interesting results. For the concatenated data set, the posterior distributions of the 1,000 replicates were positioned around D = 0. However, when the same genes were partitioned, the posterior 21 distributions of the 1,000 replicates shifted to values greater than zero (Fig. 6). When compared to the posterior distribution of the empirical P2006 data, the difference between the simulated and real data sets was not significant in both concatenated and partitioned schemes. To demonstrate this, we calculated the 95% HPD interval of the set of the 1,000 means of the posterior distributions 25 obtained from the simulated data. For instance, in the concatenated analysis, the 95% HPD interval of means ranged from −7.1 to 1.7 Ma. The mean of the posterior distribution of the difference D inferred for the real P2006 concatenated data (1.2 Ma) lies within this interval. Partitioning the genes in codon positions resulted in a 95% HPD interval from 1.2 to 13.4 Ma, which certainly 3 includes 11.6 Ma, the mean of the posterior distribution of D estimated in P2006 (Fig. 7).
Figure 6.
Boxplots of the posterior distributions of the difference between the Platyrrhini/Catarrhini and Caviomorpha/Phiomorpha divergence times when synchrony was enforced. The empirical P2006 posterior distribution is depicted in the last red boxplot, identified by arrows, (A) concatenated data set; (B) partitioned data set.
Figure 7.
Hlistograms is of the means of the posterior distributions of simulated data. The minimium and maximum values of the 95% HPD intervals are marked by the red dashed lines.
Note: The empirical value is present within all HPD intervals (solid black line).
Discussion
Based on the methodological approach we proposed here to investigate synchronous events, we could not reject the hypothesis that NWP and NWH divergence from their sister clades occurred at the same age. In the analysis of the concatenated data set, the posterior distribution clearly contained zero (Fig. 1) because the 95% HPD ranged from −9.1 to 10.8 Ma. In the partitioned data set, however, the credibility interval nearly eliminated D = 0 (from −0.1 to 23.8 Ma). Such proximity prompted us to rerun the analysis 100 times under distinct initial conditions to verify the sensitivity of the lower bound limit. The lower limit of the HPD interval contained zero in all the results. Nevertheless, we were further impelled to study this problem via a simulation in which divergence times were constrained to be synchronous while evolutionary rates were allowed to vary among lineages. We observed that the simulated posterior distributions of D were indistinguishable from the empirical data (Fig. 6). This reiterates the importance of performing simulation when the distribution of the statistic under a given hypothesis is unknown.32
The younger age inferred for the Caviomorpha split (40.5 Ma), using the concatenated data set, was not recovered by Poux and collaborators (2006), who dated the Platyrrhini/Catarrhini split at 37.0 Ma and Caviomorpha/Phiomorpha at 45.4 Ma. However, the estimates obtained using the partitioned data set closely matches the divergence times inferred in the combined analyses of the three coding genes (37.1 vs 37.0 Ma for NWP and 48.7 vs 45.4 Ma for NWH) conducted by Poux et al (2006). Although we have tried to replicate as accurate as possible the parametric settings of P2006, differences among posterior distributions naturally happen depending on the choice of priors. This is particularly evident when the data do not contain statistical information via the likelihood function,33 although here, this seems to not be the case because the prior and posterior distributions are significantly different (Fig. 2). It is important to notice that the prior distributions of both concatenated and partitioned data sets were identical (Fig. 2).
The analysis of the mammalian Hox genes corroborated that a test of synchronous splits using the distribution obtained by differences between a pair of ages in each MCMC sample is possible. For the sake of obtaining negative evidence, we have also calculated the posterior distribution of the differences between non-synchronous splits. None of them contained D = 0 in the 95% HPD. For instance, the 95% HPD interval of the difference between the Gorilla(Homo, Pan) B4 and the Pongo(Gorilla(Homo, Pan)) D4 splits ranged from −4.3 and −2.5 Ma. This was the difference interval that closest approached D = 0.
The failure to reject the hypothesis of synchronous diversification implies that NWP and NWH could have separated from their African sister groups at approximately the same time. Such evidence suggests that the probability is high that the biogeographic scenario in which the splits took place was the same. After discarding North America and Antarctica as possible source areas for the ancestors of Platyrrhini and Caviomorpha,11,15,34,35 there are mainly three conceivable scenarios in which anthropoids and hystricognaths could have reached the isolated South American continent from Africa, namely, (i) by floating island rafting; (ii) land bridge connection and (iii) volcanic island-hopping.36
Independent of the scenario invoked, it is known that palaeo-currents and palaeo-winds favoured an Africa-to-South-America journey from 20 to 60 Ma22). A land bridge connection, serving as a permanent intercontinental pathway, is unlikely to have existed during the Eocene and Oligocene epochs.37,38 Thus, chance transoceanic dispersal events are favoured, which also corroborate synchronous divergences. If a connection between Africa and South America existed that was easily accessed, we would expect South American animals to be found in Africa during the same period. For instance, the rise of the Panama Isthmus in the Pliocene resulted in the great biotic interchange between North and South America.39 However, there are no records of terrestrial animals originally endemic to South America that suddenly appeared in the E/O deposits in Africa.
Evidently, when we characterise synchronous arrival, it does not mean that the cladogenetic splits of primates and rodents were exactly synchronous. It means that the separation of Platyrrhini/ Catarrhini and Caviomorpha/Phiomorpha took place at times that are impossible to discriminate statistically based on the data analysed. If the variance of the estimates were null, the variance of the posterior distribution of D would also be null. In this case, one should interpret D in light of the geoclimatic scenario of the Eocene and Oligocene epochs and evaluate if the arrival of these lineages to South America occurred by the same route.
In conclusion, chronological estimates provide key information to understand historical biogeography.4 The relevance of timescales is not restricted to the comprehension of the geological and climate scenario in which speciation events occurred, as it can be extended to explicitly test hypotheses in historical biogeography.9,10,40 Here, we have demonstrated that the hypothesis of a synchronous arrival for NWP and NWH cannot be rejected based on a particular data set. We applied this statistical approach to an empirical Hox gene data set with good performance. Obviously, the issue of platyrrhine and caviomorph evolution remains open to additional examination as more genes become available. Increased gene sampling, as well as calibration information provided by the fossil record, reduces stochastic errors from divergence time inference. As a result, more precise and, hopefully, more accurate chronological estimates will be obtained, augmenting the power of the test for synchronous divergences.
Acknowledgements
This work was funded by the Brazilian Research Council (CNPq) Grant 308147/2009-0 and FAPERJ Grants E-26/103.136/2008, 110.838/2010, 110.028/2011 and 111.831/2011.
Abbreviation
- Ma
Mega annum
Footnotes
Disclosures
Author(s) have provided signed confirmations to the publisher of their compliance with all applicable legal and ethical obligations in respect to declaration of conflicts of interest, funding, authorship and contributorship, and compliance with ethical requirements in respect to treatment of human and animal test subjects. If this article contains identifiable human subject(s) author(s) were required to supply signed patient consent prior to publication. Author(s) have confirmed that the published article is unique and not under consideration nor published by any other publication and that they have consent to reproduce any copyrighted material. The peer reviewers declared no conflicts of interest.
Supplementary Table
Table S1.
Accession numbers of sequences used.
References
- 1.Platnick NI, Nelson G. Method of analysis for historical biogeography. Systematic Zoology. 1978;27:1–16. [Google Scholar]
- 2.Rosen DE. Vicariant patterns and historical explanation in biogeography. Systematic Zoology. 1978;27:159–88. [Google Scholar]
- 3.Nelson G, Platnick NI. Systematics and Biogeography: Cladistics and Vicariance. Columbia University Press; New York: 1981. [Google Scholar]
- 4.Donoghue MJ, Moore BR. Toward an integrative historical biogeography. Integrative and Comparative Biology. 2003;43:261–70. doi: 10.1093/icb/43.2.261. [DOI] [PubMed] [Google Scholar]
- 5.Sanderson MJ. A nonparametric approach to estimating divergence times in the absence of rate constancy. Molecular Biology and Evolution. 1997;14:1218–31. [Google Scholar]
- 6.Thorne JL, Kishino H, Painter IS. Estimating the rate of evolution of the rate of molecular evolution. Molecular Biology and Evolution. 1998;15:1647–57. doi: 10.1093/oxfordjournals.molbev.a025892. [DOI] [PubMed] [Google Scholar]
- 7.Schrago CG, Russo CAM. Timing the origin of New World monkeys. Molecular Biology and Evolution. 2003;20:1620–5. doi: 10.1093/molbev/msg172. [DOI] [PubMed] [Google Scholar]
- 8.Poux C, Madsen O, Marquard E, Vieites DR, de Jong WW, Vences M. Asynchronous Colonization of Madagascar by the Four Endemic Clades of Primates, Tenrecs, Carnivores, and Rodents as Inferred from Nuclear Genes. Systematic Biology. 2005;54:719–30. doi: 10.1080/10635150500234534. [DOI] [PubMed] [Google Scholar]
- 9.Crisp MD, Cook LG. A congruent molecular signature of vicariance across multiple plant lineages. Molecular Phylogenetics and Evolution. 2007;43:1106–17. doi: 10.1016/j.ympev.2007.02.030. [DOI] [PubMed] [Google Scholar]
- 10.Crisp MD, Trewick SA, Cook LG. Hypothesis testing in biogeography. Trends in Ecology & Evolution. 2011;26:66–72. doi: 10.1016/j.tree.2010.11.005. [DOI] [PubMed] [Google Scholar]
- 11.Lavocat R. The implications of rodent paleontology and biogeography to the geographical sources and origin of platyrrhine primates. In: Ciochon RL, Chiarelli BA, editors. Evolutionary Biology of New World Monkeys and Continental Drift. Plenum Press; New York: 1980. pp. 93–103. [Google Scholar]
- 12.Poux C, Chevret P, Huchon D, de Jong WW, Douzery EJP. Arrival and diversification of caviomorph rodents and platyrrhine primates in South America. Systematic Biology. 2006;55:228–44. doi: 10.1080/10635150500481390. [DOI] [PubMed] [Google Scholar]
- 13.Takai M, Anaya F. New specimens of the oldest fossil platyrrhine, Branisella boliviana, from Salla, Bolivia. American Journal of Physical Anthropology. 1996;99:301–17. doi: 10.1002/(SICI)1096-8644(199602)99:2<301::AID-AJPA7>3.0.CO;2-0. [DOI] [PubMed] [Google Scholar]
- 14.Flynn JJ, Wyss AR. Recent advances in South American mammalian paleontology. Trends in Ecology & Evolution. 1998;13:449–54. doi: 10.1016/s0169-5347(98)01457-8. [DOI] [PubMed] [Google Scholar]
- 15.Fleagle JG. Primate Adaptation and Evolution. 2 edn. Academic Press; 1998. [Google Scholar]
- 16.Lavocat R. Systematics of hystricomorphous rodents and continental drift. Comptes rendus hebdomadaires des seances de I’Academie des sciences. Serie D: Sciences naturelles. 1969;269:1496–7. [PubMed] [Google Scholar]
- 17.Sallam HM, Seiffert ER, Steiper ME, Simons EL. Fossil and molecular evidence constrain scenarios for the early evolutionary and biogeographic history of hystricognathous rodents. Proceedings of the National Academy of Sciences of the United States of America. 2009;106:16722–7. doi: 10.1073/pnas.0908702106. [DOI] [PMC free article] [PubMed] [Google Scholar]
- 18.Huchon D, Douzery EJ. From the Old World to the New World: a molecular chronicle of the phylogeny and biogeography of hystricognath rodents. Molecular Phylogenetics and Evolution. 2001;20:238–51. doi: 10.1006/mpev.2001.0961. [DOI] [PubMed] [Google Scholar]
- 19.Mouchaty SK, Catzeflis F, Janke A, Arnason U. Molecular evidence of an African phiomorpha-South American caviomorpha clade and support for hystricognathi based on the complete mitochondrial genome of the cane rat (Thryonomys swinderianus) Molecular Phylogenetics and Evolution. 2001;18:127–35. doi: 10.1006/mpev.2000.0870. [DOI] [PubMed] [Google Scholar]
- 20.Huchon D, Chevret P, Jordan U, et al. Multiple molecular evidences for a living mammalian fossil. Proceedings of the National Academy of Sciences of the United States of America. 2007;104:7495–9. doi: 10.1073/pnas.0701289104. [DOI] [PMC free article] [PubMed] [Google Scholar]
- 21.Perelman P, Johnson WE, Roos C, et al. A Molecular Phylogeny of Living Primates. Plos Genetics. 2011;7 doi: 10.1371/journal.pgen.1001342. [DOI] [PMC free article] [PubMed] [Google Scholar]
- 22.Houle A. The origin of platyrrhines: An evaluation of the Antarctic scenario and the floating island model. American Journal of Physical Anthropology. 1999;109:541–59. doi: 10.1002/(SICI)1096-8644(199908)109:4<541::AID-AJPA9>3.0.CO;2-N. [DOI] [PubMed] [Google Scholar]
- 23.Ivany LC, Patterson WP, Lohmann KC. Cooler winters as a possible cause of mass extinctions at the eocene/oligocene boundary. Nature. 2000;407:887–90. doi: 10.1038/35038044. [DOI] [PubMed] [Google Scholar]
- 24.Schrago CG. On the time scale of new world primate diversification. American Journal of Physical Anthropology. 2007;132:344–54. doi: 10.1002/ajpa.20459. [DOI] [PubMed] [Google Scholar]
- 25.Kumar S, Hedges SB. A molecular timescale for vertebrate evolution. Nature. 1998;392:917–20. doi: 10.1038/31927. [DOI] [PubMed] [Google Scholar]
- 26.Arnason U, Gullberg A, Burguete AS, Janke A. Molecular estimates of primate divergences and new hypotheses for primate dispersal and the origin of modern humans. Hereditas. 2000;133:217–28. doi: 10.1111/j.1601-5223.2000.00217.x. [DOI] [PubMed] [Google Scholar]
- 27.Glazko GV, Nei M. Estimation of divergence times for major lineages of primate species. Molecular Biology and Evolution. 2003;20:424–34. doi: 10.1093/molbev/msg050. [DOI] [PubMed] [Google Scholar]
- 28.Ranwez V, Delsuc F, Ranwez S, Belkhir K, Tilak MK, Douzery EJ. OrthoMaM: a database of orthologous genomic markers for placental mammal phylogenetics. Bmc Evolutionary Biology. 2007;7:241. doi: 10.1186/1471-2148-7-241. [DOI] [PMC free article] [PubMed] [Google Scholar]
- 29.Loytynoja A, Goldman N. webPRANK: a phylogeny-aware multiple sequence aligner with interactive alignment browser. Bmc Bioinformatics. 2010;11:579. doi: 10.1186/1471-2105-11-579. [DOI] [PMC free article] [PubMed] [Google Scholar]
- 30.Guindon S, Gascuel O. A simple, fast, and accurate algorithm to estimate large phylogenies by maximum likelihood. Systematic Biology. 2003;52:696–704. doi: 10.1080/10635150390235520. [DOI] [PubMed] [Google Scholar]
- 31.Yang ZH. PAML 4: Phylogenetic analysis by maximum likelihood. Molecular Biology and Evolution. 2007;24:1586–1591. doi: 10.1093/molbev/msm088. [DOI] [PubMed] [Google Scholar]
- 32.Goldman N. Statistical tests of models of DNA substitution. Journal of Molecular Evolution. 1993;36:182–98. doi: 10.1007/BF00166252. [DOI] [PubMed] [Google Scholar]
- 33.Yang ZH. Computational molecular evolution. Oxford University Press; 2006. [Google Scholar]
- 34.Kay RF, Ross C, Williams BA. Anthropoid origins. Science. 1997;275:797–804. doi: 10.1126/science.275.5301.797. [DOI] [PubMed] [Google Scholar]
- 35.Takai M, Anaya F, Shigehara N, Setoguchi T. New fossil materials of the earliest new world monkey, Branisella boliviana, and the problem of platyrrhine origins. American Journal of Physical Anthropology. 2000;111:263–81. doi: 10.1002/(SICI)1096-8644(200002)111:2<263::AID-AJPA10>3.0.CO;2-6. [DOI] [PubMed] [Google Scholar]
- 36.de Oliveira FB, Molina EC, Marroig G. Paleogeography of the South Atlantic: a Route for Primates and Rodents into the New World? In: Garber PA, Estrada A, Bicca-Marques JC, Heymann EW, editors. South American Primates, Developments in Primatology: Progress and Prospects. Springer; 2008. [Google Scholar]
- 37.Sclater JG, Hellinger S, Tapscott C. Paleobathymetry of Atlantic Ocean from Jurassic to Present. Journal of Geology. 1977;85:509–52. [Google Scholar]
- 38.Eagles G. New angles on South Atlantic opening. Geophysical Journal International. 2007;168:353–61. [Google Scholar]
- 39.Woodburne MO. The Great American Biotic Interchange: Dispersals, Tectonics, Climate, Sea Level and Holding Pens. Journal of Mammalian Evolution. 2010;17:245–64. doi: 10.1007/s10914-010-9144-8. [DOI] [PMC free article] [PubMed] [Google Scholar]
- 40.Cook LG, Crisp MD. Not so ancient: the extant crown group of Nothofagus represents a post-Gondwanan radiation. Proceedings of the Royal Society B-Biological Sciences. 2005;272:2535–44. doi: 10.1098/rspb.2005.3219. [DOI] [PMC free article] [PubMed] [Google Scholar]
Associated Data
This section collects any data citations, data availability statements, or supplementary materials included in this article.
Supplementary Materials
Table S1.
Accession numbers of sequences used.


