

Abstract
Background. Plasmodium–helminth coinfection can have a number of consequences for infected hosts, yet our knowledge of the epidemiology of coinfection across multiple settings is limited. This study investigates the distribution and heterogeneity of coinfection with Plasmodium falciparum and 3 major helminth species across East Africa.
Methods. Cross-sectional parasite surveys were conducted among 28 050 children in 299 schools across a range of environmental settings in Kenya, Uganda, and Ethiopia. Data on individual, household, and environmental risk factors were collected and a spatially explicit Bayesian modeling framework was used to investigate heterogeneities of species infection and coinfection and their risk factors as well as school- and individual-level associations between species.
Results. Broad-scale geographical patterns of Plasmodium–helminth coinfection are strongly influenced by the least common infection and by species-specific environmental factors. At the individual level, there is an enduring positive association between P. falciparum and hookworm but no association between P. falciparum and Schistosoma species. However, the relative importance of such within-individual associations is less than the role of spatial factors in influencing coinfection risks.
Conclusions. Patterns of coinfection seem to be influenced more by the distribution of the least common species and its environmental risk factors, rather than any enduring within-individual associations.
Most hosts, including humans, are often simultaneously infected with multiple parasite species [1]. The occurrence of such coinfections results from (1) similar environmental envelopes of coinfecting species that increase exposure-related risks of coinfection [2, 3] and/or (2) within-host interactions between coinfecting species that alter the susceptibility to either species [4]. Experimental and observational studies in animal populations have begun to disentangle these processes [5] and provide clear evidence of how parasites directly (through resource competition) or indirectly (via host immunity) [4, 6, 7] interact within hosts. By contrast, our understanding of the epidemiology of coinfection in human populations is limited. Some of the most common parasitic infections of humans are plasmodia and helminth species, and their widespread geographical overlap in the tropics means that coinfection is common [2, 8]. It has been suggested that the immune response evoked by helminth infections may modify immune responses to plasmodia and consequently alter infection and disease risks [9–11]. However, studies conducted to date have been typically cross-sectional and conducted in single populations, and they have produced conflicting results [12–15]. In such studies, little regard has been made of the environmental and socioeconomic context of coinfection and there is, therefore, limited scope for determining whether distributions of coinfection simply reflect the geographical cooccurrence of coinfecting species or whether interactions within hosts play a role.
In a previous population-based study in Uganda [16], we demonstrated that coinfection with plasmodia and hookworm reflected the age-dependency and small-scale spatial heterogeneity of coinfecting species, and that plasmodia–hookworm coinfection occurred more than would be expected by chance among preschool children and adults, but not school-aged children. Here, we extend this work and investigate coinfection with plasmodia and 3 helminth species (hookworm, Schistosoma mansoni, or Schistosoma haematobium) in schoolchildren across multiple transmission settings in Ethiopia, Kenya, and Uganda. Special emphasis is placed on the broad-scale geographical distributions of coinfection and on environmental and household risk factors. Specifically, we investigate the extent to which geographical co-occurrence and common risk factors influence distributions of coinfection. Multivariate Bayesian geostatistical logistic modeling is used to investigate school- and individual-level associations between species while accounting for spatial clustering of infection.
METHODS
Reporting of the study has been verified in accordance with the STROBE (Strengthening the Reporting of Observational Studies in Epidemiology) checklist.
School Surveys
A series of school surveys were conducted using a standard protocol in Oromia Regional State, Ethiopia [17], Kenya [18], and Uganda. The sampling designs and survey procedures are detailed elsewhere [17, 18]. In brief, schools were selected to provide a representative sample of malaria endemicity in each setting. Malaria transmission in Oromia is unstable, exhibiting marked temporal and spatial variation [19], and in Kenya it ranges from very low (central), to moderate (coast), to high (western) transmission [20]. Most of Uganda experiences high rates of malaria transmission [21]. Hookworm occurs throughout all settings, whereas transmission of S. mansoni only occurs in Oromia, Uganda, and western Kenya. Schistosoma haematobium is found throughout the Kenyan coast and small pockets of western Kenya [22]. The surveys were carried out between September 2008 and December 2009 to coincide with the peak malaria transmission season in each setting. Additional data for Uganda were available from a 2006 survey (May–July).
In each school in Ethiopia and Kenya, 10 children plus 1 reserve (in case of refusal or assay failure) of each sex were randomly selected from each of classes 2–6 based on the children present that day and using computer-generated random table numbers. This sample size of 100 children per school sought to estimate a prevalence of infection of 5%, with 1% precision, based on 95% confidence limits, 80% power, and a design effect of 2. In Uganda, 50 children were randomly selected for logistical reasons.
Selected children were asked to provide a fingerprick blood sample, which was used to assess Plasmodium infection in the peripheral blood based on expert microscopy (in Ethiopia and Uganda) and microscopy-corrected malaria rapid diagnostic test (RDT) results (in Kenya). Two independent microscopists read the slides, with a third microscopist resolving discrepant results. Children in all schools were asked to provide stool samples, and children in coastal Kenya were asked to provide urine samples. Stool samples were examined in duplicate within 1 hour using the Kato-Katz technique for the eggs of intestinal nematodes (Ascaris lumbricoides, Trichuris trichiura, and hookworm species [assumed to be predominantly Necator americanus [23]]) and S. mansoni, and the concentration of eggs were expressed as eggs per gram of feces. Ten milliliters of collected urine was filtered through a polycarbonate membrane with a pore size of 12 μm; the eggs were counted and the number was expressed as eggs per 10 mL of urine.
Household Data
A simple questionnaire was administered to pupils to obtain data on insecticide-treated net ownership and use, key socioeconomic variables, household construction, education of the child’s parent/guardian, and (in Kenya and Uganda) reported fever on the day of survey and in the previous 2 weeks. All field workers were trained in a standardized manner to administer the questionnaire, although no measure of interobserver variability was made. Reported information on ownership of household assets and household construction was used to construct country-specific wealth indices using principal component analysis [24], and resulting scores for each country were divided into terciles.
Ethics
The surveys received ethical approval from the ethics review committees of Kenya Medical Research Institute (1407 and 1596), the Ethiopian Science and Technology Agency (RDHE/2-89/2009), and the Uganda National Council of Science and Technology.
Consent for participation was based on passive, opt-out consent rather than written, opt-in consent because of the routine, low-risk nature of the survey [18]. Head teachers were briefed about the survey, provided with an information sheet, and asked for their written consent to have their school involved in the survey. The head teachers subsequently informed the students, parents, and the school committee members about the survey and obtained their oral approval for the study. Parents/guardians who did not want their children to participate in the study were free to refuse participation. On the survey day, children were informed about the survey procedures, making it clear that their participation was voluntary and that they might opt out at any time if they chose to. Children who were unwilling to participate or children whose parents did not attend the school meeting were excluded from the selection procedure, with assent obtained from selected children before samples were collected. Children’s names were removed in the final database to ensure anonymity. Children with a positive malaria RDT plus documented fever were treated for malaria according to national guidelines. All children received treatment with 400 mg of albendazole and those found to be infected with schistosomes with 40 mg/kg of praziquantel.
Satellite-Derived Environmental Data
A global positioning device was used to determine the location of each school. Monthly average precipitation data at 1 km resolution [25] for the period 1950–2000 and interpolated using a thin-plate smoothing spline algorithm [26] were used to define areas with 3 continuous months of precipitation >80 mm in an average year [20]. Land surface temperature and the Normalized Difference Vegetation Index (NDVI, a measure of vegetation greenness) for 1992–2006 were obtained from Advanced Very High Resolution Radiometer data at 5 km resolution and smoothed using temporal Fourier analysis, and the annual amplitude was determined [27, 28]. Elevation was obtained from an interpolated digital elevation model [29] and distance to permanent water bodies was derived from a water-body map [30]. Mapping was undertaken using the ArcGIS 9.3 system (Environmental Systems Research Institute).
Data Analysis
Analysis is restricted to P. falciparum infection, which was responsible for the vast majority of infections: 52.1% in Ethiopia, 96.7% in Kenya, and 100% in Uganda. Five infection status outcomes were investigated: presence (regardless of other species) of (1) P. falciparum infection; (2) hookworm infection; (3) S. mansoni or S. haematobium infection, as well as (4) concomitant infection with P. falciparum and hookworm (Pf-Hk coinfection); and (5) concomitant infection with P. falciparum and schistosomes (either S. mansoni in Ethiopia, Uganda, or western and central Kenya or S. haematobium in costal Kenya) (Pf-Sch coinfection). Infection with A. lumbricoides or T. trichiura was <2% prevalence and was therefore not analyzed.
We present 3 sets of analyses. First, regional patterns are described across all 3 countries. Data from Ethiopia indicated a very low prevalence of coinfection, so these data were not analyzed further. Second, data from Kenya and Uganda were analyzed to identify risk factors using a multivariable geostatistical approach [31] but was extended to model joint associations between species using a multivariate outcome Bayesian hierarchical model. This approach helps to improve the efficiency of parameter estimates for each infection, and crucially allows estimation and inference to be made about dependencies between infections. Third, a subset analysis was undertaken for coastal Kenya and around Lake Victoria where coinfection was most prevalent and thus provided the opportunity to investigate both school- and individual-level factors. This subset analysis included survey data from Kenya and from Uganda for 2009, data sets for which full information on individual-level risk factors was available. A similar geostatistical modeling approach was adopted as in the second stage of data analysis.
Descriptive results are adjusted for school-level clustering using random effects regression modeling [32]. Generally, proportions and 95% binomial confidence intervals were estimated using a zero-inflated Poisson (ZIP) model to account for the excess of schools with zero prevalence. No adjustment was made for very low (≤0.1%) prevalences. In cases where the ZIP model was unable to converge and for estimates of insecticide-treated net use and deworming, estimates were derived using generalized linear and latent mixed models, with a logit link and a random effects component using adaptive quadrature [32].
Univariate analysis was undertaken using logistic regression in order to select candidate variables for spatial multivariable analysis (criteria: Wald test P < .1). Standard errors were adjusted for dependence between individuals within schools using a clustered sandwich estimator. Backward-stepwise elimination was used to generate a minimum adequate model; excluded covariates (P > .05) were retested in the minimal model to confirm lack of association. These statistical analyses were carried out using Stata 11.1 software (StataCorp).
Retained covariates were subsequently included into spatial multivariable Bayesian mixed-effect logistic regression models using WinBUGS 14·1 (MRC Biostatistics Unit). For each outcome, a binomial regression model was fitted to the number of examined and infected individuals for each species at each school location. (See Appendix.) These models included environmental covariates, a school-level geostatistical random effect (using an isotropic, stationary exponential decay function [31]), and a nonspatial joint random effect. This approach incorporates a degree of spatial smoothing, adjustment for nonspatial clustering within schools and for dependency between infections at the school level. These models were extended to include individual-level factors in the subset analysis where individual infection status for each species was modeled including household and environmental covariates, a geostatistical random effect, and an individual-level joint random effect. The month and the year of surveys were originally included in the models but were found not to improve model fit and so were removed for reasons of model parsimony.
RESULTS
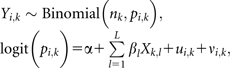
Overall, 28 050 children from 299 schools across Ethiopia, Kenya, and Uganda were examined. Median ages and proportion of children male were similar across countries (Table 1). The overall prevalence of single species infections and species coinfection by country and year are reported in Table 2. Prevalence of coinfection with P. falciparum and either hookworm (Pf-Hk) or schistosome (Pf-Sch) infection was most common in Uganda and least common in Ethiopia: only 3 Ethiopian children harbored Pf-Hk coinfection and none harbored Pf-Sch coinfection. Coinfection with P. falciparum and S. haematobium occurred at very low levels (1.0%). The majority (96%) of Plasmodium infections were asymptomatic. There was marked geographical heterogeneity in the distribution of coinfection (Figure 1), with the prevalence of Pf-Hk coinfection being highest around Lake Victoria in western Kenya and eastern Uganda; a pocket of high prevalence also occurs on the south Kenyan coast. Pf-Sch coinfection (due to S. mansoni) was most prevalent around Lake Victoria in Uganda.
Table 1.
Summary of Survey Data
| County | Year | No. of Schools/Children | % Male | Median No. Examined (Interquartile Range) | Median Age of Children, Years (Interquartile Range) |
| Kenya | 2008–09 | 177/17 871 | 51.0 | 104 (99–107) | 12 (10–13) |
| Ethiopia | 2008–09 | 68/6681 | 53.2 | 101 (94–106) | 11 (9–12) |
| Uganda | 2009 | 34/2225 | 50.4 | 52 (44–86) | 10 (8–13) |
| Uganda | 2006 | 20/1273 | 50.1 | 65 (64–66) | 10 (7–13) |
Table 2.
Prevalence of Single Plasmodia and Helminth Species and Species Coinfection and Reported Insecticide Net Use and Recent Deworming Among Schoolchildren in Ethiopia, Kenya and Ethiopia, 2006–2009
| Outcomea | Kenya (2008–09) | Ethiopia (2008–09) | Uganda (2006) | Uganda (2009) |
| P. falciparum | 6.4 (4.6–8.2) | 0.1 (.08–.2)b | 45.7 (41.9–49.9)c | 55.8 (50.8–61.3)c |
| Hookworm | 11.7 (9.4–14.0) | 17.3 (12.6–22.0) | 27.2 (22.5–32.9)c | 14.5 (10.9–19.3)c |
| S. mansoni | 0.9 (.01–1.7) | 2.8 (.4–5.3) | 7.3 (5.7–9.5) | 32.9 (29.1–36.7) |
| S. haematobiumd | 24.4 (18.0–30.8) | No transmission occurs or occurs in small isolated foci | ||
| Any schistosome infection | 9.3 (6.6–12.1) | 2.8 (.4–5.3) | 7.3 (5.7–9.5) | 32.9 (29.1–36.7) |
| Coinfection | ||||
| P. falciparum–hookworm | 0.9 (.5–1.3) | 3 cases | 9.3 (7.4–11.7) | 11.1 (8.4–13.7) |
| P. falciparum–S. haematobiumd | 1.0 (.05–1.5) | No transmission of S. haematobium occurs | ||
| P. falciparum–S. mansoni | 0.1 (.05–.2)b | Not present | 2.1 (1.2–3.6) | 17.5 (11.2–24.7) |
| P. falciparum–schistosome | 0.4 (.2–.7) | Not present | 2.1 (1.2–3.6) | 17.5 (11.2–24.7) |
| Reported ITN usec | 57.2 (54.0–60.3) | 53·8 (45.8–61.8) | 21.6 (18.1–25.7) | 31.3 (25.5–38.7) |
| Sleeping under ITN previous nightc | 52.8 (49.8–55.9) | 40·0 (38.6–41.7) | Not recorded | 28.7 (23.3–35.5) |
| Dewormed in last 6 moc | 55.3 (51.3–59.2) | 27.8 (25.1–29.5) | Not recorded | 70.5 (68.5–72.5) |
Abbreviation: ITN, insecticide-treated net.
Prevalence and 95% binomial confidence intervals adjusted for clustering using zero-inflated Poisson regression, unless stated otherwise.
No adjustment for clustering made because of very low prevalence.
Prevalence and 95% binomial confidence intervals adjusted for clustering using generalized mixed model.
Analysis for 6160 children in 63 schools along the coast of Kenya.
Figure 1.


Geographical distribution of Plasmodium or helminth monoinfection and coinfection among school children in 299 schools in Ethiopia, Kenya, and Uganda. A, Plasmodium falciparum and hookworm coinfection. B, P. falciparum and schistosome (either Schistosoma haematobium along the coast of Kenya or Schistosoma mansoni elsewhere) coinfection.
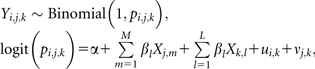
Figure 2 shows the relationship between observed prevalence of coinfection and the school-level prevalence of the least and most prevalent species in each coinfection pairing. The prevalence of both Pf-Hk and Pf-Sch coinfection is strongly related to the overall prevalence of the least common species in the coinfection pairing (Figure 2A and 2C). In contrast, the most common species was often prevalent in settings where coinfection was absent (Figure 2B and 2D). These observations suggest that the geographical distribution of coinfection reflects the geography of the least common species in the coinfection pairing.
Figure 2.

Relationship between the prevalence of Plasmodium–helminth coinfection and the least and most common species among schoolchildren in 299 schools in Ethiopia, Kenya, and Uganda, according to species: coinfection with Plasmodium falciparum and hookworm and (A) least common and (B) most common species; coinfection with P. falciparum and schistosome (either Schistosoma mansoni or Schistosoma haematobium) infection and (C) least common and (D) most common species, as defined on a school-by-school basis. Line of identity is indicated by dashed line. Overall correlation coefficients for each graph: (A) 0.937, (B) 0.685, (C) 0.967, and (D) 0.615; all P < .001.
In terms of environmental factors associated with infection and coinfection (Table 3), the environmental factors associated with Pf-Hk coinfection were generally the same as those associated with hookworm infection (NDVI and precipitation >80 mm/year), and those for Pf-Sch coinfection were the same as for schistosome infection (elevation, land surface temperature, and location within 12 km of a permanent water body). These findings suggest that the environmental factors associated with individual helminth species are also associated with large-scale spatial patterns of coinfection. The residual nonspatial, school-level correlation between species in each coinfection pairing can be estimated from model estimates of rho (ρ). A positive ρ value indicates that schools with higher than expected prevalence of one parasite species also tend to have higher than expected prevalence of the second species, after adjusting for environmental risk factors and spatial correlation. Estimates from Table 3 indicate that there is a strong positive correlation between P. falciparum and schistosome infection (ρ = 0.91) and a moderate correlation between P. falciparum and hookworm (ρ = 0.69), but only a weak positive correlation for hookworm–schistosome coinfection (ρ = 0.38) (Table 3). Importantly, however, comparison of the magnitude of the spatial and joint variance parameters suggests that for all 3 species, independent spatial factors have greater influence on infection prevalence than (nonspatial) joint factors responsible for correlation between parasites.
Table 3.
Large-Scale Environmental Factors Associated With the Prevalence of Hookworm, Plasmodium falciparum, and Schistosoma Infection, and P. falciparum Coinfections Among Schoolchildren in 234 Schools in Kenya and Uganda, 2006–2010
| (1) Hookwormd | (1) P. falciparumd | (1) Schistosomad | (2) Pf-Hk Coinfectione | (3) Pf-Sch Coinfectione | |
| Covariatesa,b,c | OR (95% BCI) | OR (95% BCI) | OR (95% BCI) | OR (95% BCI) | OR (95% BCI) |
| Elevation | 0.98 (0.86–1.14) | 0.85 (0.57–1.04) | 3.08 (2.11–4.36) | 1.12 (0.86–1.41) | 2.41 (1.71–3.66) |
| Elevation squared | 0.99 (0.99–1.00) | 0.99 (0.99–1.01) | 0.94 (0.92–0.96) | 0.99 (0.98–1.00) | 0.96 (0.94–0.98) |
| NDVI | 1.49 (1.15–1.77) | 0.67 (0.37–1.09) | 1.62 (1.12–2.32) | 0.85 (0.55–1.22) | |
| LST | 0.87 (0.69–1.09) | 0.84 (0.58–1.13) | 0.31 (0.18–0.46) | 0.74 (0.41–1.32) | 0.35 (0.21–0.54) |
| Within 12 km of PWB | 9.94 (1.86–34.09) | 5.44 (1.73–12.51) | |||
| Rainy area | 2.79 (1.41–4.81) | 1.83 (0.75–3.82) | 2.15 (0.66–4.96) | 7.55 (0.34–41.32) | |
| X (longitude) | 0.65 (0.56–0.71) | 0.50 (0.46–0.56) | 0.63 (0.56–0.71) | ||
| Y (latitude) | 0.64 (0.53–0.78) | 0.99 (0.57–.52) | |||
| Variance parameters | |||||
| Spatial σ2 (SD) | 3.37 (4.76) | 38.7 (28.4) | 12.9 (3.9) | 3.70 (0.98) | 3.54 (1.66) |
| MVN σ2 (SD) | 0.71 (0.17) | 0.27 (0.12) | 1.26 (0.58) | ||
| Range, kmf | 259 (157–318) | 269 (206–315) | 36 (17–89) | 88 (37–520) | 34 (5–276) |
| Correlation between species | |||||
| Rho–Pf-Hkg | 0.69 (0.19–1.00) | ||||
| Rho– Hk-Schg | 0.38 (0.01–1.00) | ||||
| Rho–Pf-Schg | 0.91 (0.77–1.00) |
Results are based on (1) geostatistical Bayesian multivariate logistic regression models for infection status, including dependence between infections at the school level for malaria, hookworm, and schistosome infection, and (2) geostatistical Bayesian logistic regression models for coinfection status. Deviance information criteria values indicated that including spatial correlation and (nonspatial) dependence between infections improved model fit. Models are adjusted for clustering within schools.
Abbreviations: BCI, 95% Bayesian credible interval; LST, land surface temperature; MVN, multivariate normal error; NDVI, Normalized Difference Vegetation Index; OR, odds ratio; Pf-Hk, Plasmodium falciparum–hookworm; Pf-Sch, P. falciparum–schistosome; PWB, permanent water body; SD, standard deviation.
Elevation: per 100 m; rainy area: >80 mm rainfall for ≥3 consecutive months; longitude and latitude are expressed in decimal degrees.
Noninformative priors were used for all coefficients (normal prior with mean 0 and precision 1 × 10⁶), the variance component of the joint random effect was assigned the weakly informative diffuse inverse Wishart prior p(Ω−1) ∼ Wishart (p, Q), where p the scalar and Q is a prior estimate of Ω (hyperpriors were assigned P = 3 and Q = I where I is an identity matrix), the precision of both the spatial and joint random effects were given noninformative γ distributions and the prior distribution of φ was uniform with upper and lower bounds set at 0.5 and 50.
All significant variables were identified through backward selection in the frequentist logistic regression were included in the Bayesian logistic models.
Regardless of infection with any other species.
Comparison between coinfection and single infection/uninfected, based on a spatial model.
Range refers to the distance at which correlation between prevalence between schools drops below 5%, and is estimated from the modeled rate of decline of spatial correlation (3 × 1/ρ).
Rho represents the residual correlation between infections at the school level, after accounting for spatial correlation and risk factors, estimated from the MVN σ2 variance covariance matrix.
Table 4 presents a multivariate analysis of individual- and school-level factors that are associated with species infection and coinfection in coastal Kenya and around Lake Victoria (see Figure 3). In coastal Kenya, the Pf-Hk coinfection was significantly associated with a number of individual-level factors: coinfection was higher among boys, decreased with increasing age, and was highest among children from most poor households. These factors mirrored those associated with the least common species infection in coastal Kenya, namely, P. falciparum. No environmental factors were associated with Pf-Hk coinfection in south coastal Kenya, presumably due to the lack of major environmental variation in the area. Around Lake Victoria, both Pf-Hk coinfection and hookworm were significantly lower among children who were recently dewormed. Pf-Hk coinfection was associated (negatively) with elevation, which was also associated with hookworm and P. falciparum. Pf-Sch coinfection was significantly associated with environmental factors that were also associated with S. mansoni. In these data subsets, there was evidence for residual associations between species within individuals, as indicated by significant values of ρ. In coastal Kenya there was evidence of very strong residual positive associations between P. falciparum and hookworm. Significant, but weaker, residual association between P. falciparum and hookworm was apparent around Lake Victoria. However, it should be noted that these residual individual-level factors were still considerably less important than spatial location, as evidenced by large differences in the standard deviations of spatial and multivariate random effects. No associations were observed between P. falciparum and either schistosome species in either setting.
Table 4.
Environmental and Individual-Level Factors Associated With the Prevalence of Hookworm, Plasmodium falciparum and Schistosoma mansoni Infections, and Plasmodium–Helminth Coinfections, Among School Children in 51 Schools on the South Coast of Kenya and 56 Schools in Eastern Uganda and Western Kenya, 2006–2010
| Hookwormc | Plasmodium falciparumc | Schistosoma mansonic | Pf–Hk Coinfectiond | Pf–Sm Coinfectiond | |
| Variablea,b | OR (95% BCI) | OR (95% BCI) | OR (95% BCI) | OR (95% BCI) | OR (95% BCI) |
| Lake Victoria | |||||
| Age (y) | 1.10 (1.07–1.15) | 0.93 (0.90–0.96) | 1.12 (1.07–1.17) | ||
| Recently dewormed | 0.63 (0.46–0.82) | 0.76 (0.53–1.07) | |||
| Used net last night | |||||
| NDVI | 1.46 (0.99–2.19) | 0.45 (0.35–0.57) | 3.31 (1.29–7.50) | 3.22 (1.28–7.23) | |
| NDVI2 | 0.79 (0.68–0.90) | 0.81 (0.71–0.93) | |||
| Elevation | 0.73 (0.59–0.84) | 1.24 (0.92–1.56) | 0.55 (0.43–0.69) | ||
| LST | 0.39 (0.18–0.98) | ||||
| Within 12 km of PWB | 6.55 (0.77–18.95) | ||||
| Variance parameters | |||||
| Spatial σ2 (SD) | 2.04 (1.13–3.85) | 2.07 (1.09–4.21) | 18.9 (3.77–95.66) | 1.01 (0.05) | 3.08 (7.78) |
| MVN σ2 (SD) | 1.34 (1.05–1.72) | 0.12 (0.04–0.22) | 0.61 (0.49–0.82) | ||
| Range, km | 17 (7–67) | 34 (12–121) | 214 (74–2000) | 15 (7–81) | 11 (4–267) |
| Correlation between species | |||||
| Rho–Pf-Hke | 0.30 (0.14–0.51) | ||||
| Rho–Hk-Sme | 0.96 (0.91–0.99) | ||||
| Rho–Pf-Sme | 0.02 (-0.24–0.35) | ||||
| Coastal Kenya | |||||
| Sex (male) | 1.64 (1.39–1.93) | 1.57 (1.19–2.05) | 1·92 (1.27–2.92) | ||
| Age (y) | 0.75 (0.70–0.80) | 0·75 (0.68–0.82) | |||
| SES (vs poorest)f | |||||
| Middle tercile | 0.86 (0.71–1.02) | 0.82 (0.60–1.11) | 0·86 (0.54–1.26) | ||
| Least poor | 0.56 (0.44–0.69) | 0.56 (0.35–0.84) | 0·47 (0.24–0.83) | ||
| Recently dewormed | 0.78 (0.65–0.94) | 0·70 (0.46–1.05) | |||
| Used net last night | 0.65 (0.48–0.86) | 0·86 (0.54–1.26) | |||
| NDVI | 3.27 (2.24–3.12) | ||||
| Elevation | 0·86 (0.28–2.06) | ||||
| Variance parameters | |||||
| Spatial σ2 (SD) | 1.28 (0.38) | 2.22 (1.66) | 6·53 (1.78–21.10) | ||
| MVN σ2 (SD) | 0.84 (0.06) | 0.09 (0.007) | |||
| Range in kmg | 8 (4, 44) | 15 (4105) | 17 (4–249) | ||
| Correlation between species | |||||
| Rho–Pf-Hke | 0.998 (0.998–0.999) |
Results are based on spatial Bayesian multivariate logistic regression models for infection status, including dependence between infections at the school level. The low prevalence of Plasmodium falcipatrum–Schistosoma coinfection in coastal Kenya precluded its analysis.
Abbreviations: BCI, 95% Bayesian credible interval; Hk-Sm, hookworm–Schistosoma mansoni; LST, land surface temperature; MVN, multivariate normal error; NDVI, Normalized Difference Vegetation Index; OR, odds ratio; Pf-Hk, Plasmodium falciparum–hookworm; Pf-Sm, P. falciparum–S. mansoni; PWB, permanent water body; SD, standard deviation; SES, socioeconomic status.
Recently dewormed: reports receiving deworming medication in the previous 6 mo; net last night: reports sleeping under a bed net the previous night; SES is based on terciles of SES asset index; elevation: per 100 m.
All significant variables identified through backward selection in the frequentist logistic regression were included in the Bayesian logistic models.
Regardless of infection with any other species.
Comparison between coinfection and single infection/uninfected, based on a spatial model.
Rho represents the residual correlation between infections within individuals, after accounting for spatial correlation and risk factors, estimated from the MVN σ2 variance covariance matrix.
For Kenya, variables entered into the principal component analysis included household ownership of mobile phones, electricity supply to the household, primary source of drinking water, and construction materials of the household walls, roof, and floor. Similar variables except primary source of drinking water were included for Uganda.
Range refers to the distance at which correlation between prevalence between schools drops below 5%, and is estimated from the modeled rate of decline of spatial correlation (3 × 1/ρ).
Figure 3.

Geographical distribution of Plasmodium–helminth monoinfection and coinfection among school children in the subset analysis: 4220 children in 56 schools in western Kenya and eastern Uganda (A and B) and 5232 children in 51 schools in south coastal Kenya (C).
DISCUSSION
The present study is the first of its kind to investigate the epidemiology of coinfection of P. falciparum and different helminth species at a regional scale, with previous studies conducted at local scales [16, 33–36]. In particular, we sought to relate the distribution of coinfection with the underlying epidemiology and risk factors of the individual component species that make up coinfection. Our findings relate mainly to asymptomatic Plasmodium infection as the majority of infected children were without clinical symptoms. The results indicate that at a regional level, Plasmodium–helminth coinfection is not widespread among schoolchildren in East Africa and observed patterns predominantly reflect the distributions of the least prevalent component species. In regression analysis, environmental factors specific to the least common species were important predictors of large-scale patterns of coinfection. These findings are epidemiologically intuitive but are shown here for the first time; it is plausible that similar results can be shown in other areas and for other tropical and vector-borne diseases that are strongly influenced by environmental factors on a broad scale. At smaller spatial scales, the picture of coinfection is more complicated, but there does appear to be differences in the within-individual associations between species according to helminth species, with evidence of a positive association between P. falciparum and hookworm, but no evidence of an association between P. falciparum and schistosome species. However, the relative importance of such within-individual associations is considerably less than the role of spatial factors in influencing the occurrence of coinfection.
A notable feature of the analysis of broad-scale distributions is the remarkable consistency of findings for Plasmodium coinfection involving hookworm and schistosome infections. Such consistency suggests that where environmental and socioeconomic conditions are suitable for both component species, coinfection can be expected, and hence that the different patterns of coinfection observed in different geographical localities may be a function simply of environmental differences. This observation has important consequences for the spatial mapping of coinfection. Recent efforts have sought to develop global databases of malaria [37] and helminth infection [38], which can be used to generate contemporary and high-resolution maps of single-species infection prevalence using space–time geostatistical models within a Bayesian framework [20, 22, 37, 39] and can be used to predict the distribution of Plasmodium–helminth coinfection [3, 40, 41].
In this study, we also investigated associations between Plasmodium and helminth species, while adjusting for environmental and socioeconomic factors as well as spatial correlation. Positive correlations between Plasmodium and all helminth species were observed at the school level (Table 3) and between Plasmodium and hookworm at the individual level (Table 4), but importantly independent spatial factors were shown to be more important in explaining variation in risks of infection than correlations between species. Previous studies have indicated positive associations between Plasmodium infection and (1) hookworm and among pregnant women [33, 42] and (2) hookworm and S. mansoni among schoolchildren [35]. None of these studies explicitly accounted for environmental factors and spatial correlation and it is conceivable that the findings are subject to confounding by these factors. However, in a total population study in eastern Uganda using methods similar to the current ones, we provided evidence for associations between Plasmodium and hookworm among preschool children and adults, but, in contrast to the current findings, not among school-aged children [16]. The available evidence is therefore contradictory, but at broad spatial scales, environmental exposure-related factors seem to be more important that within individual associations in explanatory infection risks. Such a finding does not, however, downplay the significance of observed associations for the individuals themselves, and this aspect deserves more careful investigation by means of longitudinal studies.
Cross-sectional studies are inevitably subject to a number of limitations, including the potential of ecological fallacy. Our spatially explicit hierarchical approach, incorporating school- and individual-level factors, seeks to maximize the usefulness of the cross-sectional data. There remain, inevitably, some study limitations. First, our estimates of Plasmodium and helminth infection relied on standard parasitological diagnosis. The ability of these techniques to detect infection, especially light infection, is undoubtedly subject to error due to the insensitivity of light microscopy to detect malaria infection [43], day-to-day and intraspecimen variation in fecal egg counts [44], and human error. These limitations may have led to the misclassification of low-density/low-intensity infections as negative. Despite the limited sensitivity of our methods, the observed consistency of findings across settings and for different helminth species suggests that diagnostic error is unlikely to explain observed results, especially as all species are likely to be underestimated. Molecular malariologic techniques [45] and more intensive corpological sampling [44] may have increased diagnostic specificity, but such approaches add considerable cost and complexity to large-scale field studies. Second, the current results represent a snapshot of the period 2006–2009 and it is conceivable that seasonality and intervention-related factors may have confounded results. However, the inclusion of month and year into the multivariate models did not improve model fits, suggesting that temporal factors were relatively unimportant over the 3 years covered by the data. Furthermore, models were adjusted for mosquito-net use and recent deworming.
This study is unusual in its geographical scale and that it investigates the epidemiology of Plasmodium-helminth coinfection involving 3 major helminth species. At broad scales, the distribution of coinfection seems to be principally driven by the distribution of the least common species of the coinfection pairing and its environmental risk factors. Although there is evidence of enduring association between Plasmodium and hookworm within individuals, this effect is less important than the role of spatial factors in explaining the risk of coinfection. Further longitudinal studies are now required to better understand the clinical consequences for individuals harboring coinfections.
Notes
Acknowledgments.
We are grateful to all the teachers, children, and parents who participated in this survey and to all the members of the survey teams for their tireless effort and excellent work. We acknowledge the support provided by the ministries of education and health at national and district levels, are grateful for the expert advice provided by Berhanu Erko, Jimmy Kihara, Charles Mwandawiro and Richard Reithinger and we thank the anonymous reviewers whose comments greatly improved the work.
Financial support.
S. J. B. is supported by a Research Career Development Fellowship (#081673) from the Wellcome Trust, which funded the survey work in Kenya and Uganda;
R. L. P. is supported by the Partnership for Child Development; C. G. is supported by a Commonwealth Scholarship from the Department for International Development; R. A. receives support from the John Henry Memorial Fund; and R. W. S. is a Wellcome Trust Principal Fellow (079080). The work in Ethiopia was funded by the US Agency for International Development (Cooperative Agreement 663-A-00-09-00404-00). The funders had no role in study design, data collection and analysis, decision to publish, or preparation of the manuscript. S.J.B, C.W.G, R.W.S. acknowledge support from the Wellcome Trust Major Overseas Programme core grant (092654).
Potential conflicts of interest.
R. W. S. has received a fee for chairing meetings in Africa organized by Novartis Pharma AG. All other authors report no potential conflicts.
All authors have submitted the ICMJE Form for Disclosure of Potential Conflicts of Interest. Conflicts that the editors consider relevant to the content of the manuscript have been disclosed.
Appendix
Bayesian spatially explicit logistic regression models included environmental covariates, a school-level geostatistical random effect (using an isotropic, stationary exponential decay function [31]), and a nonspatial joint random effect. Models had the following form:
 |
where nk is the number of children examined and Yi,k is the number of children infected with each species i (i = 1, 2) at each school location k (k = 1, …., K). The component α is the intercept, the matrix of environmental covariates, ui,k a geostatistical random effect modeled using an isotropic, stationary exponential decay function [31]: (f(dab; φi) = exp[−(φidab)] where dab is the straight-line distance between pairs of schools a and b, and φi is the species-specific rate of decline of spatial correlation); and νi,k a nonspatial joint random effect modeled using an unstructured multivariate normal prior with covariance matrix Ω−1. The diagonal element of this covariance matrix is equal to the variance, whereas the off-diagonals are the covariance components; school-level correlation between species infections a and b is calculated as
These models were extended to include individual-level factors in the subset analysis to take the form:
 |
where Yi,j,k is the observed infection status for each species i (i = 1, 2), for individual j (j − 1, …., J) at each school location k (k = 1, …., K); α is the intercept, the matrix of individual covariates, the matrix of environmental covariates, ui,k the geostatistical random effect, and νi,k the individual-level nonspatial joint random effect. Model fitting used Markov chain Monte Carlo simulation techniques, with 9000 iterations for burn-in and 20 000 iterations for full convergence, thinning every 20 iterations. Subset analysis models including both school-level and individual-level joint random effects were also explored, but model comparison using the deviance information criteria and inspection of time-series plots for each parameter suggested that the additional school-level effect did not improve the fit or convergence of the model.
References
- 1.Petney TN, Andrews RH. Muliparasite communities in animals and humans: frequency, structure and pathogenic significance. Int J Parasitol. 1998;28:377–93. doi: 10.1016/s0020-7519(97)00189-6. [DOI] [PubMed] [Google Scholar]
- 2.Brooker S, Akhwale W, Pullan R, et al. Epidemiology of plasmodium-helminth co-infection in Africa: populations at risk, potential impact on anemia, and prospects for combining control. Am J Trop Med Hyg. 2007;77:88–98. [PMC free article] [PubMed] [Google Scholar]
- 3.Brooker S, Clements AC. Spatial heterogeneity of parasite co-infection: determinants and geostatistical prediction at regional scales. Int J Parasitol. 2009;39:591–7. doi: 10.1016/j.ijpara.2008.10.014. [DOI] [PMC free article] [PubMed] [Google Scholar]
- 4.Telfer S, Lambin X, Birtles R, et al. Species interactions in a parasite community drive infection risk in a wildlife population. Science. 2010;330:243–6. doi: 10.1126/science.1190333. [DOI] [PMC free article] [PubMed] [Google Scholar]
- 5.Pedersen AB, Fenton A. Emphasizing the ecology in parasite community ecology. Trends Ecol Evol. 2007;22:133–9. doi: 10.1016/j.tree.2006.11.005. [DOI] [PubMed] [Google Scholar]
- 6.Graham AL. Ecological rules governing helminth-microparasite coinfection. Proc Natl Acad Sci U S A. 2008;105:566–70. doi: 10.1073/pnas.0707221105. [DOI] [PMC free article] [PubMed] [Google Scholar]
- 7.Lello J, Boag B, Fenton A, Stevenson IR, Hudson PJ. Competition and mutualism among the gut helminths of a mammalian host. Nature. 2004;428:840–4. doi: 10.1038/nature02490. [DOI] [PubMed] [Google Scholar]
- 8.Brooker S, Clements AC, Hotez PJ, et al. The co-distribution of Plasmodium falciparum and hookworm among African schoolchildren. Malar J. 2006;5:99. doi: 10.1186/1475-2875-5-99. [DOI] [PMC free article] [PubMed] [Google Scholar]
- 9.Diallo TO, Remoue F, Gaayeb L, et al. Schistosomiasis coinfection in children influences acquired immune response against Plasmodium falciparum malaria antigens. PLoS One. 2010;5:e12764. doi: 10.1371/journal.pone.0012764. [DOI] [PMC free article] [PubMed] [Google Scholar]
- 10.Hartgers FC, Obeng BB, Kruize YC, et al. Responses to malarial antigens are altered in helminth-infected children. J Infect Dis. 2009;199:1528–35. doi: 10.1086/598687. [DOI] [PubMed] [Google Scholar]
- 11.Sangweme DT, Midzi N, Zinyowera-Mutapuri S, Mduluza T, Diener-West M, Kumar N. Impact of schistosome infection on Plasmodium falciparum malariometric indices and immune correlates in school age children in Burma Valley, Zimbabwe. PLoS Negl Trop Dis. 2010;4:e882. doi: 10.1371/journal.pntd.0000882. [DOI] [PMC free article] [PubMed] [Google Scholar]
- 12.Brutus L, Watier L, Hanitrasoamampionona V, Razanatsoarilala H, Cot M. Confirmation of the protective effect of Ascaris lumbricoides on Plasmodium falciparum infection: results of a randomized trial in Madagascar. Am J Trop Med Hyg. 2007;77:1091–5. [PubMed] [Google Scholar]
- 13.Sokhna C, Le Hesran JY, Mbaye PA, et al. Increase of malaria attacks among children presenting concomitant infection by Schistosoma mansoni in Senegal. Malar J. 2004;3:43. doi: 10.1186/1475-2875-3-43. [DOI] [PMC free article] [PubMed] [Google Scholar]
- 14.Spiegel A, Tall A, Raphenon G, Trape JF, Druilhe P. Increased frequency of malaria attacks in subjects co-infected by intestinal worms and Plasmodium falciparum malaria. Trans R Soc Trop Med Hyg. 2003;97:198–9. doi: 10.1016/s0035-9203(03)90117-9. [DOI] [PubMed] [Google Scholar]
- 15.Wilson S, Vennervald BJ, Kadzo H, et al. Hepatosplenomegaly in Kenyan schoolchildren: exacerbation by concurrent chronic exposure to malaria and Schistosoma mansoni infection. Trop Med Int Health. 2007;12:1442–9. doi: 10.1111/j.1365-3156.2007.01950.x. [DOI] [PubMed] [Google Scholar]
- 16.Pullan RL, Kabatereine NB, Bukirwa H, Staedke SG, Brooker S. Heterogeneities and consequences of Plasmodium species and hookworm coinfection: a population based study in Uganda. J Infect Dis. 2011;203:406–17. doi: 10.1093/infdis/jiq063. [DOI] [PMC free article] [PubMed] [Google Scholar]
- 17.Ashton R, Kefyalew T, Tesfaye G, et al. School-based surveys of malaria in Oromia Regional State, Ethiopia: a rapid malaria surveillance approach for low transmission settings. Malar J. 2011;10:25. doi: 10.1186/1475-2875-10-25. [DOI] [PMC free article] [PubMed] [Google Scholar]
- 18.Gitonga CW, Karanja PN, Kihara J, et al. Implementing school malaria surveys in Kenya: towards a national surveillance system. Malar J. 2010;9:306. doi: 10.1186/1475-2875-9-306. [DOI] [PMC free article] [PubMed] [Google Scholar]
- 19.Abeku TA, van Oortmarssen GJ, Borsboom G, de Vlas SJ, Habbema JD. Spatial and temporal variations of malaria epidemic risk in Ethiopia: factors involved and implications. Acta Trop. 2003;87:331–40. doi: 10.1016/s0001-706x(03)00123-2. [DOI] [PubMed] [Google Scholar]
- 20.Noor AM, Gething PW, Alegana VA, et al. The risks of malaria infection in Kenya in 2009. BMC Infect Dis. 2009;9:180. doi: 10.1186/1471-2334-9-180. [DOI] [PMC free article] [PubMed] [Google Scholar]
- 21.Okello PE, Van Bortel W, Byaruhanga AM, et al. Variation in malaria transmission intensity in seven sites throughout Uganda. Am J Trop Med Hyg. 2006;75:219–25. [PubMed] [Google Scholar]
- 22.Brooker S, Kabatereine NB, Smith JL, et al. An updated atlas of human helminth infections: the example of East Africa. Int J Health Geogr. 2009;8:42. doi: 10.1186/1476-072X-8-42. [DOI] [PMC free article] [PubMed] [Google Scholar]
- 23.Chunge RN, Karumba PN, Andala EO. Hookworm species in patients from Kenyatta National Hospital Nairobi. Ann Trop Med Parasitol. 1986;80:147–8. doi: 10.1080/00034983.1986.11811998. [DOI] [PubMed] [Google Scholar]
- 24.Filmer D, Pritchett LH. Estimating wealth effects without expenditure data—or tears: an application to educational enrollments in states of India. Demography. 2001;38:115–32. doi: 10.1353/dem.2001.0003. [DOI] [PubMed] [Google Scholar]
- 25. Museum of Vertebrate Zoology. WorldClim. 2005: University of California, Berkeley. http://www.worldclim.org. Accessed 7 June 2009.
- 26.Hijmans RJ, Cameron SE, Parra JL, Jones PG, Jarvis A. Very high resolution interpolated climate surfaces for global land areas. Int J Climatol. 2005;25:1965–78. [Google Scholar]
- 27.Hay SI, Tatem AJ, Graham AJ, Goetz SJ, Rogers DJ. Global environmental data for mapping infectious disease distribution. Adv Parasitol. 2006;62:37–77. doi: 10.1016/S0065-308X(05)62002-7. [DOI] [PMC free article] [PubMed] [Google Scholar]
- 28.Scharlemann JP, Benz D, Hay SI, et al. Global data for ecology and epidemiology: a novel algorithm for temporal Fourier processing MODIS data. PLoS ONE. 2008;3:e1408. doi: 10.1371/journal.pone.0001408. [DOI] [PMC free article] [PubMed] [Google Scholar]
- 29.US Geological Survey. GTOPO30: global 30 arc second elevation data. Global http://eros.usgs.gov/#/Find_Data/Products_and_Data_Available/gtopo30_info. Accessed 1 September 2010. [Google Scholar]
- 30.Olson DM, Dinerstein E. The Global 200: priority ecoregions for global conservation. Ann Mo Bot Gard. 2009;89:125–6. [Google Scholar]
- 31.Diggle P, Moyeed R, Tawn J. Model-based geostatistics (with discussion) Appl Stat. 1998;47:299–350. [Google Scholar]
- 32.Rabe-Hesketh S, Skrondal A. Multilevel and longitudinal modelling using Stata. 2nd ed. College Station, TX: Stata Press; 2008. [Google Scholar]
- 33.Hillier SD, Booth M, Muhangi L, et al. Plasmodium falciparum and helminth coinfection in a semi urban population of pregnant women in Uganda. J Infect Dis. 2008;198:920–7. doi: 10.1086/591183. [DOI] [PMC free article] [PubMed] [Google Scholar]
- 34.Mazigo HD, Waihenya R, Lwambo NJ, et al. Co-infections with Plasmodium falciparum, Schistosoma mansoni and intestinal helminths among school children in endemic areas of northwestern Tanzania. Parasit Vectors. 2010;3:44. doi: 10.1186/1756-3305-3-44. [DOI] [PMC free article] [PubMed] [Google Scholar]
- 35.Midzi N, Sangweme D, Zinyowera S, et al. The burden of polyparasitism among primary school children in rural and farming areas in Zimbabwe. Trans R Soc Trop Med Hyg. 2008;102:1039–45. doi: 10.1016/j.trstmh.2008.05.024. [DOI] [PubMed] [Google Scholar]
- 36.Nkuo-Akenji TK, Chi PC, Cho JF, Ndamukong KK, Sumbele I. Malaria and helminth co-infection in children living in a malaria endemic setting of mount Cameroon and predictors of anemia. J Parasitol. 2006;92:1191–5. doi: 10.1645/GE-895R.1. [DOI] [PubMed] [Google Scholar]
- 37.Hay SI, Guerra CA, Gething PW, et al. A world malaria map: Plasmodium falciparum endemicity in 2007. PLoS Med. 2009;6:e1000048. doi: 10.1371/journal.pmed.1000048. [DOI] [PMC free article] [PubMed] [Google Scholar]
- 38.Brooker S, Hotez PJ, Bundy DA. The global atlas of helminth infection: mapping the way forward in neglected tropical disease control. PLoS Negl Trop Dis. 2010;4:e779. doi: 10.1371/journal.pntd.0000779. [DOI] [PMC free article] [PubMed] [Google Scholar]
- 39.Pullan RL, Gething PW, Smith JL, et al. Spatial modelling of soil-transmitted helminths in Kenya: a disease control planning tool. PLoS Negl Trop Dis. 2011;5:e958. doi: 10.1371/journal.pntd.0000958. [DOI] [PMC free article] [PubMed] [Google Scholar]
- 40.Raso G, Vounatsou P, Singer BH, N’Goran EK, Tanner M, Utzinger J. An integrated approach for risk profiling and spatial prediction of Schistosoma mansoni-hookworm coinfection. Proc Natl Acad Sci U S A. 2006;103:6934–9. doi: 10.1073/pnas.0601559103. [DOI] [PMC free article] [PubMed] [Google Scholar]
- 41.Schur N, Gosoniu L, Raso G, Utzinger J, Vounatsou P. Modelling the geographical distribution of co-infection risk from single-disease surveys. Stat Med. 2011;30:1761–76. doi: 10.1002/sim.4243. [DOI] [PubMed] [Google Scholar]
- 42.Yatich NJ, Yi J, Agbenyega T, et al. Malaria and intestinal helminth co-infection among pregnant women in Ghana: prevalence and risk factors. Am J Trop Med Hyg. 2009;80:896–901. [PubMed] [Google Scholar]
- 43.Okell LC, Ghani AC, Lyons E, Drakeley CJ. Submicroscopic infection in Plasmodium falciparum-endemic populations: a systematic review and meta-analysis. J Infect Dis. 2009;200:1509–17. doi: 10.1086/644781. [DOI] [PubMed] [Google Scholar]
- 44.Booth M, Vounatsou P, N'Goran EK, Tanner M, Utzinger J. The influence of sampling effort and the performance of the Kato-Katz technique in diagnosing Schistosoma mansoni and hookworm co-infections in rural Cote d’Ivoire. Parasitology. 2003;127:525–31. doi: 10.1017/s0031182003004128. [DOI] [PubMed] [Google Scholar]
- 45.Taylor SM, Juliano JJ, Trottman PA, et al. High-throughput pooling and real-time PCR-based strategy for malaria detection. J Clin Microbiol. 2010;48:512–9. doi: 10.1128/JCM.01800-09. [DOI] [PMC free article] [PubMed] [Google Scholar]