Abstract
Ascorbate (vitamin C, Asc) was quantified in vivo using short-TE 1H NMR spectra from a previously published study on regional and developmental changes in the neurochemical profile of the rat brain (Tkac I, Rao R, Georgieff MK, Gruetter R. Magn Reson Med. 2003; 50: 24–32). Asc concentration was quantified on postnatal days P7–P28 from three regions that are of interest in the study of neurocognitive development, i.e. the hippocampus, striatum and cerebral cortex. The previously measured 1H NMR spectra were re-analyzed using LCModel with the Asc spectrum included in the basis set. The Asc concentration was consistently quantified from all 110 re-analyzed spectra with an estimated fitting error of 7% (i.e. the average Cramer–Rao lower bound). The sensitivity of Asc quantification was sufficiently high to detect regional and developmental changes in Asc concentration. The concentration of Asc was highest on P7, and decreased with age in all three brain regions (p < 0.001) in agreement with previous in vitro studies. At P10 and older postnatal ages, an inhomogeneous distribution of Asc among brain regions was detected. In addition to facilitating the quantification of this important antioxidant concentration, the inclusion of the Asc spectrum in the LCModel basis set improved the quantification accuracy of other brain metabolite concentrations in the neurochemical profile.
Keywords: ascorbate, quantification, noninvasive, NMR spectroscopy, antioxidant, development, region
INTRODUCTION
A methodology for the noninvasive measurement of the brain vitamin C (ascorbate, Asc) concentration in a region-specific fashion could greatly enhance our understanding of how Asc is involved in maintaining healthy brain function throughout life. Asc is one of the two most concentrated nonenzymatic antioxidants in the central nervous system (1). During birth and development, brain Asc levels are high (2), suggesting that Asc plays a role in protecting the brain from reactive oxygen species (ROS)-mediated damage during episodes of hypoxia–ischemia and hypoglycemia, which are common (3–5). The timing of these insults relative to the emergence of critical developmental processes in the brain is associated with the distinct neurobehavioral deficits that ensue (3–6). Diet and the efficiency of delivery (7) may influence brain Asc levels in a time- and region-specific fashion (8,9). Multiple lines of evidence implicate oxidative damage as a cause, cofactor or consequence of compromised brain function in normal brain aging and age-related neurodegenerative disease. The important role of Asc in protecting the brain from oxidative damage is substantiated by the presence of elevated Asc under circumstances likely to increase levels of ROS (1,2). The region-specific noninvasive quantification of Asc would enable a longitudinal study approach, which has the potential to investigate the role played by antioxidants in protecting against neurobehavioral and neurodegenerative diseases, to follow the response to treatment and to find an early-stage, disease-specific biomarker.
Reliable noninvasive quantification of Asc concentration in the adult human (10,11), developing rat (12), mouse (13,14) and ground squirrel (15) brain via long- and short-TE 1H MRS has been validated (10–12) over the past several years. A benefit of short-TE 1H MRS is that Asc can be quantified simultaneously with 18 additional brain metabolites (i.e. the neurochemical profile). In addition to affirming the reliable quantification of Asc, previous experiments have indicated that the omission of Asc from the spectral analysis model may affect the quantification of other metabolites (11,12).
The primary goal of this project was to determine whether short-TE in vivo 1H NMR spectroscopy at 9.4 T is sufficiently sensitive to detect regional and developmental changes in Asc concentration. To achieve this goal, previously published 1H NMR spectra measured from three regions of the developing rat brain (16) were reprocessed using LCModel with a spectrum of Asc included in the basis set. A secondary objective of this project was to characterize the impact of the omission of Asc from the fitting algorithm on the quantification of the other brain metabolites in the neurochemical profile.
EXPERIMENTAL DETAILS
In this study, previously published 1H NMR spectroscopic data obtained to quantify the neurochemical profile of the rat brain at several ages from three distinct brain regions (16) were re-analyzed using LCModel with an Asc spectrum included in the basis set. The original in vivo 1H NMR spectra were measured at 9.4 T from the hippocampus, striatum and cortex of rat pups on postnatal days P7, P10, P14, P21 and P28. These brain regions were selected on the basis of their association with recognition memory, procedural memory and higher executive functions, respectively. 1H NMR spectra were measured using a quadrature transmit/receive surface radiofrequency (RF) coil and ultra-short TE stimulated echo acquisition mode (STEAM) spectroscopy [TE = 2 ms; TR = 5 s; number of transients (NT), 320; volume of interest (VOI), 11–24 μL]. A full description of the methodology can be found in the original paper (16).
1H NMR spectra (110 total, 4–12 per brain region and postnatal age) were re-analyzed using LCModel with the same basis spectra and control parameters as in the original paper (16), except that the spectrum of Asc was added to the LCModel basis set. The 1H NMR spectrum of Asc was simulated using previously reported chemical shifts and coupling constants (10). Thus, the LCModel basis set consisted of the spectra of the following 19 neurochemicals: alanine (Ala), Asc, aspartate (Asp), creatine (Cr), γ-aminobutyric acid (GABA), glucose (Glc), glutamate (Glu), glutamine (Gln), glutathione (GSH), glycerophosphorylcholine (GPC), phosphorylcholine (PC), myoinositol (Ins), lactate (Lac), N-acetylaspartate (NAA), N-acetylaspartylglutamate, phosphocreatine (PCr), phosphoethanolamine (PE), scyllo-inositol and taurine (Tau), as well as the spectrum of fast-relaxing macromolecules (MMs) measured from adult rats. To be thorough, all 110 spectra were re-analyzed once again with glycine (Gly) in the basis set. The unsuppressed water signal corrected for age-dependent changes in brain water content, measured using the weight difference between freshly removed brain and its residue after lyophilization [from 88% at P7 to 80% at P28 (16)], was used as an internal reference. Analysis of variance (ANOVA) was used to evaluate the developmental and regional changes in Asc concentration. p values are reported with two tails, assuming equal variance, and without adjustment for multiple comparisons.
RESULTS
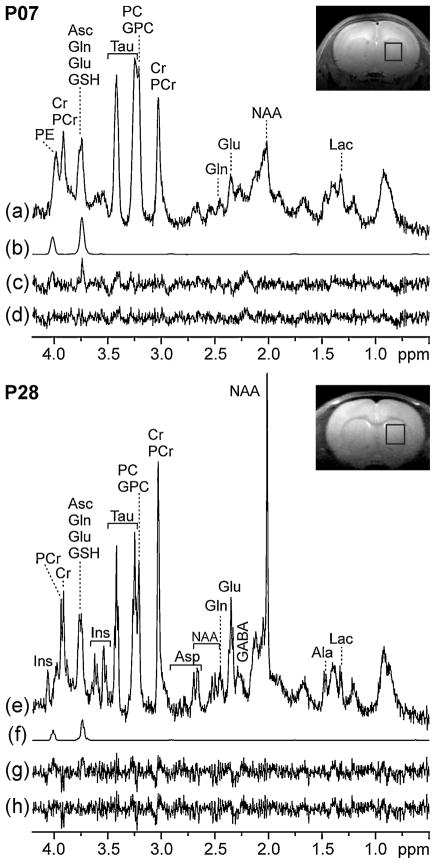
Resonances from Asc at 3.74 and 4.01 ppm contributed substantially to short-TE in vivo 1H NMR spectra of the rat brain (Fig. 1). The signal contribution from Asc to the overall signal intensity near 3.75 ppm was most evident in the spectrum measured on P7 (Fig. 1a, b), the age at which the Asc concentration was highest, but the Glu and Gln concentrations were low (16). At this early postnatal age, Asc accounted for at least 50% of the signal intensity at 3.75 ppm (Fig. 1a, b). The absence of Asc from the LCModel basis set left residual signals at the chemical shifts of Asc (Fig. 1c). Although the Asc concentration had decreased by age P28 (Fig. 1f), the presence of unassigned signal in the fitted residual was still apparent if Asc was not included in the LCModel basis set (Fig. 1g). Residual signals near 4.01 and 3.75 ppm (Fig. 1c, g) diminished to the noise level after Asc was added to the LCModel basis set (Fig. 1d, h, respectively).
Figure 1.
Representative short-TE 1H NMR spectra [stimulated echo acquisition mode (STEAM); 9.4 T; TE = 2 ms; TR = 5 s; number of transients (NT), 320; not apodized; phase-sensitive mode) measured in vivo from the striatum [volume of interest (VOI) outlined on insets] on postnatal days P7 (VOI = 18 μL) and P28 (VOI = 24 μL), as well as noteworthy components of LCModel analysis: (a, e) in vivo 1H NMR spectra; (b, f) LCModel fits of ascorbate (Asc); (c, g) fitted residuals without Asc in the basis set; (d, h) fitted residuals with Asc in the basis set. The in vivo spectra (a, e) are scaled so that the signal intensities are proportional to the metabolite concentrations. See text for abbreviations.
Figure 2 illustrates the Asc concentrations that were quantified from all 110 reprocessed spectra. The average Cramer–Rao lower bound (CRLB) estimates of fitting error were in the range 7–10% for all ages and regions. In units of concentration, these estimates of precision were very uniform (0.19–0.26 μmol/g). Asc was amongst the five most concentrated neurochemicals (together with Cr, Glc, PE and Tau) in the pup brains at age P7. Both postnatal age and brain region had an effect on Asc concentration (p < 0.001). Concentrations were highest on P7 and were indistinguishable between the three brain regions at this age (p = 0.14). Concentrations decreased between P7 and P28 in all three regions (p < 0.001). However, the decreases in the three regions were not uniform, such that, beyond P7, the Asc concentration differed among the brain regions at all four postnatal ages. At each age beyond P7, the Asc concentration was highest in the cerebral cortex and lowest in the striatum.
Figure 2.
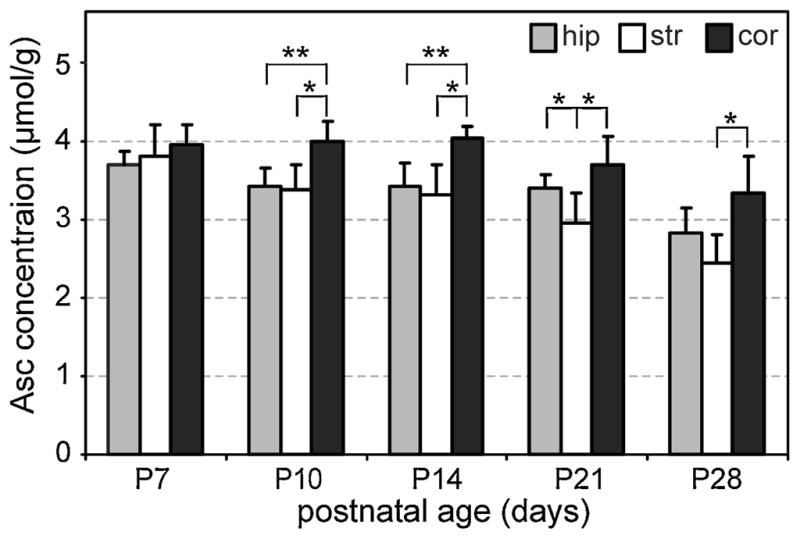
Ascorbate (Asc) concentrations (mean ± SD) measured in the developing rat hippocampus (hip), striatum (str) and cortex (cor). Significant differences among regions were measured at all ages past postnatal day P7, and are reported as *p < 0.01 or **p < 0.001 without adjustment for multiple comparisons. The numbers of spectra analyzed for each region on P7, P10, P14, P21 and P28 were 8, 12, 12, 11 and 9 for hippocampus, 5, 6, 7, 8 and 7 for striatum and 5, 5, 5, 6 and 4 for cortex, respectively.
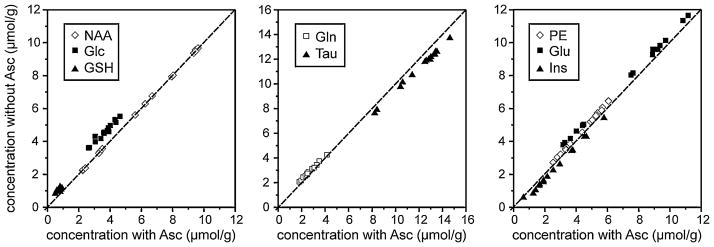
Figure 3a–g illustrates how overlap of the Asc resonance with resonances from Glc, Gln, Glu, GSH and PE complicates the quantification of the concentrations of these neurochemicals. The omission of any one of these neurochemicals from the LCModel basis set could lead to an overestimation of the concentrations of those remaining (Fig. 3, broken lines). Indeed, the concentrations of Glc, Gln, Glu, GSH and PE that were quantified from all three brain regions at all five postnatal ages were overestimated when Asc was omitted from the LCModel basis set (Fig. 4). This systematic overestimation is clearly demonstrated by the shift of points above the line of identity on the scatter plots comparing average metabolite concentrations quantified with Asc versus concentrations quantified without Asc in the LCModel basis set (Fig. 4). The overestimation of Glc led to underestimations of Ins and Tau because of the overlap of Ins and Tau resonances with the spectrum of Glc (Fig. 3, shaded regions). This secondary effect, resulting from an indirect overlap with Asc, is demonstrated by the shift of the points of Ins and Tau below the identity line on the scatter plots (Fig. 4). Significant differences (paired t-test, p < 10−6) between concentrations quantified from all 110 spectra with Asc and without Asc in the basis set were found for (mean ± SD): Δ[Glc] = 0.9 ± 0.2 μmol/g, Δ[Gln] = 0.2 ± 0.1 μmol/g, Δ[Glu] = 0.5 ± 0.1 μmol/g, Δ[GSH] = 0.3 ± 0.1 μmol/g, Δ[PE] = 0.3 ± 0.1 μmol/g, Δ[Ins] = −0.3 ± 0.1 μmol/g, Δ[Tau] = −0.8 ± 0.2 μmol/g. The high significance of these concentration differences originates from the fact that the metabolite quantification without Asc in the basis set was biased and led to concentration changes in a uniform direction (Fig. 4). Systematic overestimation of Glc, Gln, Glu and PE and underestimation of Ins and Tau, approximately by constant values, are discernible in Fig. 4, where the points representing the average metabolite concentrations in different brain regions and at different postnatal ages are spread along a line parallel to the line of identity. Points representing GSH form a cluster shifted from the line of identity, because the GSH concentration in the rat brain spans the narrow range of 0.6–0.9 μmol/g. Figures 3 and 4 selectively illustrate the most pronounced bias in metabolite quantification that occurs when Asc is absent from the LCModel basis set. This bias originates in the primary (Fig. 3b–g, broken lines) and secondary (Fig. 3c, h, i, shaded regions) overlapping effects. The NAA data in Fig. 4 demonstrate that the omission of Asc from the basis set has a negligible effect on NAA quantification, because the spectra of NAA and Asc do not overlap and NAA shows only marginal overlap with Gln, which is affected by primary overlap with Asc.
Figure 3.
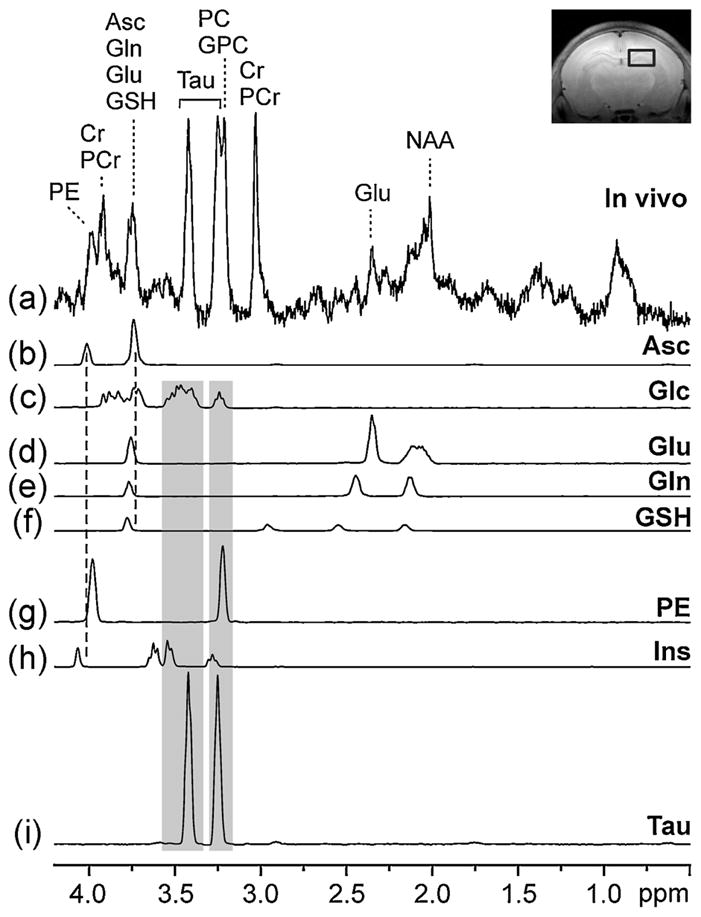
LCModel analysis of a representative 1H NMR spectrum measured from the rat hippocampus on postnatal day P7. Only metabolites overlapping directly or indirectly with ascorbate (Asc) are shown. (a) Representative in vivo 1H NMR spectrum [stimulated echo acquisition mode (STEAM); TE = 2 ms; TR = 5 s; number of transients (NT), 320]; (b–i) metabolite spectra quantified by LCModel analysis; (c–g) metabolites directly overlapping with Asc (broken lines); (h, i) metabolites indirectly overlapping with Asc through glucose (Glc) (shaded regions). Inset: axial MR image illustrating the position of the volume of interest (VOI) which was centered in the hippocampus. See text for abbreviations.
Figure 4.
Comparison of average neurochemical concentrations quantified from each brain region at each postnatal age using LCModel with and without ascorbate (Asc) in the basis set. The metabolites most affected by the omission of Asc from the basis set are shown. N-Acetylaspartate (NAA) is included to demonstrate that the omission of Asc from the basis set has only a marginal effect on the quantification of metabolites without direct or indirect overlap with Asc. See text for abbreviations.
The largest relative differences in neurochemical concentrations, measured with versus without Asc in the LCModel basis set, were found for Glc (26%) and GSH (45%). Resonances from these two weakly represented neurochemicals overlap with the stronger Asc resonance at 3.74 ppm (Fig. 3a–c, f, broken line). When Asc was added to the LCModel basis set, the measured concentrations of these neurochemicals decreased relative to their originally published values (16) by approximately 0.9 μmol/g for Glc and 0.3 μmol/g for GSH. Both concentration differences were larger than the corresponding quantification errors (CRLB) (17) that were estimated prior to the inclusion of Asc in the LCModel basis set (CRLB = 0.3 μmol/g for Glc and CRLB = 0.1 μmol/g for GSH). The overall pattern of developmental and regional changes for Glc was not affected. Indeed, the only neurochemical for which the pattern of developmental and regional changes differed noticeably from that reported in the original paper (16) after the addition of Asc to the LCModel basis set was GSH. Figure 5 illustrates that lower GSH concentrations were measured in the cortical region than in the hippocampus at older postnatal ages (P14–P28). These differences reached a higher level of significance when Asc was added to the LCModel basis set than the significance levels reported in the original paper (16).
Figure 5.
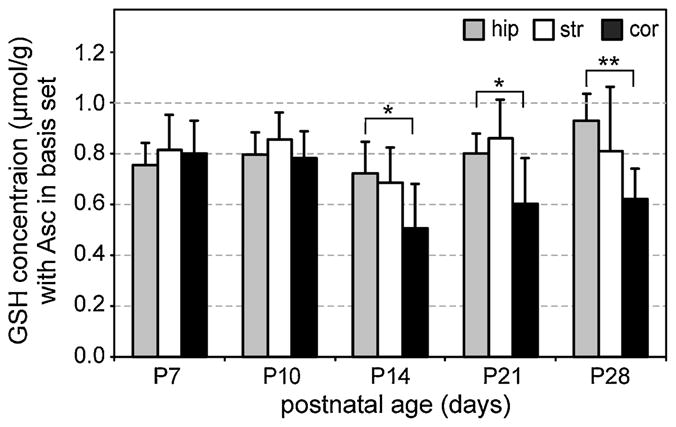
Glutathione (GSH) concentrations (mean ± SD) quantified in the developing rat hippocampus (hip), striatum (str) and cortex (cor) with ascorbate (Asc) included in the LCModel basis set. This was the only metabolite from the whole neurochemical profile for which minor changes in quantification relative to those originally reported (16) were noticeable. Significant differences between the hippocampus and cortex were measured at postnatal day P14 and beyond, and are reported as *p < 0.01 and **p < 0.001 without adjustment for multiple comparisons. The numbers of spectra analyzed for each region and age are the same as reported in Fig. 2.
To investigate the detectability of the Gly resonance (18) in the spectra used in this study, and to evaluate the extent to which Gly impacted the quantification of other brain metabolites, all 110 spectra were re-analyzed once again with Gly in the LCModel basis set. Gly was only detected (CRLB < 50%) in 30% of the reprocessed spectra and this detection was sporadically distributed among age and brain region groups. The effect of inclusion of Gly in the LCModel basis set on the quantification of the other brain metabolites was negligible. Differences between the concentrations quantified with and without Gly in the basis set were less than 0.07 μmol/g for all metabolites at all ages in all brain regions.
DISCUSSION
Changes in Asc concentration were quantified in three different brain regions throughout postnatal development via the re-analysis of previously measured short-TE 1H NMR spectra (16). Developmental changes and regional differences in Asc concentration were detected simultaneously with changes in 18 other neurochemicals. Overall, the high Asc concentration quantified at an early postnatal age, as well as its gradual decrease with age, are in agreement with previous in vivo (12) and ex vivo (2) findings. Moreover, beyond the youngest age (P7), quantification of Asc from short-TE spectra at 9.4 T was sufficiently sensitive to detect an inhomogeneous distribution of Asc in rat brain. Higher levels of Asc in the cerebral cortex relative to the hippocampus (Fig. 2) are in agreement with published ex vivo data (2). Even if the Bonferroni correction for multiple comparisons (three brain regions) was applied, differences in Asc concentration between brain regions would remain significant (Fig. 2). The results of this study demonstrate that in vivo 1H NMR spectroscopy at 9.4 T has the potential to quantify Asc concentration with sufficient sensitivity and reliability to study how key antioxidant concentrations change in pertinent brain regions throughout the progression of neurocognitive disease in animal models.
Asc was reliably quantified (average CRLB = 7%) from all of the 110 short-TE 1H NMR spectra included in this study. However, reliable quantification of Asc is challenging and requires 1H NMR spectra of adequate quality, as well as a correct prior knowledge in the LCModel basis set (19). One important aspect of spectral quality is water suppression that is efficient and sufficiently frequency selective to remove the water signal without perturbing the Asc resonances at 4.01 ppm. Another important factor is the localization performance of the sequence, which must guarantee efficient elimination of signals arising from outside the VOI, especially those from subcutaneous lipids. Artifact free spectra result in a flat baseline, which is a key factor for accurate quantification. A complete and accurate basis set is crucial for reliable LCModel analysis (19). The measured basis spectra must be acquired from metabolite solutions that have correct pH and temperature. If basis spectra are simulated, a high accuracy of the chemical shifts and coupling constants used for simulation is required (20). The spectrum of fast-relaxing MMs should be measured and included in the LCModel basis set (21,22) to facilitate the meaningful quantification of weakly represented neurochemicals, such as Asc and GSH. Decomposition of the signal at 3.75 ppm into contributions from Asc, Glc, Gln, Glu and GSH is dependent on additional resonances from these neurochemicals at other chemical shifts. Thus, high spectral quality over the entire chemical shift range (0.5–4.2 ppm) is necessary for reliable quantification of Asc. For example, the chemical shift range spanning 3.25–3.45 ppm is critical to resolve the contributions from Gln and Glu at a chemical shift of 3.75 ppm (Fig. 3). Because of these high demands on spectral quality, precise mapping of Asc spatial distribution has not been demonstrated to date. However, the development of MRSI methodology would be highly beneficial to study the regional differences in animal models of neurodegenerative disease, where antioxidants may play a significant role.
Signals that could not be accounted for persisted in LCModel fitted residuals when Asc was not included in the basis set (Fig. 1c, g). Under these circumstances, the linear combination of the basis spectra could not account for the entire signal near 3.75 ppm. The fitting algorithm correctly recognized that a spectrum was missing from the basis set. However, the signal intensities in the fitted residuals at the chemical shifts of Asc (Fig. 1c) were slightly lower than the fitted Asc contribution (Fig. 1b). This mismatch would not occur if the basis set spectra were fully orthogonal, and if signal-to-noise ratios of in vivo spectra were very high. However, in practice, when Asc is missing from the basis set, the signal contribution from Asc is partially distributed to estimate the contributions from overlapping metabolites (Fig. 3), which causes systematic overestimation of their concentrations (Fig. 4). The concentrations of Glc, Gln, Glu, GSH and PE were overestimated approximately by constant values (points distributed along lines parallel to the line of identity), probably because Asc concentrations in the rat brain spanned over the narrow range 3.4 ± 0.5 μmol/g (Fig. 2). The proximity of all points in Fig. 4 to the unity line supports the finding that the inclusion of Asc in the basis set leads to only minor changes in the metabolite concentrations relative to those published previously (16).
The largest relative differences in metabolite concentrations, quantified with and without Asc in the LCModel basis set, were observed for Glc and GSH. These differences were larger than the estimated errors of LCModel fitting (CRLB) when Asc was not included in the basis set. These findings are not in contradiction because quantification errors (CRLB) were estimated on the basis of the assumption that the model was complete, which was not fulfilled if Asc was missing from the basis set. The Glc concentrations measured after the inclusion of Asc in the LCModel basis set are closer to those reported under physiological conditions (23) than are those measured without Asc in the basis set (16). The overestimation of the GSH concentration caused by the omission of Asc from the LCModel basis set (Fig. 4) is noteworthy because GSH and Asc are the two most concentrated chemical antioxidants in the central nervous system, and their accurate quantification is critical for studies focused on oxidative stress. As Asc and GSH have similar concentrations in the mature human brain (~1 μmol/g), the exclusion of Asc from the spectral analysis would probably result in an overestimation of the GSH concentration, which would lead to an incorrect interpretation of how measured data reflect antioxidant capacity.
The increased accuracy for quantification of the entire neurochemical profile that was achieved when Asc was added to the basis set exemplifies the benefit of better model specification. A similar improvement in model specification was attempted via re-analysis after the addition of Gly to the basis set. A lower sensitivity for the detection of Gly than reported previously (18) was anticipated given the suboptimal TE and insufficient signal-to-noise ratio of the reprocessed spectra. As a result, the inclusion of Gly in the basis set for re-analysis had a negligible influence on the quantification of other brain metabolites (<0.07 μmol/g) relative to the substantial influence that was demonstrated for the inclusion of Asc (Fig. 4). Another change in model specification that could potentially lead to minor changes in measured Asc concentrations would be the utilization of the MM spectra measured from each age and brain region. However, the MM content was quantified robustly in this study (CRLB ~ 2%), and neither the fitted residuals nor the spline baselines gave an indication of mismatch between the adult MM basis spectrum and the MM signal contributions in vivo. Finally, accuracy in calibration of the model was supported by the agreement between the concentrations measured in this study with those measured previously from a similar region (12). Slightly different concentrations measured using MEGA-PRESS (point-resolved spectroscopy)-edited spectra probably arose from differences in model calibration (12).
CONCLUSION
The noninvasive quantification of Asc simultaneously with 18 other neurochemicals is feasible using in vivo 1H NMR spectroscopy at 9.4 T combined with LCModel analysis. The sensitivity of Asc quantification from short-TE spectra measured at 9.4 T is sufficient to detect developmental and regional changes in rat brain. The inclusion of Asc in neurochemical profiles quantified from 1H NMR spectra increases the potential for understanding the role played by antioxidants in animal models of brain development and neurocognitive diseases where oxidative stress is involved. In addition, the inclusion of Asc in the model for the analysis of short-TE spectra improves the quantification accuracy of the other metabolite concentrations in the neurochemical profile.
Acknowledgments
The following institutions supported this study: National Center for Research Resources (NCRR) Biotechnology Research Resource (grant number P41 RR08079) to the Center for Magnetic Resonance Research (CMRR); Neuroscience Center Core Blueprint award (grant number P30 NS057091) to CMRR; National Institutes of Health, National Institute on Aging (NIA) (grant number R21AG029582) to Melissa Terpstra; KECK Foundation to CMRR.
Abbreviations used
- Ala
alanine
- ANOVA
analysis of variance
- Asc
ascorbate
- Asp
aspartate
- CRLB
Cramer–Rao lower bound
- Cr
creatine
- GABA
γ-aminobutyric acid
- Glc
glucose
- Gln
glutamine
- Glu
glutamate
- Gly
glycine
- GPC
glycerophosphorylcholine
- GSH
glutathione
- Ins
myoinositol
- Lac
lactate
- MMs
macromolecules
- NAA
N-acetylaspartate
- NT
number of transients
- P
postnatal day
- PC
phosphorylcholine
- PCr
phosphocreatine
- PE
phosphorylethanolamine
- RF
radiofrequency
- ROS
reactive oxygen species
- STEAM
stimulated echo acquisition mode
- Tau
taurine
- VOI
volume of interest
References
- 1.Rice ME, Forman RE, Chen BT, Avshalumov MV, Cragg SJ, Drew KL. Brain antioxidant regulation in mammals and anoxia-tolerant reptiles: balanced for neuroprotection and neuro modulation. Comp Biochem Physiol C. 2002;133:515–525. doi: 10.1016/s1532-0456(02)00116-3. [DOI] [PubMed] [Google Scholar]
- 2.Rice ME, Russo-Menna I. Differential compartmentalization of brain ascorbate and glutathione between neurons and glia. Neuroscience. 1998;82:1213–1223. doi: 10.1016/s0306-4522(97)00347-3. [DOI] [PubMed] [Google Scholar]
- 3.Ennis K, Tran PV, Seaquist ER, Rao R. Postnatal age influences hypoglycemia-induced neuronal injury in the rat brain. Brain Res. 2008;1224:119–126. doi: 10.1016/j.brainres.2008.06.003. [DOI] [PMC free article] [PubMed] [Google Scholar]
- 4.Yager JY, Thornhill JA. The effect of age on susceptibility to hypoxic–ischemic brain damage. Neurosci Biobehav Rev. 1997;21:167–174. doi: 10.1016/s0149-7634(96)00006-1. [DOI] [PubMed] [Google Scholar]
- 5.Rao R, Sperr D, Ennis K, Tran P. Postnatal age influences hypoglycemia-induced poly(ADP-ribose) polymerase-1 activation in the brain regions of rats. Pediatr Res. 2009;66:642–647. doi: 10.1203/PDR.0b013e3181bbce69. [DOI] [PMC free article] [PubMed] [Google Scholar]
- 6.Rice D, Barone S. Critical periods of vulnerability for the developing nervous system: evidence from humans and animal models. Environ Health Perspect. 2000;108 (suppl):511–533. doi: 10.1289/ehp.00108s3511. [DOI] [PMC free article] [PubMed] [Google Scholar]
- 7.Heideger MA. New view at C. Nat Med. 2002;8:445–446. doi: 10.1038/nm0502-445. [DOI] [PubMed] [Google Scholar]
- 8.Rajalakshmi R, Thrivikraman KV, Ramakrishnan CV. Protein deficiency and regional chemistry of the brain: Part I – effects of protein deficiency on regional distribution of protein, glutathione, and ascorbic acid in the rat brain. Indian J Biochem Biophys. 1971;8:295–299. [PubMed] [Google Scholar]
- 9.Rajalakshmi R, Malathy J, Ramakrishnan CV. Effect of dietary protein content on regional distribution of ascorbic acid in the rat brain. J Neurochem. 1967;14:161–167. doi: 10.1111/j.1471-4159.1967.tb05888.x. [DOI] [PubMed] [Google Scholar]
- 10.Terpstra M, Gruetter R. 1H NMR detection of vitamin C in human brain in vivo. Magn Reson Med. 2004;51:225–229. doi: 10.1002/mrm.10715. [DOI] [PubMed] [Google Scholar]
- 11.Terpstra M, Ugurbil K, Tkac I. Noninvasive quantification of human brain ascorbate concentration using 1H NMR spectroscopy at 7T. NMR Biomed. 2010;23:227–232. doi: 10.1002/nbm.1423. [DOI] [PMC free article] [PubMed] [Google Scholar]
- 12.Terpstra M, Tkac I, Rao R, Gruetter R. Quantification of vitamin C in the rat brain in vivo using short echo time 1H MRS. Magn Reson Med. 2006;55:979–983. doi: 10.1002/mrm.20854. [DOI] [PubMed] [Google Scholar]
- 13.Lei H, Berthet C, Hirt L, Gruetter R. Evolution of the neurochemical profile after transient focal ischemia in the mouse brain. J Cereb Blood Flow Metab. 2009;29:811–819. doi: 10.1038/jcbfm.2009.8. [DOI] [PubMed] [Google Scholar]
- 14.Tkac I, Dubinsky JM, Keene CD, Gruetter R, Low WC. Neurochemical changes in Huntington R6/2 mouse striatum detected by in vivo 1H NMR spectroscopy. J Neurochem. 2007;100:1397–1406. doi: 10.1111/j.1471-4159.2006.04323.x. [DOI] [PMC free article] [PubMed] [Google Scholar]
- 15.Henry P-G, Russeth KP, Tkac I, Drewes LR, Andrews MT, Gruetter R. Brain energy metabolism and neurotransmission in near-freezing temperatures: in vivo 1H MRS study of hibernating mammal. J Neurochem. 2007;101:1505–1515. doi: 10.1111/j.1471-4159.2007.04514.x. [DOI] [PubMed] [Google Scholar]
- 16.Tkac I, Rao R, Georgieff MK, Gruetter R. Developmental and regional changes in the neurochemical profile of the rat brain determined by in vivo 1H NMR spectroscopy. Magn Reson Med. 2003;50:24–32. doi: 10.1002/mrm.10497. [DOI] [PubMed] [Google Scholar]
- 17.Provencher SW. Estimation of metabolite concentrations from localized in vivo proton NMR spectra. Magn Reson Med. 1993;30:672–679. doi: 10.1002/mrm.1910300604. [DOI] [PubMed] [Google Scholar]
- 18.Gambarota G, Xin L, Perazzolo C, Kohler I, Mlynarik V, Gruetter R. In vivo 1H NMR measurement of glycine in rat brain at 9.4 T at short echo time. Magn Reson Med. 2008;60:727–731. doi: 10.1002/mrm.21695. [DOI] [PubMed] [Google Scholar]
- 19.Provencher SW. Automatic quantitation of localized in vivo 1H spectra with LCModel. NMR Biomed. 2001;14:260–264. doi: 10.1002/nbm.698. [DOI] [PubMed] [Google Scholar]
- 20.Tkac I. Refinement of simulated basis set for LCModel analysis. Proceedings of the 16th Annual Meeting ISMRM; Toronto: Canada. 2008. p. 1624. [Google Scholar]
- 21.Pfeuffer J, Tkac I, Provencher SW, Gruetter R. Toward an in vivo neurochemical profile: quantification of 18 metabolites in short-echo-time 1H NMR spectra of the rat brain. J Magn Reson. 1999;141:104–120. doi: 10.1006/jmre.1999.1895. [DOI] [PubMed] [Google Scholar]
- 22.Tkac I, Henry P-G, Andersen P, Keene CD, Low WC, Gruetter R. Highly resolved in vivo 1H NMR spectroscopy of the mouse brain at 9.4 T. Magn Reson Med. 2004;52:478–484. doi: 10.1002/mrm.20184. [DOI] [PubMed] [Google Scholar]
- 23.Choi I, Lee S, Kim S-G, Gruetter R. In vivo measurements of brain glucose transport using the reversible Michaelis–Menton model and simultaneous measurements of cerebral blood flow changes during hypoglycemia. J Cereb Blood Flow Metab. 2001;21:653–663. doi: 10.1097/00004647-200106000-00003. [DOI] [PubMed] [Google Scholar]


