

Abstract
Replication Protein A (RPA) interacts with multiple checkpoint proteins and promotes signaling through the ATR kinase, a key regulator of checkpoint pathways in the mammalian response to DNA damage. In cancer cells, increased DNA repair activity contributes to resistance to chemotherapy. Therefore, small molecules that block binding of checkpoint proteins to RPA may inhibit the DNA damage response and thus sensitize cancer cells to DNA-damaging agents. Here we report on the development of a homogenous, high-throughput fluorescence polarization assay for identifying compounds that block the critical protein-protein interaction site in the basic cleft of RPA70N. A FITC-labeled peptide derived from the ATR cofactor, ATRIP, was used as a probe in the binding assay. The ability of the assay to accurately detect relevant ligands was confirmed using peptides derived from ATRIP, RAD9, MRE11, and p53. The assay was validated for use in high-throughput screening using the Spectrum collection of 2000 compounds. The FPA assay performed with a Z’ factor of ≥0.76 in a 384-well format and identified several compounds capable of inhibiting the RPA70N binding interface.
Keywords: Cancer, Checkpoint pathways, RPA70N, ATRIP, Fluorescence polarization anisotropy assay, High Throughput Screening
Introduction
The abundant eukaryotic single-stranded DNA (ssDNA) binding protein replication protein A (RPA) plays an essential role in virtually all DNA transactions in the cell, including replication, damage response, and repair[1]. RPA not only serves to protect and organize ssDNA, but also has an important role as a scaffold for the recruitment and docking of proteins in DNA processing machines [2]. RPA is a heterotrimer of RPA70, RPA32, and RPA14 subunits that contain six oligonucleotide-oligosaccharide fold (OB-fold) domains, four of which mediate the binding to ssDNA. The N-terminal OB-fold domain of RPA70 (RPA70N) binds ssDNA very weakly but instead uses its basic cleft as a protein docking site for recruiting other DNA processing proteins.
RPA-coated ssDNA at sites of DNA damage signals for recruitment of critical checkpoint proteins, including the ATR kinase [3; 4]. ATR interaction with RPA70N is mediated through the ATR interacting protein (ATRIP), which is tightly associated with ATR and required for ATR function [5]. RPA70N also mediates recruitment of other DNA damage response proteins including Rad9, p53, and MRE11 [4]. It has been shown that mutation of residues that disrupt ATRIP or RAD9 interactions with RPA70N can modify their localization [4,3]. In addition, disruption of the RAD9-RPA70N interaction impairs ATR signaling to CHK1 and causes hypersensitivity to both DNA damage and replication stress [3; 4].
RPA’s role in the ATR signaling pathway suggests that inhibition of its activity may increase replicative stress [4; 6]. Molecules that specifically target the protein-protein interaction surface on RPA70N are of particular interest because they have the potential to increase replicative stress without deleteriously affecting RPA’s binding of ssDNA, a potential source of unwanted toxicity [4]. Cancer cells have higher levels of replicative stress than normal cells and may thus be more sensitive to therapeutics that target the replicative stress response [4; 7]. Inhibiting RPA’s role in DNA repair may also be useful in treating cancers that have acquired resistance to DNA damaging agents through enhanced DNA repair mechanisms [6].
Inhibitors of protein-protein interactions are of considerable interest as potential therapeutic targets. Traditionally, these large, sometimes relatively flat interaction surfaces have a reputation of being very difficult to disrupt with small molecule inhibitors [8]. Fragment-based drug discovery methods, including SAR by NMR, have recently shown promise as a way to discover protein-protein interaction inhibitors [9]. This approach can robustly identify low affinity and low molecular weight small molecule leads [10; 11], is tolerant of standard solvents such as DMSO, which is widely used as the carrier for compounds in screening libraries, and can robustly identify compounds that bind to the protein at high concentrations. However, once these small molecule leads are identified, follow-up assays are required to evaluate their ability to effect function.
Here we describe a homogeneous fluorescence polarization anisotropy (FPA) assay [12] that uses a FITC-labeled peptide derived from the checkpoint protein ATRIP as a reporter to detect molecules that bind to the RPA70N protein-protein interaction surface [4]. Compounds that displace this peptide from the N-terminal domain of RPA70 cause a change in the fluorescence polarization anisotropy of the sample, which is used to quantify binding. This probe molecule can be used to identify inhibitors over a wide range of potencies and the resulting assay can be used in a high throughput format to identify small molecule leads that inhibit binding to the protein-protein interaction surface of RPA70N.
Materials and Methods
RPA70N Expression and Purification
RPA70N was produced as described previously [4] with a few modifications. In summary, human RPA70 residues 1-120 in a pET15b vector (Novagen) were transformed into BL21-DE3 cells (New England Biolabs) for expression. Overnight cultures were prepared from single colonies and used (10 mL) to inoculate 1 L of LB-broth. The cultures were grown at 37 °C to an OD600 of 0.5-0.6, at which time IPTG was added to a final concentration of 1 mM. After an additional 5 hours, the bacteria were collected by centrifugation and sonicated in buffer A (50 mM HEPES, 500 mM NaCl, 2 mM BME, 10 mM imidazole, pH 7.5). Following centrifugation of the bacterial lysate, the supernatant was applied to a Ni Sepharose column (GE Healthcare) equilibrated with buffer A and then washed. Following elution of RPA70N with buffer B (50 mM HEPES, 500 mM NaCl, 2 mM BME, 250 mM imidazole, pH 7.5), thrombin (ZymoGenetics) was added to the eluate, then dialyzed overnight at 4 °C against buffer A. After re-pass over a Ni column to remove the cleaved (His)6 tag, RPA70N was obtained at greater than 95% purity as judged by SDS-PAGE gel analysis. Production of 15N-labeled RPA70N for NMR studies was nearly identical to the protocol described above except that M9 media containing 0.5 g of 15NH4Cl per liter was used as a sole nitrogen source. Finally unlabeled or 15N-labeled RPA70N samples were dialyzed against assay buffer (50 mM HEPES, 75 mM NaCl, 5 mM DTT, pH 7.5) for use in NMR or fluorescence polarization studies.
Peptide Synthesis
The ATRIP (Ac-DFTADDLEELDTLAS-NH2 ), RAD9 (Ac-DFANDDIDSYMIAME-NH2), MRE11 (Ac-AFSADDLMSIDLAEQ- NH2), and p53 (Ac-MLSPDDIEQWFTEDP-NH2) peptides were purchased from GenScript USA Inc. The fluorescein isothiocyanate (FITC)-labeled ATRIP peptide (FITC-Ahx-DFTADDLEELDTLAS-NH2) was purchased from NeoBioSci (NEO Group Inc.). All peptides were purified by the manufacturer using high-performance liquid chromatography to >95% purity. Unlabeled peptides were resuspended to 10 mM in assay buffer. The FITC-ATRIP peptide was dissolved in DMSO to a final concentration of 1 mM.
NMR Experiments
Nuclear magnetic resonance (NMR) experiments were performed at 25°C using Bruker Avance III 500-MHz or 600-MHz NMR spectrometers which are equipped with a 5-mm single-axis z gradient cryoprobe. Two-dimensional, gradient-enhanced 1H,15N heteronuclear multiple-quantum coherence (SOFAST-HMQC) spectra [13] were used to track shift changes upon ligand binding. Concentrations used in the NMR measurements were 40 μM for RPA70N and 50, 99, 196, 385, and 741 μM for the peptide titration experiments. 1H and 15N backbone NMR assignments for RPA70N were kindly provided by Cheryl Arrowsmith (Ontario Cancer Institute, Toronto, Canada). Experimental chemical shift changes were used to obtain Kd values using in-house software that applies the expressions of Wang [14; 15] for fitting.
Determination of the peptide equilibrium dissociation constant
Fluorescence polarization experiments were performed in black Matrix 96-well flat-bottom plates (Thermo Fisher Scientific) using the Wallac 2100 EnVision plate reader (PerkinElmer) running version 1.12 of the EnVision Manager software. Increasing concentrations of RPA70N (0 – 50 μM) were titrated into a total of 50 μL assay buffer (50 mM HEPES, 75 mM NaCl, 5 mM DTT, pH 7.5) containing 5% DMSO and 50 nM FITC-ATRIP. The plate was mixed on a shaker for 15 minutes and incubated at room temperature for 1 hour to reach equilibrium. Samples were measured at an excitation wavelength of 480 nm and an emission wavelength of 535 nm. The emission polarization values were determined by the EnVision operating software according to the formula:
The G-factor was determined experimentally by measuring the parallel and perpendicular intensities of a 1 nM solution of fluorescein using the following formula [16]:
where L is the reported polarization value of a 1 nM solution of fluorescein (27 mP) [16]. Data were analyzed using GraphPad Prism 5 (Graph Pad Software Inc.), plotting the anisotropy values against RPA concentration and fitting the curve to a single-site binding model to extract a binding dissociation constant (Kd value). All experiments were run in duplicate on two different days.
FPA peptide competition assay
Serial dilutions of the ATRIP, RAD9, MRE11, and p53 peptides (0 – 700 μM) were added to 6 μM RPA70N, 500 nM FITC-ATRIP in assay buffer and incubated for 1 hour before measurement on the EnVision plate reader. Data were analyzed by plotting anisotropy against competitor peptide concentration. IC50 values were determined using a four-parameter dose-response (variable slope) equation in Graph Pad Prism 5:
where X represents log [peptide, M], Y represents the response (emission anisotropy), Top and Bottom represent the maximal and minimal responses, respectively (in the same units as Y); and LogIC50 is given in the same log unit as X. IC50 values were converted into Kd values, using the Ki calculator (http://sw16.im.med.umich.edu/software/calc_ki/) [17], according to the formula:
where [I]50 is the concentration of the free inhibitor at 50% inhibition, [L]50 is the concentration of the free labeled ligand at 50% inhibition, [P]0 is the concentration of the free protein at 0% inhibition, Kd represents the dissociation constant of the FITC-ATRIP-RPA70N complex.
HTS assay development and optimization
FITC-ATRIP was used at 500, 250 and 50 nM with 3 and 6 μM RPA70N in a total of 50 μL assay buffer, in 24 wells/condition in 96-well plates. The plate was mixed on a shaker for 15 minutes and incubated at room temperature for 1 hour to reach equilibrium. Emission anisotropy measurements were performed as for the direct binding experiments. The Z’ factor was calculated based on the following equation [18]:
where σf and σb are the standard deviation of the emission anisotropy for free (FITC-ATRIP alone) and bound (FITC-ATRIP + RPA70N) probe, respectively. Ub and Uf are the mean of the emission anisotropy of the bound and free probe, respectively. The optimized conditions (50 nM FITC-ATRIP, 6 μM RPA70N) were repeated in 384-well plates, in a total volume of 40 μL assay buffer in 48 wells/condition.
Increasing amounts of DMSO (2.5, 5 and 10%) were added to increasing concentrations of RPA70N (0 – 50 μM) and 50 nM FITC-ATRIP. The plate was mixed on a shaker for 15 minutes and incubated at room temperature for 1 hour. Emission anisotropy was measured and the data processed as described above for Kd determination.
The unlabeled ATRIP and p53 peptides were used in the competition assay (described above); 100 μM of competitor peptide was added to the assay mix (24 wells/condition, including controls) and emission anisotropy was measured. Z’ for the controls was calculated as described above.
High Throughput Screening
The SPECTRUM collection (Microsource Discovery Systems Inc.) of 2000 compounds was distributed into seven 384-well plates. 40 nL of compound was dispensed into a well using the ECHO 555 (Lab Labcyte), to which 6 μM RPA70N and 50 nM FITC-ATRIP in assay buffer were added to give a compound concentration of 10 μM in 0.01% DMSO with a total volume of 40 μL. Columns 1 and 24 of the plate contained 40 μL of 50 nM FITC-ATRIP alone, as a positive control (32 total wells) while columns 2 and 23 contained 40 μL of 6 μM RPA70N and 50 nM FITC-ATRIP in assay buffer (32 total wells) as a negative control. Plates were incubated at room temperature for 20 minutes prior to reading on the EnVision for both total fluorescence and emission anisotropy. Total fluorescence values were used to identify compounds with the ability to directly interfere with the assay. Assay performance was assessed by calculating a Z’ factor, as described above, from the controls present on each plate.
Concentration response curves
Compounds were diluted in DMSO in a 10-point, 2-fold serial dilution scheme with a final assay concentration range of 500 – 0.5 μM. Compound was added to 50 nM FITC-ATRIP, 6 μM RPA70N in assay buffer to give a final volume of 50 μL and 5% DMSO. Emission anisotropy was measured and plotted against compound concentration to generate an IC50 value using a four-parameter fit, as above. IC50 values were converted to Kd values, as described above.
Results and Discussion
Identification of a FITC-ATRIP peptide as a suitable probe for the RPA70N basic cleft
Previous studies using NMR spectroscopy have shown that peptides derived from ATRIP, RAD9, MRE11, and p53 interact with the basic cleft of RPA70N [4; 19]. To identify a probe suitable for detecting disruption of this binding interface, we first determined the affinities of these peptides for RPA70N using NMR titration studies (Table 1). The ATRIP-derived sequence binds more tightly to RPA70N (Kd = 48 μM) than the RAD9 (Kd = 78 μM), MRE11 (Kd = 100 μM), and p53 (Kd = 102 μM) peptides, and was thus selected for use in the fluorescence polarization assay.
Table 1.
Peptide Binding Affinities by NMR and Fluorescence Polarization Assay
| Peptide | Sequence | (μM) | ||
|---|---|---|---|---|
| Kd (NMR)b | Kd (FPA) | IC50 (FPA) | ||
| ATRIPa | Ac-DFTADDLEELDTLAS-HN2 | 47.6 ± 1.0 | 28.6 ± 3.1 | 52.7 ± 1.2 |
| RAD9a | Ac-DFANDDIDSYMIAME-HN2 | 77.9 ± 0.4 | 51.4 ± 8.9 | 102.1 ± 13.6 |
| MRE11a | Ac-AFSADDLMSIDLAEQ- NH2 | 100.0 ±0.1 | 65.8 ± 23.7 | 120.5 ± 39.0 |
| p53a | Ac-MLSPDDIEQWFTEDP-HN2 | 101.5 ± 0.4 | 99.9 ± 8.4 | 183.3 ± 9.9 |
| FITC-ATRIP | FITC-DFTADDLEELDTLAS-HN2 | 15.2 ± 2.0 | 6.4 ± 1.1 | - |
The IC50 values obtained from competitive assays to monitor the inhibition of the binding of 50nM ATRIP-FITC to 6μM RPA70N. IC50 values were converted into Kd values.
CSPs of several protein resonances were used to calculate NMR standard deviations.
We verified that a fluorescein-labeled ATRIP (FITC-ATRIP) peptide binds to the RPA70N cleft in the same manner as the unlabeled peptide by using 1H,15N-HMQC spectra of 40 μM RPA70N in the presence of 50 μM of either unlabeled ATRIP or FITC-ATRIP peptide. As shown in Figure 1A, both peptides induce a very similar pattern of chemical shift perturbations (CSPs) of protein peaks. Weak or no shifts were observed for resonances outside of the basic cleft, consistent with a single binding site with negligible non-specific interactions. These results indicate an identical binding mode for both the labeled and unlabeled peptides. NMR-based titration experiments revealed that the FITC-ATRIP-induced RPA70N shifts are dose-dependent and provided a dissociation constant of 15 μM. A higher protein affinity of FITC-ATRIP compared to unlabeled ATRIP was revealed by stronger CSPs (Fig. 1A & B). Indeed, several peaks of RPA70N (e.g. G90, Fig. 1A, see inset) are broadened upon addition of the FITC-ATRIP peptide due to intermediate exchange (on the NMR chemical shift time scale) of bound and unbound states. Although the reason for this improved binding affinity is unknown, the increase may be due to additional interactions with the protein mediated by the modified peptide, either through the hydrophilic FITC moiety or the aliphatic Ahx linker. This hypothesis is consistent with the structure of the p53/RPA70N complex, which reveals a basic patch on the surface of RPA70N that would be available for additional interactions with the FITC moiety when the peptide is bound.
Fig. 1.
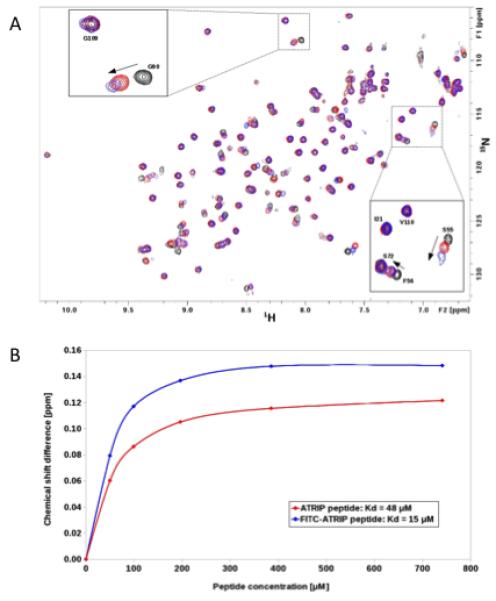
FITC-ATRIP binds to the basic cleft of RPA70N. (A) Overlay of 1H,15N-HMQC spectra of 15N enriched RPA70N (black), RPA70N + ATRIP peptide (red), and RPA70N + FITC-ATRIP peptide (blue). (B) Titration curves for the ATRIP (red) and FITC-ATRIP peptides (blue). Proton chemical shift differences of residue G90 upon stepwise increase in peptide concentration were used to calculate Kd values.
Finally, we monitored the NMR signals of the FITC-ATRIP peptide in the absence of protein to rule out misleading binding effects caused by self-aggregation or precipitation. All resonances increased in a dose-dependent manner without changing their chemical shifts (data not shown), demonstrating that the peptide is well behaved over the concentrations (50-741 μM) used in the NMR assay.
Determination of FITC-ATRIP Kd by FPA
A direct binding experiment was conducted to determine the dissociation constant (Kd) for the binding of the FITC-ATRIP probe to RPA70N using the FPA assay format. Increasing concentrations of RPA70N were added to 50 nM FITC-ATRIP peptide, and the resulting anisotropy was measured. The data was fit to a single-site binding model to give a Kd of 6.4 μM (Fig. 2), consistent with the NMR-derived value (Table 1). As expected, the emission anisotropy of the unbound probe is low (~50) and increases to ~190 upon binding to RPA70N, providing a robust signal window for the development of an assay and the detection of compounds that interfere with this binding.
Fig. 2.
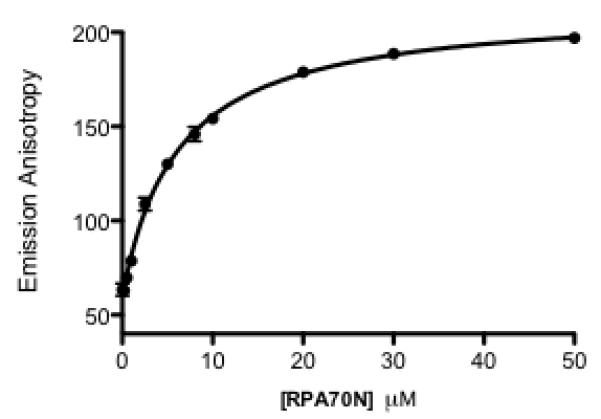
Determination of FITC-ATRIP Kd. Binding isotherm of the fluorescent FITC-ATRIP to RPA70N. The fluorescence emission polarization values are plotted against RPA70N concentration.
Competition Displacement Experiments
A competition experiment was conducted to determine the binding efficiency of the unlabeled ATRIP, RAD9, MRE11, and p53 peptides in the FPA assay format. Increasing concentrations of competitor peptide were added to 500 nM FITC-ATRIP and 6 μM RPA70N in assay buffer, and the resulting emission anisotropy was measured. Data were fit to a four parameter logistic function using non-linear regression analysis to determine IC50 values (Fig. 3). For easier comparison to the NMR data, these IC50 values were converted to Kd. Similar to what was observed by NMR, ATRIP is the most potent inhibitor (Kd = 29 μM), followed by RAD9 (Kd = 51 μM), MRE11 (Kd = 66 μM), and p53 (Kd = 102 μM) (Table 1). The FITC-ATRIP probe is displaced by the endogenous partners of RPA, suggesting that it is binding to the protein in a functionally relevant manner and that the assay can detect inhibitors of this binding interface. Additionally, given the range of measured IC50 values, this experiment also suggests that the assay can detect weakly bound inhibitors, making it suitable for triaging compounds identified from fragment-based drug discovery efforts.
Fig. 3.
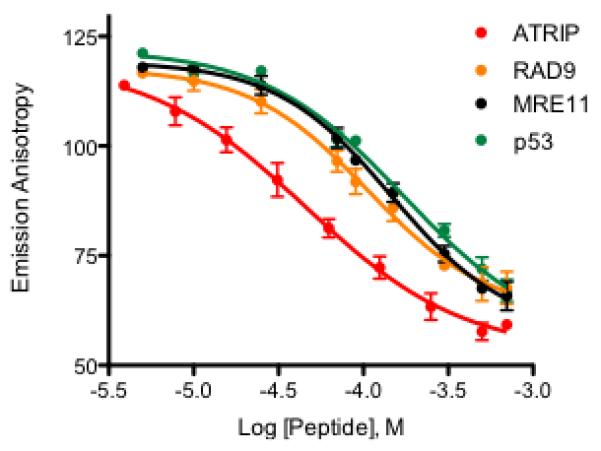
Competitive inhibition of FITC-ATRIP binding by different peptides. Displacement of FITC-ATRIP peptide from RPA70N by ATRIP (red), RAD9 (orange), MRE11 (black), and p53 (green).
FPA Assay Development, Optimization, and Validation
Typical conditions for fluorescence binding assays contain a ratio of protein concentration to probe Kd close to one [17; 18; 20]. The probe concentration can be optimized to give a strong emission polarization signal window and enough probe fluorescence to overcome interference from weakly fluorescent compounds. To find the optimum assay conditions, we varied the FITC-ATRIP probe concentration (25, 50, 500 nM) and the RPA70N protein concentration (3 μM and 6 μM), measured the emission anisotropy, and assessed the Z’ factor for each set of conditions (Fig. 4A). At 3 μM RPA70N (0.5x Kd), lower Z’ values were obtained for all FITC-ATRIP probe concentrations, demonstrating lower assay performance at this protein concentration. However, at 6 μM RPA70N (1x Kd), the Z’ values indicated excellent assay performance, especially for the higher FITC-ATRIP concentrations (Z’ > 0.7). The assay performance was stable over time as equally robust Z’ values were obtained upon measuring emission anisotropy after a 24-hour incubation period. We therefore chose 50 nM FITC-ATRIP and 6 μM RPA70N as our assay conditions. These optimized conditions were repeated, in a 384-well plate at lower volumes to be more compatible with typical HTS requirements (Fig. 4B); the large assay window and the highly consistent data points are reflected in the Z’ factor (0.76) in this plate format. Since most screening libraries use DMSO as the compound solvent, we examined the DMSO tolerance of the assay. Over a range of DMSO concentrations (0 - 10%), we saw only a small change in the measured Kd values (data not shown).
Fig. 4.
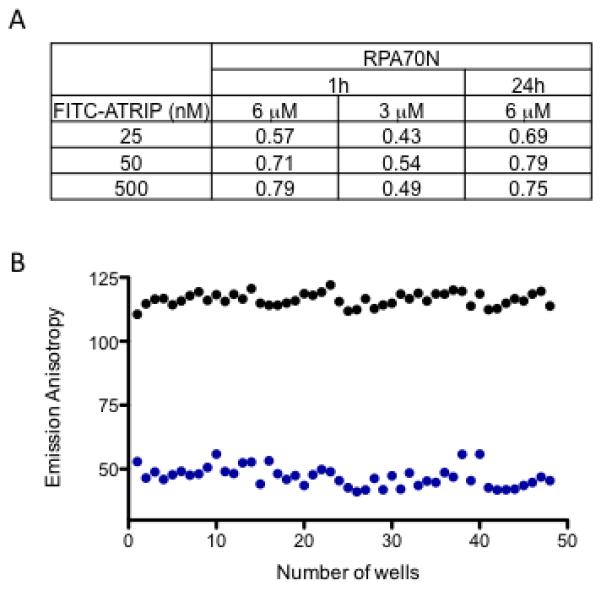
Optimization of assay conditions. (A) Z’ factor determination using different concentrations of RPA70N and FITC-ATRIP. Z’ factor were calculated using two concentrations of RPA70N (6 and 3uM) as a function of three different concentrations of FITC-ATRIP (25, 50, 500 nM) at 1 and 24h to evaluate performance of the fluorescence polarization assay; (B) Optimized conditions were repeated in a 384 well format. The average anisotropy values from free peptide control (blue) and bound peptide control (black) were obtained from 48 wells to calculate the Z’ factor.
We used the control peptides as further validation of the assay’s ability to detect known ligands and weakly bound inhibitors. We selected the least potent (p53, Kd = 100 μM) and the most potent (ATRIP, Kd = 48 μM), peptides and used them in the assay at a single concentration of 100 μM (Fig. 5). As can be seen, the mean values of the two peptides are easily distinguished from control wells. Indeed, at a single test concentration of 100 μM, ligands with an IC50 of 100 μM will cause a probe displacement of 50%, allowing detection of hits and giving a low false positive rate. Inhibitors as weak as 400 μM are expected to produce a probe displacement of 20%, which is still within the detectable range of the assay.
Fig. 5.
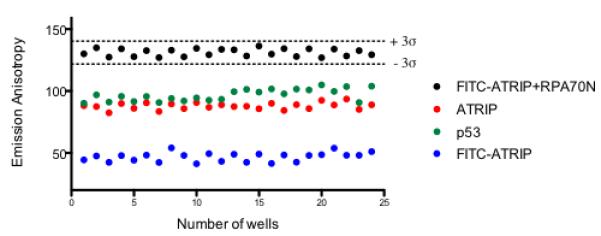
Assay can detect weak ligands at a single test concentration. A scatter plot for a test plate containing peptides. Each 96-well plate contained 24 wells with the unlabeled ATRIP peptide (red) and 24 wells with the p53 peptide (green). Reproducibility of FITC-ATRIP with RPA70N (black) and in the absence of protein control (blue) are represented; dashed lines represent +/− 3σ.
Assay Performance
The 2000 compound SPECTRUM collection (MicroSource, Discovery Systems, Inc) was used to evaluate the assay performance under HTS conditions. This assay validation set contains natural products, marketed and experimental drugs, and bioactive molecules with a wide range of biological activities and structural diversity. Compounds were screened at a single concentration of 10 μM, and plates were read for total fluorescence and emission anisotropy. The Z’ factor was calculated from the control wells present on each plate and was found to be ≥0.76 for all of the assayed plates.
Although anisotropy is a ratiometric measurement, strongly fluorescent or quenching compounds have the potential to adversely affect anisotropy measurements [21]. Turek-Etienne and collaborators [22] have demonstrated that high values of total fluorescence and low millipolarization (mP) values are associated with fluorescent compounds and can adversely affect FPA assays. To rule out these interfering compounds, we measured the total fluorescence of all control and compound-containing wells and calculated the mean control fluorescence for the FITC-ATRIP+RPA70N samples. Eight compounds were identified that increased sample fluorescence >25% of the control mean (Fig. 6A, green circles) and correspondingly gave a false decrease in emission anisotropy (Fig. 6B, green circles). Although these compounds appear as hits by emission anisotropy, they are easily identified as fluorescent compounds by the total fluorescence reading and are therefore easily flagged. Similarly, 4 compounds were identified that decreased total fluorescence <25% of control mean (Fig. 6A, blue circles) while giving an apparent increase in emission anisotropy (Fig. 6B, blue circles). These compounds were classified as quenchers and similarly flagged.
Fig. 6.
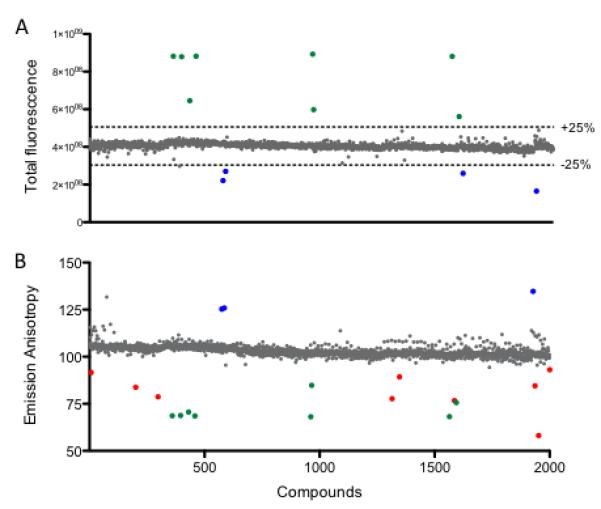
High-throughput screening (HTS) of Spectrum collection. (A) Total fluorescence intensity values for the 2000 compounds. Fluorescent compounds (>25% increase in total fluorescence; green) and potential quenchers (>25% decrease in total fluorescence; blue) are easily detected by measuring the total fluorescence. (B) Emission Anisotropy of the 2000 compounds screened at 10 μM to identify inhibitors. True hits (red), as well as the previously identified fluorescent compounds (green) and potential quenchers (blue) are shown.
Upon removal of the interfering compounds, 9 compounds (0.45% hit rate) were identified as hits, decreasing anisotropy >3 standard deviations from the control mean (Fig. 6B, red circles). Of these, three were selected for further analysis in concentration response experiments to determine their IC50 and Kd values. Compounds 1, 4, and 7 displayed concentration-dependent decreases in anisotropy (Fig. 7A) leading to Kd values of 19, 23, and 21 μM, respectively (Fig. 7C). We also tested the literature compound NSC15520 (Fig. 7B), recently reported to be a direct competitor for Rad9 binding to RPA70N [6]. This compound was initially discovered using a more complex, ELISA-based assay. Using our FPA assay, we obtained a Kd value of 18 μM, consistent with the reported value (Fig. 7C). Therefore, the assay was able to confirm a previously described inhibitor and to discover additional compounds with similar affinities.
Fig. 7.
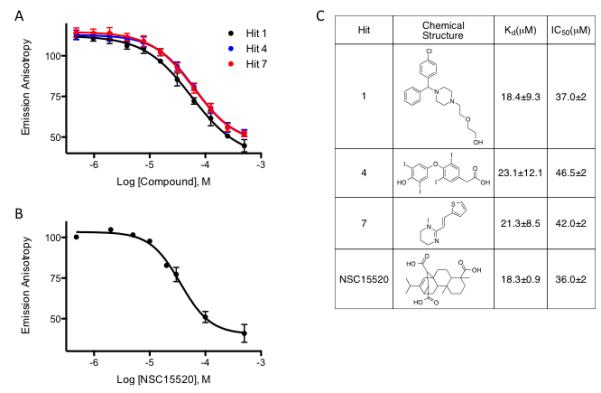
IC50 determination for compounds identified from the Spectrum collection. Concentration-response experiments for Kd determination of three hits (A): Hit 1, Hit 4 and Hit 7 or (B) NSC15520. The error bars represent standard deviation of two independent experiments, performed in duplicate. (C) Structure, IC50 values, and calculated Kd values for the hits obtained in comparison with the literature compound.
Conclusions
We have developed a robust, homogenous FPA-based assay to identify compounds that disrupt binding of a labeled ATRIP peptide to the basic cleft of RPA70N. The assay is simple to run, low-cost and rapid, and is thus an attractive alternative to previously published assays used to detect RPA70N inhibitors [6]. The FPA assay is solution-based and uses a peptide demonstrated to mimic the natural protein binding partners [4]. The suitability of the assay for high throughput screening was demonstrated using a set of diverse compounds at a single concentration to displace the probe peptide. Compounds were identified that have affinities comparable to the literature compounds.
Acknowledgements
This work was supported, in part, by the US National Institutes of Health: 5DP1OD006933 (NIH Director’s Pioneer Award) to S.W.F., an ARRA stimulus grant 5RC2CA148375 to L.J. Marnett, R01GM065484 and PO1CA092584 to W.J.C., 5P0CA098131 (NCI SPORE in Breast Cancer) to C.L. Arteaga, and 5T32ES7028-37 (Training Program in Environmental Toxicology) to M.D.F. This work was also supported by a fellowship from the National Council for Scientific and Technological Development – CNPq and Federal University of Minas Gerais/Brazil to E.M.d.S.-F. and a fellowship from the German Academic Exchange Service (DAAD) Postdoctoral Program to A.O.F.
Footnotes
Publisher's Disclaimer: This is a PDF file of an unedited manuscript that has been accepted for publication. As a service to our customers we are providing this early version of the manuscript. The manuscript will undergo copyediting, typesetting, and review of the resulting proof before it is published in its final citable form. Please note that during the production process errors may be discovered which could affect the content, and all legal disclaimers that apply to the journal pertain.
References
- [1].Wold MS. Replication protein A: A heterotrimeric, single-stranded DNA-binding protein required for eukaryotic DNA metabolism. Annu. Rev. Biochem. 1997;66:61–92. doi: 10.1146/annurev.biochem.66.1.61. [DOI] [PubMed] [Google Scholar]
- [2].Fanning E, Klimovich V, Nager AR. A dynamic model for replication protein A (RPA) function in DNA processing pathways. Nucleic Acids Res. 2006;34:4126–4137. doi: 10.1093/nar/gkl550. [DOI] [PMC free article] [PubMed] [Google Scholar]
- [3].Cimprich KA, Cortez D. ATR: an essential regulator of genome integrity. Nat. Rev. Mol. Cell Biol. 2008;9:616–627. doi: 10.1038/nrm2450. [DOI] [PMC free article] [PubMed] [Google Scholar]
- [4].Cortez D, Xu X, Vaithiyalingam S, Glick GG, Mordes DA, Chazin WJ. The Basic Cleft of RPA70N Binds Multiple Checkpoint Proteins, Including RAD9, To Regulate ATR Signaling. Mol. Cell. Biol. 2008;28:7345–7353. doi: 10.1128/MCB.01079-08. [DOI] [PMC free article] [PubMed] [Google Scholar]
- [5].Ball HL, Ehrhardt MR, Mordes DA, Glick GG, Chazin WJ, Cortez D. Function of a conserved checkpoint recruitment domain in ATRIP proteins. Mol. Cell. Biol. 2007;27:3367–77. doi: 10.1128/MCB.02238-06. [DOI] [PMC free article] [PubMed] [Google Scholar]
- [6].Oakley GG, Glanzer JG, Liu SQ. Small molecule inhibitor of the RPA70 N-terminal protein interaction domain discovered using in silico and in vitro methods. Bioorg. Med. Chem. 2011;19:2589–2595. doi: 10.1016/j.bmc.2011.03.012. [DOI] [PMC free article] [PubMed] [Google Scholar]
- [7].Bartek J, Bartkova J, Horejsi Z, Koed K, Kramer A, Tort F, Zieger K, Guldberg P, Sehested M, Nesland JM, Lukas C, Orntoft T, Lukas J. DNA damage response as a candidate anti-cancer barrier in early human tumorigenesis. Nature. 2005;434:864–870. doi: 10.1038/nature03482. [DOI] [PubMed] [Google Scholar]
- [8].Arkin MR, Wells JA. Small-molecule inhibitors of protein-protein interactions: Progressing towards the dream. Nat. Rev. Drug Discovery. 2004;3:301–317. doi: 10.1038/nrd1343. [DOI] [PubMed] [Google Scholar]
- [9].Hajduk PJ, Greer J. A decade of fragment-based drug design: strategic advances and lessons learned. Nat. Rev. Drug Discovery. 2007;6:211–219. doi: 10.1038/nrd2220. [DOI] [PubMed] [Google Scholar]
- [10].Shuker SB, Hajduk PJ, Meadows RP, Fesik SW. Discovering high-affinity ligands for proteins: SAR by NMR. Science. 1996;274:1531–1534. doi: 10.1126/science.274.5292.1531. [DOI] [PubMed] [Google Scholar]
- [11].Hajduk PJ, Sheppard G, Nettesheim DG, Olejniczak ET, Shuker SB, Meadows RP, Steinman DH, Carrera GM, Marcotte PA, Severin J, Walter K, Smith H, Gubbins E, Simmer R, Holzman TF, Morgan DW, Davidsen SK, Summers JB, Fesik SW. Discovery of potent nonpeptide inhibitors of stromelysin using SAR by NMR. J. Am. Chem. Soc. 1997;119:5818–5827. [Google Scholar]
- [12].Lakowicz JR. Principles of Fluorescence spectroscopy. Springer; 2006. [Google Scholar]
- [13].Brutscher B, Schanda P, Kupce E. SOFAST-HMQC experiments for recording two-dimensional heteronuclear correlation spectra of proteins within a few seconds. J. Biomol. NMR. 2005;33:199–211. doi: 10.1007/s10858-005-4425-x. [DOI] [PubMed] [Google Scholar]
- [14].Wang ZX. An Exact Mathematical Expression for Describing Competitive-Binding of 2 Different Ligands to a Protein Molecule. FEBS Lett. 1995;360:111–114. doi: 10.1016/0014-5793(95)00062-e. [DOI] [PubMed] [Google Scholar]
- [15].Wang ZX, Jiang RF. A novel two-site binding equation presented in terms of the total ligand concentration. FEBS Lett. 1996;392:245–249. doi: 10.1016/0014-5793(96)00818-6. [DOI] [PubMed] [Google Scholar]
- [16].Buchli R, VanGundy RS, Hickman-Miller HD, Giberson CF, Bardet W, Hildebrand WH. Development and validation of a fluorescence polarization-based competitive peptide-binding assay for HLA-A*0201 - A new tool for epitope discovery. Biochemistry. 2005;44:12491–12507. doi: 10.1021/bi050255v. [DOI] [PubMed] [Google Scholar]
- [17].Nikolovska-Coleska Z, Wang R, Fang X, Pan H, Tomita Y, Li P, Roller PP, Krajewski K, Saito NG, Stuckey JA, Wang S. Development and optimization of a binding assay for the XIAP BIR3 domain using fluorescence polarization. Anal. Biochem. 2004;332:261–73. doi: 10.1016/j.ab.2004.05.055. [DOI] [PubMed] [Google Scholar]
- [18].Macarron R, Hertzberg RP. Design and implementation of high throughput screening assays. Mol. Biotechnol. 2011;47:270–85. doi: 10.1007/s12033-010-9335-9. [DOI] [PubMed] [Google Scholar]
- [19].Ball HL, Myers JS, Cortez D. ATRIP binding to replication protein A-single-stranded DNA promotes ATR-ATRIP localization but is dispensable for Chk1 phosphorylation. Mol. Biol. Cell. 2005;16:2372–81. doi: 10.1091/mbc.E04-11-1006. [DOI] [PMC free article] [PubMed] [Google Scholar]
- [20].Dalvit C. NMR methods in fragment screening: theory and a comparison with other biophysical techniques. Drug Discov. Today. 2009;14:1051–7. doi: 10.1016/j.drudis.2009.07.013. [DOI] [PubMed] [Google Scholar]
- [21].Kusba J, Bogdanov V, Gryczynski I, Lakowicz JR. Theory of Light Quenching - Effects on Fluorescence Polarization, Intensity, and Anisotropy Decays. Biophys. J. 1994;67:2024–2040. doi: 10.1016/S0006-3495(94)80686-1. [DOI] [PMC free article] [PubMed] [Google Scholar]
- [22].Turek-Etienne TC, Small EC, Soh SC, Xin TPA, Gaitonde PV, Barrabee EB, Hart RF, Bryant RW. Evaluation of fluorescent compound interference in 4 fluorescence polarization assays: 2 kinases, 1 protease, and 1 phosphatase. J. Biomol. Screening. 2003;8:176–184. doi: 10.1177/1087057103252304. [DOI] [PubMed] [Google Scholar]