

Abstract
Intraurban differentials in safe drinking water in developing cities have been exacerbated by rapid population growth that exceeds expansion of local water infrastructure. In Accra, Ghana, municipal water is rationed to meet demand, and the gap in water services is increasingly being filled by private water vendors selling packaged “sachet” water. Sachets extend drinking water coverage deeper into low-income areas and alleviate the need for safe water storage, potentially introducing a health benefit over stored tap water. We explore correlates of using sachets as the primary drinking water source for 2,093 women in 37 census areas classified as slums by UN-Habitat, and links between sachet water and reported diarrhea episodes in a subset of 810 children under five. We find that neighborhood rationing exerts a strong effect on a household's likelihood of buying sachet water, and that sachet customers tend to be the poorest of the poor. Sachet use is also associated with higher levels of self-reported overall health in women, and lower likelihood of diarrhea in children. We conclude with implications for sachet regulation in Accra and other sub-Saharan cities facing drinking water shortages.
Keywords: sachets, drinking water, poverty, diarrhea, sub-Saharan Africa
Introduction
The United Nations annually coordinates World Water Day to focus attention on the importance of freshwater and sustainable management of freshwater resources. Despite global efforts, nearly one billion people still lack safe sources of drinking water, over a third of whom live in sub-Saharan Africa where progress has been particularly slow. While 97% of urban residents in developing nations had access to some improved drinking water source by 2006, over 137 million urban residents still lack improved drinking water. The Millennium Development Goal (MDG) targets for halving the population without sustainable access to safe water and basic sanitation, and for achieving a significant improvement to the lives of slum dwellers (Goal 7, targets 10 and 11) may not be met in sub-Saharan Africa (United Nations Development Programme, 2006) where over 60% of urban dwellers live in slum conditions (United Nations, 2008). In some urban areas, increased coverage of water and sanitation services has been outstripped by population growth and the number of unserved people may be increasing (International Development Committee, 2007; United Nations Development Programme, 2006; WHO/UNICEF, 2000). On any given day, almost half the people in the developing world are suffering from one or more of the main diseases associated with inadequate water and sanitation services (United Nations Millennium Project, 2005).
Ghana receives enough rainfall that no community should experience water shortages. Yet despite those abundant water resources, Ghana experiences chronic water shortages due to uneven distribution of rainfall, prolonged drought and poor water resource management (Nsiah-Gyabaah, 2001). Drinking water sources are often polluted due to insufficient sanitation infrastructure and frequent cross-contamination with human and animal waste. The Ghana Water Company Ltd. (GWCL) has been unable to supply enough water to meet both household and commercial consumption demands; the resulting deficiency in water quantity and quality has slowed improvements to urban population health. The gap between population demand for clean water and its supply to urban residents is increasingly being met by private firms selling so-called sachet water, and our objective in this paper is to explore the link between health and the use of sachet water.
Drinking water rationing in Accra
Ghana's municipal water history dates back to 1928 when the first pipes were laid in the former capital city, Cape Coast (see Dreschel and Van-Rooijen, 2008 for a detailed summary). Today Accra's public water services are supplied by two GWCL water treatment plants on the eastern and western peripheries (Kpong and Weija Waterworks, respectively) of the Accra Metropolitan Area, but the city has grown well beyond the plants' capacities. GWCL is unable to provide water to all of Accra due to production and distribution limits, continued population growth without urban planning, and non-revenue water (NRW) losses which weaken the utility further. Subsequent water rationing and low quality ad hoc storage systems leave large portions of the population without adequate potable water. Although GWCL's service coverage is 80%, less than half of citizens have a house or yard connection (Van-Rooijen et al., 2008), and less than 10% have a reliable in-house connection (Taylor et al., 2002). Most people are dependent upon water vendors when lacking a nearby connection or when rationing diverts water to higher-income neighborhoods. In Accra, where residents are already paying four times more for water by volume than New Yorkers, slum residents are paying vendors up to eight times the local public utility prices (United Nations Development Programme, 2006), and up to twenty times in dry periods (Taylor et al., 2002). Barriers to connecting to the water network, such as high capital costs and lack of property rights in informal settlements, exacerbate inequalities in water network access: connection rates in Accra average 90% in high-income areas and 16% in low-income settlements (Collignon and Vézina, 2000). The GWCL mandate to reduce NRW also widens inequalities, as the contracted operator Aqua Vitens Rand Limited (AVRL) is evaluated based on its ability to convert consumers into billable customers. Customers become more willing to pay when they receive more reliable water access, so billable customers tend to receive the best water rations and vice versa; rationing thus becomes intertwined in a self-perpetuating cycle of poverty and inability to pay for regular water service.
Water rationing began in Accra in the 1980s when water demand first exceeded supply, as Accra's water supply infrastructure has not been significantly expanded to accommodate population growth. Water rationing commenced as a stopgap measure to ensure that most residents of Accra would have access to some quantity of water. Initially rationing was instituted in the Accra-Tema Metropolitan Area by GWCL's thirteen water districts (administrative units responsible for maintenance, billing, and customer care), but it is currently implemented at smaller geographic units that are delineated from the water distribution network by district managers (see Figure 1). GWCL water districts essentially compete for water, as district performance is assessed by total monthly customer billings for water services, which partly determines NRW. Willingness-to-pay and billability of customers is strongly influenced by the level of service and customer expectations, as previously demonstrated empirically (Hensher et al., 2005), but as Figure 1 indicates, water service remains quite variable in Accra. The rationing regime operates on a graduated scale ranging from supply at certain hours of the day to a certain number of days per week. The over-arching water delivery strategy is determined by distribution and district managers with the help of the GWCL Geographic Information Systems (GIS) Office, and decisions are based on the pressure in the mains and the size and elevation of the neighborhoods involved. The interplay between household billability and local “infrastructure ecology” creates this geographic variability in water delivery, and sometimes creates spatial mismatches between supply and neighborhood demographics. Any societal effects of water rationing would therefore be expected to vary by neighborhood as well. The rationing program is generally only reviewed when water supply is affected by maintenance or expansion of either of the two water treatment facilities.
Figure 1.

Variation in mean days per week of running water in the Accra-Tema Metropolitan Area by water district as recorded by Ghana Water Company Ltd. in July 2009. The delineated Accra Metropolitan Area is the focus of this study.
Rationing itself is a purely mechanical activity that involves the throttling of butterfly valves designated as “rationing valves.” Each district assigns a distribution supervisor to manually manage valves according to the rationing schedule, though there are several obstacles to proper implementation. Limited staff at the district level often results in slack supervision of distribution supervisors, and valve management is not always timely. Common power outages and maintenance activities adversely impact effective implementation of the rationing schedule by disrupting pumps and downstream water supply. Informal filling stations for private, packaged water are often unaccounted for in the rationing plan, and can adversely affect water pressure downstream in the distribution network. GWCL and individual water districts therefore often have to rely on customer complaints to normalize the schedule. There is also substantial political interference in this process, as every Member of Parliament lobbies to optimize water supply for constituents in order to gain electoral advantage. Despite these obstacles, the current rationing procedure remains the best known way to manage Accra's limited water resources. Future capital investments, perhaps fueled by new oil revenues in the Gulf of Guinea, may eventually drive the expansion of water production and distribution infrastructure to catch up with water demand. In the meantime GWCL is creating new hydraulic models of the water distribution network that integrate flow, pressure, elevation, and population data to create a more scientific rationing schedule and enable more equitable distribution of water.
Sachet water
Where lack of infrastructure and/or rationing have left a void, entrepreneurial water vendors have stepped in to sell water either straight from their tap (filling jerrycans, etc.), or packaged as sachets with varying degrees of filtration or disinfection. The booming sachet water industry diverts an unknown quantity of water from the municipal system, but effectively extends improved water coverage deeper into informal settlements and slums, and alleviates the need in those places for a method of safely storing drinking water.
Sachet water typically consists of 500 ml plastic bags of water that are heat-sealed on either end. Popularly referred to as “pure water,” sachets have gained public affinity due to low price (∼US$0.03), convenience, ubiquity, and the perception of higher quality versus tap water. Sachets are also notorious for constituting a major proportion of the plastic waste generated throughout the country, as consumers typically litter the plastic sleeves in streets and gutters due to lack of organized solid waste removal. Clogged gutters cause flooding during the rainy seasons, which leads to subsequent loss of property and localized bouts of waterborne illness. Despite the adverse environmental impact, sachet distribution has become an important channel of drinking water acquisition for much of Western Africa's urban poor, and particularly in Accra.
Previous research into the transformation of drinking water delivery in developing urban centers such as Accra has focused on commodification of water (McDonald and Ruiters, 2005) and private sector participation at the institutional level (Bakker et al., 2008; Nickson, 1997). There has been little study of how privatized, packaged water such as sachets is changing the need for and attention to safe storage practices. The health benefits of safe storage and higher-quality drinking water are well known (Clasen and Cairncross, 2004; Wright et al., 2004), as are socio-demographic and behavioral correlates of water quality (McGarvey et al., 2008) and child diarrhea (Boadi and Kuitunen, 2005) in Ghana, but the mass shift toward packaged ready-to-drink water may effectively eliminate storage and cross-contamination risks. This potential unintended consequence has been ignored by policy experts, as the word sachet itself does not appear in the United Nations' recent 440-page Human Development Report focusing on global water crises (United Nations Development Programme, 2006).
Hypotheses
This paper explores socio-economic predictors of sachet water use in some of Accra's poorest communities, the link between sachets and the GWCL water rationing program, and the serendipitous health benefit derived from sachet water. We present data on primary drinking water sources and expenditures for households in Accra's low-income neighborhoods from a Housing and Well-being Survey (HAWS) that are contextualized by in-depth interviews from several households. The literature on water privatization and water storage, and Accra's uneven growth in sachet consumption in response to GWCL NRW priorities suggest that the poorest in Accra may be pressed to buy sachet water despite its higher per-unit cost, yet may also derive some health benefit from drinking higher-quality water. We expect that the trend of higher sachet consumption seen broadly across Accra will especially be present within lower socio-economic slices of the population. Socio-economic status is operationalized by household measures such as quality of housing, access to basic services, and core daily expenditures. Because GWCL water rationing is enforced at the water district level, we expect that a household's drinking water options are significantly influenced by the degree of neighborhood rationing after controlling for individual and household differences. Because the risks for transmission of water-borne illness vary considerably with individual and household behavior, we expect an individual's neighborhood to have less influence on illness, operationalized as the number of reported diarrhea cases in children under five year of age, than household factors.
The specific hypotheses tested are: (1) urban slum residents enduring lower socioeconomic living standards are more likely to consume sachets, (2) slum residents experiencing greater water rationing in their neighborhood are more likely to choose sachets, and (3) children under five in sachet-using households are less likely to experience diarrhea in the previous two weeks. We also comment on the downside of the sachet phenomenon, including concerns about the waste created by empty sachets, and the issue of whether the existence of sachet (i.e. privatized) water undermines the demand for major water infrastructure improvements throughout the city.
Methods
This research draws upon primary data collected in 2009-2010 as part of the Housing and Welfare Study (HAWS) of Accra, Ghana. The HAWS survey is a representative household survey conducted by the Harvard School of Public Health and University of Ghana with assistance from San Diego State University. The sampling frame was modeled after a 2003 UN-Habitat study that focused on slum neighborhoods as a supplement to the 2003 Ghana Demographic and Health Survey (DHS). UN-Habitat operationally defines slums as areas that combine some or all of the following characteristics: (1) inadequate access to safe water, (2) inadequate access to sanitation and other infrastructure, (3) poor structural quality of housing, (4) overcrowding, (5) insecure residential status (United Nations Human Settlements Programme, 2003). The 2003 UN-Habitat study interviewed women in 42 randomly-selected enumeration areas (EAs) that met these slum criteria, five of which were located in Tema; the HAWS survey focused on the 37 EAs located within the Accra Metropolitan Area. All women aged 18 and older in 1,281 randomly selected households were interviewed between September 2009 and March 2010, resulting in a total sample size of 2,099 women. Although privacy issues prevented the HAWS project team from re-interviewing women from the 2003 UN-Habitat study, the intent was to mirror the populations of these slum communities. Slum communities have received higher-profile research interest ever since the UN Millennium Declaration included a Target under Millennium Development Goal 7: “By 2020, to have achieved a significant improvement in the lives of at least 100 million slum dwellers.”
Sampling design and survey instruments
The HAWS instrument consisted of separate household and individual questionnaires. The household questionnaire contained questions about household composition, economic characteristics, household possessions, and daily expenditures for various goods and services. The individual questionnaire contained detailed questions about a woman's socio-demographic characteristics, birth history, reproductive and child health, and nutrition. The questionnaires were largely built from existing DHS modules with additional unique sections such as voting patterns, property rights, and a detailed section on women's health.
Given that no recent sampling frame was available, all built structures and households (defined as a group of cohabitants sharing a common roof and typically eating together) in the 37 target EAs were listed between June and August 2009. After the listing, one out of every nine households was randomly selected to reach a targeted sample size of 1,800 women. For each selected household, surveyors collected household information and completed individual questionnaires for all women age 18 and over. Out of the 1,740 households selected, 292 (16.8%) had no eligible women (compared with 28.7% in the 2003 survey), and 167 (9.6%) refused, resulting in a final sample of 2,099 women in 1,281 households. Several cases were excluded from analysis due to miscoded or incomplete data, and the final sample size for analysis of hypotheses 1 and 2 included 2,093 women in 1,274 households in 37 EAs. For hypothesis 3, the final child sample included 810 children in 546 households in 36 EAs.
GWCL rationing program data were documented in July 2009 as representative of the rationing scheme for all of 2009. Rationing data are recorded by GWCL as point data and mapped in a GIS for institutional use as Thiessen polygons. The polygon layer was converted into a shapefile at the EA scale for direct comparison with EA-linked HAWS survey data.
Qualitative fieldwork
Before HAWS data collection ended, 32 households were revisited for a brief follow-up questionnaire about water acquisition, storage, and use. The follow-up was performed to provide qualitative context about the sachet phenomenon by testing the bacteriological quality of both source and stored water, and by conducting several in-depth interviews about water access. Water samples were collected from the household's drinking water storage vessel, and then from the tap where the water was collected; GPS coordinates were collected at both locations to compute distance for locations greater than 20 m (the maximum positional error of the GPS units at our study sites). Residual chlorine was analyzed in the field using a Hatch chlorimeter, and total and fecal coliform levels were determined via membrane filtration at the Council for Scientific and Industrial Research (CSIR) Water Research Institute (WRI) in Central Accra. The supplementary interviews were performed in a combination of English and Twi by HAWS staff familiar with the neighborhoods, and provided greater detail into the social and economic nuances of drinking water.
Institutional Review Board approval for all methods was granted by the respective boards of Harvard University, University of Ghana-Legon, and San Diego State University.
Statistical analysis and measures
We utilize multilevel modeling methods to analyze the links between the contextual effect of neighborhood, household-level measures, individual characteristics, and both sachet use and child illness. These methods also allow us to control for inherent correlations between individuals common to a household, and households common to an EA. These methods are well-established in health inequalities research (Curtis and Jones, 1998; Subramanian et al., 2003), as they help minimize ecological and atomistic fallacies while exploiting the hierarchical data structure (Greenland, 2000). We implement a random effects model using the GLIMMIX procedure in SAS 9.2 with parameters fitted to the EA and/or household as described below.
To test hypothesis 1, which postulates socioeconomic differences between those using sachets for their primary drinking water source vs. everyone else, we look at differences between the two groups on a variety of individual-, household-, and EA-level measures. The individual measures tested are age and ethnicity, which are both important factors considering the historical socio-spatial organization of Accra (Pellow, 2002), with sex accounted for by the sample. Several demographic and socioeconomic household measures are tested, including attributes of the dwelling, access to basic services, household composition and presence of children, an index of household possessions, and daily expenditures across several core categories. EA-level measures include days per week of water rationing (no piped water access) in the EA; mean elevation; and the land cover fraction for vegetation, impervious surfaces, and soil as classified from moderate-resolution ASTER imagery of Accra. The biophysical variables represent possible additional proxies for poverty, as previous work has demonstrated relationships between these land cover fractions and socioeconomic status in Accra (Stoler et al., 2011; Weeks et al., 2007). To assess overall differences between sachet users and non-users, chi-square tests are used to assess overall differences across groups of each categorical measure, and ANOVA is used to test for differences in the means of continuous measures.
For hypothesis 2 we test the effect of water rationing on choice of drinking water using a binary outcome variable to represent the use of sachets as the primary drinking water source vs. any other source (piped, tanker, well, borehole, rain, river, dugout, other).1 We initially introduce the individual, household, and EA level independent measures described above using a series of backward and forward stepwise logistic regression models. This exploratory process guides model-building by highlighting variables with the greatest explanatory power for sachet use, while also minimizing expected multicollinearity. A final multilevel model is generated by introducing covariates one-by-one with the rationing variable (i.e. the exposure of interest), and building the model that parsimoniously maximizes the higher-level covariance parameters in the multilevel logistic model of sachet use.
For hypothesis 3 we test the effect of using sachet water as the primary drinking water source on recent diarrhea prevalence among children. In this analysis, the binary dependent measure for sachet use from hypothesis 2 is used as an independent measure along with all of the other individual, household, and EA level independent measures described above. The outcome measure is whether or not a child was reported to have experienced diarrhea in the two weeks prior to the woman's individual questionnaire. We use the same exploratory and confirmatory modeling process as in hypothesis 2 to build the multilevel logistic model for child diarrhea using the sachet use measure as the exposure of interest.
Results
Sachet water and poverty
Table 1 presents the individual and household characteristics of women from the HAWS interviews, stratified by their primary source of drinking water, and Table 2 presents the overall mean EA-level characteristics. At the individual level, just less than half, 47 percent, use sachets as their primary drinking water source. These women are 3-4 years younger on average and more likely to be of Ga/Dangbe or Mole/Dagbani ethnicity; they are significantly less likely to be of Fante or Ewe ethnicity. The Fante are the largest and politically most powerful subgroup of the Akan speakers in Accra, while the Mole-Dagbani are predominantly Muslim immigrants from Ghana's Northern regions and may suffer many social disadvantages. The Gas constitute Accra's indigenous population, and are generally concentrated in coastal fishing villages. These ethnic differences in sachet use are the first signal that sachets may be associated with marginalization.
Table 1. Women's Individual and Household Characteristics Stratified by Primary Source of Drinking Water (Sachets or Other Source).
| Characteristic | Sachet Water | Other Water Source | ||
|---|---|---|---|---|
| Freq. | % or mean (95% CI) | Freq. | % or mean (95% CI) | |
| Individual characteristics (n = 2,093) | 982 | 46.9 | 1,111 | 53.1 |
| Ethnicity (%) *** | ||||
| Asante | 49 | 5.0 | 52 | 4.7 |
| Akwapim | 37 | 3.8 | 62 | 5.6 |
| Fante | 82 | 8.4 | 129 | 11.6 |
| Other Akan | 104 | 10.6 | 103 | 9.3 |
| Ga/Dangbe | 278 | 28.3 | 277 | 24.9 |
| Ewe | 92 | 9.4 | 144 | 13.0 |
| Mole/Dagbani | 146 | 14.9 | 56 | 5.0 |
| Other | 194 | 19.8 | 288 | 25.9 |
| Age (years) *** | 31.6 (30.7–32.4) | 35.1 (34.2–36.0) | ||
| Self-reported overall health (%)*** | ||||
| Fair or poor | 40 | 4.1 | 83 | 7.5 |
| Good | 350 | 35.6 | 664 | 59.8 |
| Very good | 417 | 42.5 | 276 | 24.8 |
| Excellent | 175 | 17.8 | 88 | 7.9 |
| Household (HH) characteristics (n = 1,274) | 638 | 50.1 | 636 | 49.9 |
| Type of dwelling (%) *** | ||||
| House, semi-detached, flat | 38 | 6.0 | 59 | 9.3 |
| Compound house | 475 | 74.5 | 553 | 86.9 |
| Hut, tent, kiosk, business, other | 125 | 19.6 | 24 | 3.8 |
| Source of lighting (%) | ||||
| Electricity | 59 | 9.2 | 57 | 9.0 |
| Gas, other, or none | 579 | 90.8 | 579 | 91.0 |
| Type of toilet access (%) | ||||
| WC or another house | 36 | 5.6 | 42 | 6.6 |
| KVIP or public toilet | 519 | 81.3 | 525 | 82.5 |
| Pit latrine, bucket/pan, other, none | 83 | 13.0 | 69 | 10.8 |
| Type of cooking fuel (%) ∼ | ||||
| Wood, gas, kerosene, other | 128 | 20.1 | 105 | 16.5 |
| Charcoal or nothing | 510 | 79.9 | 531 | 83.5 |
| Type of bathing facility (%) *** | ||||
| Own bathroom | 82 | 12.9 | 86 | 13.5 |
| Shared with other households | 359 | 56.3 | 440 | 69.3 |
| Cubicle, open space, other | 83 | 13.0 | 38 | 6.0 |
| River | 114 | 17.9 | 71 | 11.2 |
| Solid waste disposal (%) *** | ||||
| Collection service | 112 | 17.6 | 108 | 17.0 |
| Public dump | 409 | 64.1 | 487 | 76.6 |
| Burnt, buried, dumped elsewhere, other | 117 | 18.3 | 41 | 6.4 |
| Liquid waste disposal (%) *** | ||||
| Sewage system | 19 | 3.0 | 16 | 2.5 |
| Thrown in street or gutter | 463 | 72.6 | 520 | 81.8 |
| Thrown in compound or other | 156 | 24.5 | 100 | 15.7 |
| Number of girls age under 5 in HH (%) | ||||
| None | 494 | 77.4 | 487 | 76.6 |
| One or more | 144 | 22.6 | 149 | 23.4 |
| Number of boys age under 5 in HH (%) ∼ | ||||
| None | 510 | 79.9 | 480 | 75.5 |
| One or more | 128 | 20.1 | 156 | 24.5 |
| Number of girls age 5-18 in HH (%) *** | ||||
| None | 416 | 65.2 | 341 | 53.6 |
| One or more | 222 | 34.8 | 295 | 46.4 |
| Number of boys age 5-18 in HH (%) *** | ||||
| None | 470 | 73.7 | 370 | 58.2 |
| One or more | 168 | 26.3 | 266 | 41.8 |
| Sex of HH head (%) * | ||||
| Male | 323 | 50.6 | 356 | 56.4 |
| Female | 315 | 49.4 | 275 | 43.6 |
| Number of rooms *** | 1.45 (1.39–1.50) | 1.73 (1.64–1.81) | ||
| Possessions index | 3.62 (3.47–3.77) | 3.75 (3.62–3.89) | ||
| Daily expenditures (in Ghanaian cedis) | ||||
| Phone *** | 0.71 (0.62–0.79) | 1.00 (0.88–1.13) | ||
| Transportation | 0.90 (0.78–1.02) | 0.95 (0.85–1.06) | ||
| Drinking water *** | 0.49 (0.42–0.55) | 0.34 (0.30–0.38) | ||
| Other water * | 0.59 (0.49–0.68) | 0.86 (0.63–1.08) | ||
| Bathroom | 0.41 (0.33–0.49) | 0.61 (0.36–0.86) | ||
| Food | 8.02 (7.56–8.47) | 8.51 (8.02–9.01) | ||
| Cooking fuel *** | 0.61 (0.55–0.67) | 0.89 (0.81–0.98) | ||
| Monthly electricity expenditures | 7.69 (6.99–8.39) | 8.17 (7.48–8.86) | ||
| Sum of daily expenditures ** | 11.71 (11.12–12.30) | 13.18 (12.47–13.88) | ||
| % of daily expenditures spent on drinking water *** | 4.57 (4.16–4.98) | 2.91 (2.64–3.18) | ||
p < 0.10;
p < 0.05;
p < 0.01;
p < 0.001
Note: p-values for categorical measures are from χ2 test; p-values for continuous measure are from Welch F test of equality of means to account for variance heterogeneity
Table 2. Characteristics of 37 Enumeration Area Sampled by HAWS.
| Characteristic | Mean | SD |
|---|---|---|
| Days per week of water rationing (without piped water access) | 1.89 | 2.07 |
| Elevation (meters) | 19.58 | 13.77 |
| Vegetation land cover (%) | 1.71 | 3.34 |
| Impervious land cover (%) | 66.09 | 25.95 |
| Soil land cover (%) | 29.74 | 24.81 |
At the household level, half of households report sachet use, and these households contain about 12 percent fewer women than those reporting other primary drinking water sources (henceforth referred to as “non-sachet” households). Overall household access to basic services in this population is very low, as the vast majority of households live in compounds or informal housing, have no electricity and cook with charcoal, have only public or informal toilet and bathing facilities, and have neither waste collection services nor a sewer connection. Yet there is variation between the sachet-using and non-sachet households, and the prevailing theme in Table 1 is that the sachet-using households tend to have lower socioeconomic status than their non-sachet counterparts. The sachet-using households are more likely to live in the least-formal dwellings such as huts, tents, kiosks, or businesses (20 percent vs. 4 percent for non-sachet households); use inferior bathing facilities such as cubicles and open spaces (13 percent vs. 6) or a river (18 percent vs. 11); burn, bury or dump their solid waste (18 percent vs. 6); and throw liquid waste in the compound or home rather than in a gutter or sewer (25 percent vs. 16). Sachet-using households have slightly fewer rooms (1.5 vs. 1.7), and exhibit lower daily household expenditures for all core categories surveyed except for drinking water, which is driven by the higher unit cost of sachet water relative to piped water. There are no significant differences in the presence of children under 5 in the household, but sachet-using households are less likely to have boys or girls aged 5-18, and are more likely to have a female head-of-household. Overall, Table 1 offers strong evidence for hypothesis 1 by way of a profile of women from households that rely on sachet water as their primary drinking source: these individuals tend to be younger, from smaller households of lower-status ethnicities, and among the poorest of the poor in Accra's slums. The sole exception to this trend is that women reporting using sachet water tend to rate their overall health higher than those from non-sachet households; this perception of better health is unexpected amidst such an inauspicious socioeconomic profile, and could plausibly be attributed to better quality water or merely to the perception of such.
The 37 EAs experienced an average of two days (SD 2) of water rationing per week. Figures 2 and 3 show that the EAs with the highest degree of rationing also tend to be the neighborhoods with the highest reported sachet use, and both phenomena exhibit statistically significant positive spatial autocorrelation after computing Moran's I (I = 0.16, Z = 3.04 for rationing; I = 0.11, Z = 2.25 for sachet use). These patterns roughly follow the pattern of higher-capacity water mains in the GWCL distribution network, which often follow popularly-known, or “vernacular” neighborhood boundaries. The biophysical measures that show the most variation are the impervious (mean 66 percent, SD 26) and soil (30 percent, SD 25) land cover fractions. The vegetation fraction, as noted earlier, has been shown to be inversely correlated with the presence of slum communities, so it is unsurprising that there is so little variation (2 percent, SD 3) in the 37 HAWS EAs. Elevation variation is modest (20 percent, SD 14), as much of Accra is built on a flood plain, but the highest elevations, which typically enjoy the logistical advantage of gravity for waste removal particularly in the rainy season, are generally associated with higher-class neighborhoods. These EA-level measures are used as covariates in the multivariate analyses that explore hypotheses 2 and 3.
Figure 2.

Mean days per week of GWCL water rationing (water shut off) in 37 Enumeration Areas surveyed by the 2009 Housing and Welfare Study of Accra, Ghana.
Figure 3.

Percent of households reporting sachets as the primary source of drinking water in 37 Enumeration Areas surveyed by the 2009 Housing and Welfare Study of Accra, Ghana.
Rationing and sachet water
Table 3 shows the empty and multilevel model of sachet use. We estimate the empty model, the simplest form of the multilevel model with no covariates, as a baseline for assessing the change in upper-level variance as we add explanatory variables. We began with a three-level model of individual-, household-, and EA-level variances, but there was so little household-level variation relative to the individual level that these levels were collapsed into one in order to avoid over-fitting the data. The total variance at the EA level is 2.648 in the empty model. Model-building began with the EA-level rationing measure, and we proceeded to iteratively test combinations of covariates and first-order interaction terms until arriving at the most parsimonious model shown in Table 3, which minimizes the EA-level variance at 1.535. Only 42 percent [(2.648-1.535)/2.648] of the EA-level variance is accounted for in this model after adjusting for covariates; considerable variance remains, and this result suggests that living in a particular EA strongly influences an individual's propensity to drink from sachets.
Table 3. Empty and Multilevel Models of Sachets as the Primary Drinking Water Source among 2,093 Women.
| Empty | 2-lvl | |||||
|---|---|---|---|---|---|---|
|
| ||||||
| Characteristic | β | SE | β | SE | OR | 95% CI |
| Intercept | -0.241 | 0.280 | -1.639** | 0.484 | ||
| Individual-level variables | ||||||
| Self-reported overall health | ||||||
| Fair or poor † | ||||||
| Good | 0.027 | 0.249 | 1.03 | 0.63-1.68 | ||
| Very good | 0.653* | 0.263 | 1.92 | 1.15-3.22 | ||
| Excellent | 0.859** | 0.297 | 2.36 | 1.32–4.23 | ||
| Ethnicity | ||||||
| Other † | ||||||
| Asante | 1.044*** | 0.295 | 2.84 | 1.59-5.06 | ||
| Akwapim | 0.156 | 0.285 | 1.17 | 0.67-2.04 | ||
| Fante | 0.467* | 0.226 | 1.59 | 1.02-2.48 | ||
| Other Akan | 0.691** | 0.221 | 2.00 | 1.29-3.08 | ||
| Ga/Dangbe | 0.499* | 0.196 | 1.65 | 1.12-2.42 | ||
| Ewe | 0.626** | 0.210 | 1.87 | 1.24-2.82 | ||
| Mole/Dagbani | 0.710** | 0.246 | 2.03 | 1.26-3.30 | ||
| Age (years) | -0.003 | 0.004 | 1.00 | 0.99-1.01 | ||
| Household-level variables | ||||||
| Dwelling type | ||||||
| House, semi-detached, flat † | ||||||
| Compound house | -0.110 | 0.213 | 0.90 | 0.59–1.36 | ||
| Hut, tent, kiosk, business, other | 1.372*** | 0.346 | 3.94 | 2.00-7.78 | ||
| Boys age 5-18 in household | ||||||
| Zero † | ||||||
| One or more | -0.476*** | 0.116 | 0.62 | 0.50-0.78 | ||
| Enumeration Area-level variables | ||||||
| Days of Rationing | 0.510*** | 0.110 | 1.67 | 1.36-2.13 | ||
| Random Effects | ||||||
| Enumeration Area level | 2.648 | 0.748 | 1.535 | 0.450 | ||
| -2 Log pseudo-likelihood | 9,890.99 | 10,087.57 | ||||
| Generalized chi-square | 1,897.28 | 1,880.05 | ||||
Reference Category;
p < 0.10;
p < 0.05;
p < 0.01;
p < 0.001
Table 3 gives the restricted pseudo likelihood estimates for determinants of sachet use. There is strong support for hypothesis 2: the number of days of water rationing is statistically significantly associated with sachet use (p < 0.001), and the reported odds ratio of 1.67 (95% confidence interval 1.36–2.13) suggests that, after controlling for covariates, each additional day of water rationing in an EA makes a woman living in that EA on average 67 percent more likely to use sachets as her primary drinking water source than are women in an EA with no water rationing. Sachet users also tend to live in the lowest quality housing (hut, tent, kiosk, business, or other; p < 0.001), have no children (boys, in this model) age 5-18 in the household (p < 0.001), belong to particular ethnic groups, and report their own health to be excellent (p < 0.01). These measures suggest proxies for the trends seen in Table 1: low quality housing suggests poverty, the absence of boys suggests small household size, and ethnicity may reflect marginalization for some groups. The strong positive association between excellent overall health and sachet use may reflect the popular, if unsubstantiated, perception that sachets are actually healthier for you than piped water; it may be the result of some actual underlying health benefit from sachets; or it may be an artifact. The notion of an underlying health benefit leads us to hypothesis 3.
Sachet water and child diarrhea
Table 4 offers descriptive frequencies of the household and maternal characteristics for 810 children, stratified by reported diarrhea. Remarkably, only three measures – mother's self-reported health, primary source of drinking water, and household bathroom expenditures – yield statistically significant differences between the reported cases and non-cases. The measures that serve as proxies for relative poverty, which help explain sachet use, do not help delineate diarrhea cases from non-cases. Table 5 shows the empty and multilevel logistic model of diarrhea prevalence. Despite the smaller sample size, there was enough variation to support a three-level model; the total variance is 0.100 at the EA level and 0.444 at the household level in the empty model. Model-building began with the household-level sachet use measure, and we again iteratively tested combinations of covariates until arriving at the most parsimonious model shown in Table 5. In this child diarrhea model, most (77 percent) of the EA-level variance, but just 20 percent of the household-level variance, is accounted for after adjusting for covariates. With most of the unexplained variance remaining at the lower levels, this result suggests that household and individual factors exert greater influence on child diarrhea prevalence in these communities, and seems appropriate given numerous unmeasured household health behaviors that could open transmission routes for gastrointestinal illness (handwashing frequency, food preparation, etc.).
Table 4. Children's Individual and Household Characteristics Stratified by Presence or Absence of Recent Diarrhea.
| Diarrhea Reported | No Diarrhea Reported | |||
|---|---|---|---|---|
| Characteristic | Freq. | % or mean (95% CI) | Freq. | % or mean (95% CI) |
| Individual characteristics (n = 810) | 102 | 12.6 | 708 | 87.4 |
| Ethnicity of mother (%) | ||||
| Asante | 5 | 4.9 | 46 | 6.5 |
| Akwapim | 5 | 4.9 | 26 | 3.7 |
| Fante | 12 | 11.8 | 72 | 10.2 |
| Other Akan | 10 | 9.8 | 68 | 9.6 |
| Ga/Dangbe | 21 | 20.6 | 168 | 23.7 |
| Ewe | 10 | 9.8 | 93 | 13.1 |
| Mole/Dagbani | 15 | 14.7 | 74 | 10.5 |
| Other | 24 | 23.5 | 161 | 22.7 |
| Age of mother (years) | 29.0 (27.7–30.3) | 28.9 (28.4–29.3) | ||
| Mother's self-reported overall health (%) *** | ||||
| Excellent or very good | 32 | 31.4 | 371 | 52.4 |
| Good, fair, or poor | 70 | 68.6 | 337 | 47.6 |
| Household (HH) characteristics (n = 546) | 91 | 16.7 | 455 | 83.3 |
| Primary source of drinking water (%) *** | ||||
| Sachet | 30 | 33.0 | 247 | 54.3 |
| Other source | 61 | 67.0 | 208 | 45.7 |
| Type of dwelling (%) ∼ | ||||
| House, semi-detached, flat | 9 | 9.9 | 21 | 4.6 |
| Compound house | 75 | 82.4 | 377 | 82.9 |
| Hut, tent, kiosk, business, other | 7 | 7.7 | 57 | 12.5 |
| Source of lighting (%) ∼ | ||||
| Electricity | 3 | 3.3 | 40 | 8.8 |
| Gas, other, or none | 88 | 96.7 | 415 | 91.2 |
| Type of toilet access (%) | ||||
| WC or another house | 3 | 3.3 | 21 | 4.6 |
| KVIP or public toilet | 80 | 87.9 | 384 | 84.4 |
| Pit latrine, bucket/pan, other, none | 8 | 8.8 | 50 | 11.0 |
| Type of cooking fuel (%) | ||||
| Wood, gas, kerosene, other | 19 | 20.9 | 83 | 18.2 |
| Charcoal or nothing | 72 | 79.1 | 372 | 81.8 |
| Type of bathing facility (%) | ||||
| Own bathroom | 10 | 11.0 | 54 | 11.9 |
| Shared with other households | 63 | 69.2 | 287 | 63.1 |
| Cubicle, open space, other | 5 | 5.5 | 57 | 12.5 |
| River | 13 | 14.3 | 57 | 12.5 |
| Solid waste disposal (%) | ||||
| Collection service | 12 | 13.2 | 63 | 13.8 |
| Public dump | 70 | 76.9 | 332 | 73.0 |
| Burnt, buried, dumped elsewhere, other | 9 | 9.9 | 60 | 13.2 |
| Liquid waste disposal (%) | ||||
| Sewage system | 2 | 2.2 | 5 | 1.1 |
| Thrown in street or gutter | 70 | 76.9 | 339 | 74.5 |
| Thrown in compound or other | 19 | 20.9 | 111 | 24.4 |
| Number of girls age 5-18 in HH (%) | ||||
| None | 57 | 62.6 | 269 | 59.1 |
| One or more | 34 | 37.4 | 186 | 40.9 |
| Number of boys age 5-18 in HH (%) | ||||
| None | 56 | 61.5 | 284 | 62.4 |
| One or more | 35 | 38.5 | 171 | 37.6 |
| Number of rooms | 1.59 (1.35–1.83) | 1.58 (1.49–1.67) | ||
| Possessions index | 3.66 (3.34–3.98) | 3.77 (3.61–3.93) | ||
| Daily expenditures (in Ghanaian cedis) | ||||
| Phone | 1.00 (0.75–1.24) | 0.89 (0.75–1.02) | ||
| Transportation | 0.84 (0.65–1.02) | 0.90 (0.76–1.03) | ||
| Drinking water | 0.45 (0.32–0.58) | 0.40 (0.33–0.46) | ||
| Other water | 1.46 (0.13–2.79) | 0.65 (0.52–0.79) | ||
| Bathroom ** | 0.27 (0.20–0.34) | 0.44 (0.35–0.53) | ||
| Food | 9.26 (8.17–10.36) | 9.19 (8.54–9.85) | ||
| Cooking fuel | 0.81 (0.70–0.92) | 0.72 (0.64–0.79) | ||
| Monthly electricity expenditures | 7.72 (6.34–9.10) | 8.06 (7.28–8.83) | ||
| Sum of daily expenditures | 14.09 (12.17–16.00) | 13.19 (12.37–14.00) | ||
| % of daily expenditures spent on drinking water | 3.33 (2.72–3.95) | 3.29 (2.97–3.61) | ||
p < 0.10;
p < 0.05;
p < 0.01;
p < 0.001
Note: p-values for categorical measures are from χ2 test; p-values for continuous measure are from Welch F test of equality of means to account for variance heterogeneity
Table 5. Empty and Multilevel Models of Diarrhea Prevalence among 810 Children.
| Empty | 3-lvl | |||||
|---|---|---|---|---|---|---|
|
| ||||||
| Characteristic | β | SE | β | SE | OR | 95% CI |
| Intercept | -1.944 | 0.128 | -2.485*** | 0.301 | ||
| Individual-level variables | ||||||
| Mother's self-reported overall health | ||||||
| Excellent or very good † | ||||||
| Good, fair, or poor | 0.715** | 0.245 | 2.04 | 1.24-3.37 | ||
| Household-level variables | ||||||
| Sachets as primary drinking water | ||||||
| Yes † | ||||||
| No | 0.570* | 0.246 | 1.77 | 1.09-2.88 | ||
| Daily bathroom expense (GHC) | -0.552 ∼ | 0.301 | 0.58 | 0.32-1.04 | ||
| Enumeration Area-level variables | ||||||
| Days of Rationing | -0.023 | 0.071 | 0.97 | 0.85-1.13 | ||
| Random Effects | ||||||
| Enumeration Area level | 0.100 | 0.160 | 0.023 | 0.113 | ||
| Household level | 0.444 | 0.325 | 0.356 | 0.334 | ||
| -2 Log pseudo-likelihood | 3,957.86 | 4,090.18 | ||||
| Generalized chi-square | 600.53 | 632.04 | ||||
Reference Category;
p < 0.10;
p < 0.05;
p < 0.01;
p < 0.001
Table 5 also gives the restricted pseudo likelihood estimates for determinants of diarrhea, and it is notable that the maximum explanatory power of the model is achieved using just four measures. There is support for hypothesis 3, as sachet use is negatively associated with child diarrhea; children from households that do not use sachets as the primary drinking water source are 77 percent more likely to have experienced diarrhea in the two weeks prior to the HAWS survey (p = 0.023), despite generally being socioeconomically better off as shown in Table 1. Child diarrhea incidence was previously observed to be associated with low wealth in Accra, highest in households consuming water from outside vendors, and lowest for those drinking indoor piped water (Boadi and Kuitunen, 2005), but the data were collected in 2003 before sachets were commonplace. Vended water in Accra in 2003 was most likely water sold from another household with a piped connection, and typically subject to limited safe storage practices. Socioeconomic factors, particularly dwelling type, which was recently linked to poor overall and mental health in three Accra neighborhoods (Arku et al., 2011), do not discriminate diarrhea cases from non-cases in Table 4, but this may be attributed to a more homogenous study population than was sampled in previous studies.
Rationing is not a significant factor, but is an important EA-level control given the strong link to overall sachet use already reported. The self-reported health of the mother exhibits a strong, negative association with child diarrhea (p = 0.004), and this factor intuitively makes sense as a driver of a child's exposure to infection and overall care as well as maternal health knowledge. The household's daily bathroom expenditures approached significance (p = 0.068), but is negatively associated with diarrhea reports, which at first glance is difficult to interpret. It is plausible that bathroom expenses could be linked to better and worse living conditions: residents may have better toilet access which reduces their daily expenditures, or they may have such limited access that they are using “free” options such as sewers or rivers, again reducing this expense. To clarify this relationship, the daily bathroom expense measure is paneled by a related variable, bathing facility access, in Figure 4. Higher bathroom expenses are generally associated with access to the least desirable bathing facilities, supporting the notion that the poorest of the poor bear greater household expenses for basic services. The negative relationship between bathroom expenditures and diarrhea reports is then consistent with higher consumption of sachets by the poorest slum residents. But the J-shaped relationship in Figure 3 also reveals higher bathroom expenses for residents with access to their own bathroom, which perhaps reflects maintenance or additional water costs. Despite small sample sizes and high standard errors, the differences in mean expenditures across bathing facility categories reported in Figure 3 are significant across the board (Welch F test for All HH: p < 0.001; Diarrhea: p = 0.005; No Diarrhea: p < 0.001).
Figure 4.
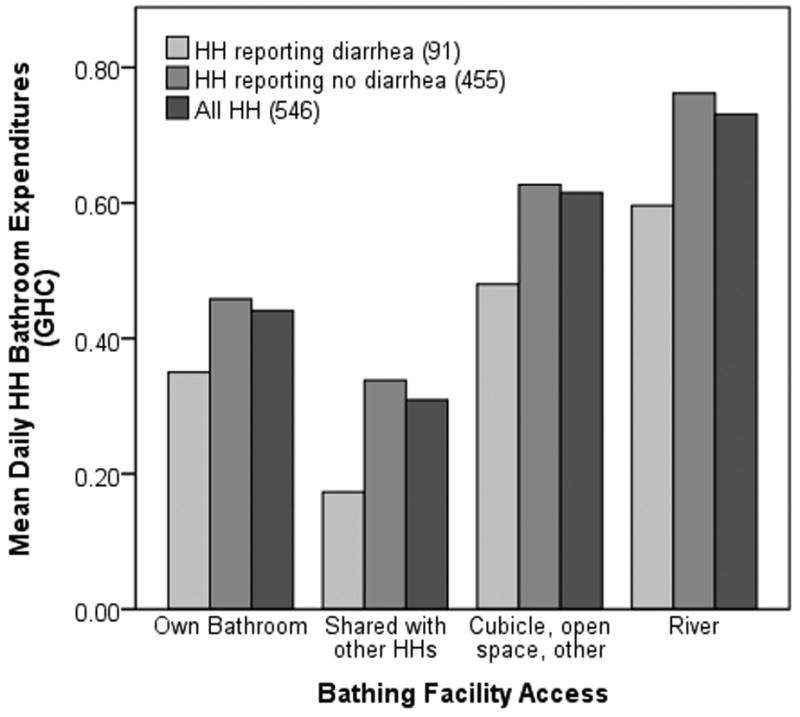
Mean daily household bathroom expenditure (in Ghanaian cedis) by household bathing facility.
Qualitative drinking water survey
A summary of the drinking water characteristics of the 32 households interviewed at follow-up is shown in Table 6. As in the larger HAWS sample, about 40 percent of households were drinking sachet water. None of the households revisited had piped water inside the home, so the remainder were categorized as using a standpipe within (31 percent) and beyond (28 percent) 20 m of the home. The locations of water sources beyond 20 m were recorded using a handheld GPS unit, and the respective Euclidean distances from the home – which underestimate travel time – range up to three kilometers. The drinking water sources are consistent with findings in coastal Ga communities, where vendors and wells (54 percent) are the main sources of drinking water, 38 percent of households have standpipes for water in the compounds of their homes, and 7 percent have indoor piping (Maxwell et al., 2000). There was some evidence of water rationing in effect during follow-up, as about 40 percent of households noted that their preferred standpipe was currently dry. Standpipes had generally been dry for a week or two, but one resident declared their pipe dry for three months and another said it had been two years.
Table 6. Summary of Drinking Water Characteristics for 32 Households at Follow-up.
| Characteristic | Responses | Percent (%) |
|---|---|---|
| Primary source of today's drinking water (n = 32) | ||
| Standpipe near home (< 20 m) | 10 | 31.3 |
| Standpipe away from home (> 20 m) | 9 | 28.1 |
| Sachet | 13 | 40.6 |
| Is local/preferred standpipe dry? (n = 32) | ||
| Yes | 13 | 40.6 |
| No | 19 | 59.4 |
| Is piped drinking water stored on the premises? (n = 32) | ||
| Yes | 18 | 56.3 |
| No | 14 | 43.7 |
| How long has today's drinking water been stored? (n = 18) | ||
| 1 day or less | 15 | 83.3 |
| 1 day or more | 3 | 16.7 |
| Drinking water storage vessel (n ==18) | ||
| Plastic container | 14 | 77.8 |
| Metal drum | 2 | 11.1 |
| Metal pot | 2 | 11.1 |
Drinking water was stored in 56 percent of households, usually in a plastic container and just for one day. There were no reports of efforts to improve stored drinking water (boiling, use of chlorine or bleach, desedimentation, etc.) except for three residents in Manpoase who added naphthalene balls (moth balls) to large volumes of stored drinking water. Residents used naphthalene primarily for insect control, but also believed that the chemical helped disinfect their water.
Source and stored water samples were accessible for fifteen households after exclusion of those who consumed sachet water. Source water samples exhibited a mean total coliform count of 5.7 colonies/ml (standard error [se] = 1.7; range 0-24), compared with stored water samples which displayed a higher mean of 50.5 colonies/ml (se = 10.5; range 0-120). Membrane filtration also revealed E. coli in four source water samples, and in seven stored water samples, several of which were not linked to polluted sources. Residual chlorine levels were generally between 0.12 and 0.19 mg/L, but were slightly higher for stored water than for source water, implying either the presence of some bleach-based cleaning products in the water, or an additive that residents were not aware of or disclosing. Out of ten sachet brands tested, one exhibited very low levels of total coliforms and none exhibited fecal coliforms.
The household follow-up interviews revealed additional details surrounding household decision-making for drinking water. The dominant theme that surfaced was that drinking water was not considered a major expense compared to other household expenses. The HAWS data supports this, with drinking water averaging 3.7 percent of a household's core daily expenditures (4.6 percent for households using sachets as their primary source, and 2.9 percent for everyone else [Table 1]). Higher-priced sachet water may be overrated as far as perpetuating poverty, as the 1.7 percent difference in daily expenditures between sachet-using households and all others is equal to about US$0.15, or about three sachets. Even sachet consumers are spending no more than the traditional affordability threshold of 5 percent of household income on their drinking water, and previous studies have demonstrated that low-income urban residents are willing to pay far more for piped water (McPhail, 1993; Whittington et al., 1991).
A related theme was that the task of fetching household water was generally viewed as a greater burden than paying for it. In apparent contradiction, several residents did not fetch water from the closest source as evidenced from the GPS coordinates of their reported water source. Social networks and transportation logistics proved to play an important role, as some interviewees with access to free water at their workplace, or perhaps a vehicle, gathered water from a kilometer or more away rather then pay for water a few blocks away. Transportation commutes and family relationships seemed to facilitate these cases. Residents' ability to keep water cool may also influence the point-of-purchase, as vended water – whether from neighborhood taps or individual sachets – is usually cool at acquisition.
Interviewees generally regarded sachet water as higher-quality water than piped water – though there was occasionally skepticism – and often referred to it by its generic street name, “pure water.” Consistent with the data presented in Table 1, larger households with children and therefore greater overall water demand were less likely to use sachets than single- or double-occupancy households without children. However, residents also explained that they sometimes use sachet water to feed infants for the first few years of life, due to the perception of cleanliness, and that children switch back to piped drinking water at a slightly older age. This explains the exception in Table 1 noted earlier, which is the lack of any significant difference in sachet use for households with children under five years of age.
Discussion and conclusions
The sachet water phenomenon represents a massive shift of the drinking water landscape in Western Africa, particularly among the urban poor. This is, to our knowledge, the first paper to explore the distribution and potential health effects of sachet consumption. While population-based surveys such as the Demographic and Health Survey indicate that sachet use is primarily a trend among low-income residents, this study utilizes a recent data set to examine the variability within Accra's slums that influence household decision-making for drinking water. We observe that individuals who use sachets as their primary drinking water source are generally the poorest of the poor, that the degree of water rationing in a neighborhood greatly influences sachet uptake, and that there may be both a perceived and real health benefit linked to consumption of sachet water due to the interruption of fecal exposure pathways from improperly stored water.
In addition to socioeconomic factors, there are multiple signs that larger household size steers drinking water behavior away from sachets: sachet-using households account for 12 percent fewer interviewees (i.e. fewer adult women per household) and have fewer rooms per dwelling, fewer boys and girls age 5-18, and lower daily cooking fuel expenses than non-sachet households. The pattern of buying sachets to feed infants, revealed during qualitative interviews, may explain why the negative association between household size and sachet use did not extend to children under 5. Households headed by women are more likely to use sachets, which makes sense in the context of the larger global trend of women bearing most of the responsibility for fetching household water; women are twice as likely as men to collect water, while children – particularly girls – play a supporting role in many households (United Nations, 2008).
The dual influence of low socioeconomic status and smaller household size also helps explain the most significant outlier from Figures 2 and 3, which is the large EA encompassing Old Fadama about 2 km east of inset B. Residents of Old Fadama are squatters on land owned by the Accra Metropolitan Assembly, and most live in temporary guest houses. Despite stable piped water access, Old Fadama is among the densest and poorest of Accra's slums and exists under constant threat of government-decreed relocation. This EA contains an atypically large proportion of low-income, single-adult households, often new migrants to Accra who hope to use this community as a temporary landing pad. Old Fadama is precisely the sociodemographic profile that is driving sachet consumption across Accra.
The suggestion of a health benefit from sachets is an important finding and a clear opportunity for future research. Historically, health gains were achieved by extending water access within urban agglomerations through the construction of new standpipes linked to the municipal water supply, rather than through private sector entrepreneurs. While household water treatment and safe storage can serve as an immediate mechanism to reduce illness among the unserved (United Nations Millennium Project, 2005), such practices are far from universal in urban slums with low water security, as is the case in Accra. Sachet water represents a key interruption to fecal contamination and exposure pathways by replacing consumption of poorly stored water in the home. Sachets essentially serve as an inadvertent safe storage vehicle, whether purchased on the street for immediate consumption or in bulk for home use. The contributions of improved water quality and storage to human health are well documented (Gundry et al., 2004), and the design of future safe storage projects may be improved by understanding the social appeal of sachet water.
Because sachet water is typically treated during the filling process, it is plausible that residents are in fact drinking higher quality water in sachets than they would otherwise be drawing from a tap, even with proper storage. It is also possible that the benefit is psychological and linked to sachet water's status as “pure water,” but the positive univariate relationship between higher self-reported health and sachet use is even stronger in the multivariate model, and reinforced in the child diarrhea analysis. In the child model, higher maternal self-reported health and sachet use are inversely associated with diarrhea cases, supporting not only the notion that sachets and higher self-reported health are related, but that a physiological health benefit may result as well.
There is some contention over whether sachet water's reputation for quality is ill-founded. Because many sachet producers are small-scale cottage industries, Ghanaian regulatory agencies, such as the Food and Drugs Board and Ghana Standards Board, have had difficulty tracking the sachet industry's rapid growth and ensuring quality control. Recent research on sachet water has primarily focused on sub-standard quality and potential disease transmission in Ghana (Addo et al., 2009; Ampofo et al., 2007; Dodoo et al., 2006; Kwakye-Nuako et al., 2007; Obiri-Danso et al., 2003), and Nigeria (Adenkunle et al., 2004; Ejechi and Ejechi, 2008; Ifeanyi et al., 2006; Nwosu and Ogueke, 2004; Olaoye and Onilude, 2009; Onifade and Ilori, 2008; Orisakwe et al., 2006; Oyedeji et al., 2010), with some elaboration on health impact. Although not every study has found sachet water quality to be troublesome (Egwari et al., 2005; Olowe et al., 2005), there is generally a bias toward the publication of negative findings. Given the emphasis on microbiological quality, there is virtually no literature on more contemporary water quality issues such as biphenols, heavy metals, and other pollutants.
Most of the discussion around sachets in Ghana addresses plastic waste accumulation and sanitation issues rather than public health. The single-serve plastic sleeves are routinely discarded in streets and gutters, and without effective sanitation services, drains and sewers are prone to frequent clogging in the rainy season. The flooding of drains and the proliferation of disease vectors such as Culex mosquitoes in stagnant water and garbage augment existing environmental health risks. In response, Ghana's Parliament considered a variety of ad valorum taxes in 2009 and 2010, initially on raw plastics and then on sachet water, intended in part to fund clean-up of sachet-related pollution. Both plans were rescinded – after public and private-sector outcry – to reduce hardship on consumers. The Finance Ministry continues to investigate means of taxing the plastic sleeves in a way that will curb environmental impact, rather than ban sachets altogether as previously considered. Sachet producers have also been consulting the Ghana Standards Board to optimize the formula for a new rapidly bio-degradable sachet. Despite this progress, the Sachet Water Producers Association announced a price increase in March 2011, the first increase in four years, which effectively doubles the street price of a sachet due to the infrequency of change from street vendors. While the Accra Metropolitan Assembly (AMA) has recently taken care to avoid marginalization of many of its communities that rely on sachet water, the debates over private water have served to divert attention away from the larger governance failure of safe urban water provision that has plagued other nations (Bakker et al., 2008). The affordability of sachet water may now be in doubt as a sustainable drinking water source for the urban poor.
There has been a paucity of research into the drinking water behaviors of the urban poor and the implications of evolving drinking water sources. This study uses mixed methods to demonstrate variability in drinking water consumption patterns and related health effects within low-income populations, but is limited by several of the survey questions in HAWS and suffers the same response biases typical of any large household survey. While the links between poverty, rationing, and sachet consumption are robust, the encouraging notion of positive health effects from sachet water, particularly those salient enough to overcome all the risk factors typically associated with slums and poverty, should be the focus of further study. Sachet water is being sold in all countries contiguous to Ghana and Nigeria (the sachet's alleged origin), and is rapidly spreading throughout Western Africa. In the face of pervasive drinking water shortages, governments must be prepared to embrace this trend to extend water coverage where needed, refine rationing systems to prevent further marginalization of poor residents, and balance public and environmental health interests to ensure quality without undermining municipal water production. The future of sachet water is unclear, but pursuit of a holistic understanding of water security issues will remain key to staving off drinking water crises in the region.
Highlights.
Half of low-income households in Accra, Ghana now use sachet water as their primary drinking water source.
We examine the effect of municipal water rationing on sachet use and health effects in slum neighborhoods.
Sachet-using households are generally the poorest of the poor with least access to basic services.
Neighborhood rationing and select socio-demographic factors are predictive of sachet use.
In a subset of children, lower maternal self-reported overall health and sachet avoidance are predictive of recent diarrhea.
Acknowledgments
This research was funded in part by grant number R01 HD054906 from the Eunice Kennedy Shriver National Institute of Child Health and Human Development (“Health, Poverty and Place in Accra, Ghana,” John R. Weeks, Project Director/Principal Investigator). The content is solely the responsibility of the authors and does not necessarily represent the official views of the National Institute of Child Health and Human Development or the National Institutes of Health. Additional funding was provided by Hewlett/PRB (“Reproductive and Overall Health Outcomes and Their Economic Consequences for Households in Accra, Ghana,” Allan G. Hill, Project Director/Principal Investigator). We also acknowledge the assistance from Matthias Schuendeln at Harvard University, as well as the generous support received during all phases of this study from the Institute for Statistical, Social and Economic Research (ISSER -Director - Ernest Aryeetey), the School of Public Health (Richard Adanu) and the Medical School (Rudolph Darko and Richard Biritwum), University of Ghana. We are grateful to: Anthony Y. Karikari, William Arko, M. Bello, and Lady Asantewa at CSIR-WRI for their field assistance; David Nunoo for additional GIS processing; Susan Murcott for sharing her experience with water quality testing in Tamale; and Livia Montana for supervision of the HAWS project and logistical assistance during the field work for this study. The authors thank two anonymous reviewers for comments that helped improve this paper.
Footnotes
It can be argued that, in order to understand the “choice” of sachet water, households with piped water in the home might be excluded from analysis. The presence of piped water in, or just outside the household was not surveyed independently of the drinking water question, and it is plausible that households with piped water may still drink primarily from sachets. Therefore households who primarily drink from in-home piped water are included in this analysis on the presumption that sachet consumption is an independent choice that does not necessarily preclude having access to piped water.
Publisher's Disclaimer: This is a PDF file of an unedited manuscript that has been accepted for publication. As a service to our customers we are providing this early version of the manuscript. The manuscript will undergo copyediting, typesetting, and review of the resulting proof before it is published in its final citable form. Please note that during the production process errors may be discovered which could affect the content, and all legal disclaimers that apply to the journal pertain.
Contributor Information
Justin Stoler, Email: stoler@rohan.sdsu.edu.
Günther Fink, Email: gfink@hsph.harvard.edu.
John R. Weeks, Email: john.weeks@sdsu.edu.
Richard Appiah Otoo, Email: richieotoo@gmail.com.
Joseph A. Ampofo, Email: jaampofo@yahoo.com.
Allan G. Hill, Email: ahill@hsph.harvard.edu.
References
- Addo KK, Mensah GI, Bekoe M, Bonsu C, Akyeh ML. Bacteriological quality of sachet water produced and sold in Teshie-Nungua suburbs of Accra, Ghana. African Journal of Food Agriculture Nutrition and Development. 2009;9:1019–1030. [Google Scholar]
- Adenkunle LV, Sridhar MKC, Ajayi AA, Oluwade PA, Olawuyi JF. An assessment of the health and social economic implications of sachet water in Ibadan igeria: A public health challenge. African Journal of Biomedical Research. 2004;7:5–8. [Google Scholar]
- Ampofo JA, Andoh A, Tetteh W, Bello M. Microbiological quality and health risks of packaged water produced in Southern Ghana. Journal of Applied Science and Technology (JAST) 2007;12:88–97. [Google Scholar]
- Arku G, Luginaah I, Mkandawire P, Baiden P, Asiedu AB. Housing and health in three contrasting neighborhoods in Accra, Ghana. Social Science & Medicine. 2011;72:1864–1872. doi: 10.1016/j.socscimed.2011.03.023. [DOI] [PubMed] [Google Scholar]
- Bakker K, Kooy M, Shofiani NE, Martijn EJ. Governance failure: Rethinking the institutional dimensions of urban water supply to poor households. World Development. 2008;36:1891–1915. [Google Scholar]
- Boadi KO, Kuitunen M. Childhood diarrheal morbidity in the Accra Metropolitan Area, Ghana: socio-economic, environmental and behavioral risk determinants. Journal of Health & Population in Developing Countries. 2005;7:1–13. [Google Scholar]
- Clasen TF, Cairncross S. Editorial: Household water management: refining the dominant paradigm. Tropical Medicine & International Health. 2004;9:187–191. doi: 10.1046/j.1365-3156.2003.01191.x. [DOI] [PubMed] [Google Scholar]
- Collignon B, Vézina M. Full Report of a Ten-country Study. Water and Sanitation Program; Washington, DC: 2000. Independent Water and Sanitation Providers in African Cities. [Google Scholar]
- Curtis S, Jones IR. Is there a place for geography in the analysis of health inequality? Sociology of Health & Illness. 1998;20:645–672. [Google Scholar]
- Dodoo DK, Quagraine EK, Okai-Sam F, Kambo DJ, Headley JV. Quality of “Sachet” waters in the Cape Coast municipality of Ghana. Journal of Environmental Science and Health Part A - Toxic/Hazardous Substances & Environmental Engineering. 2006;41:329–342. doi: 10.1080/10934520500423238. [DOI] [PubMed] [Google Scholar]
- Dreschel P, Van-Rooijen DJ. Water privatization in Ghana. Corporate Africa; 2008. pp. 108–111. [Google Scholar]
- Egwari LO, Iwuanyanwu S, Ojelabi CI, Uzochukwu O, Effiok WW. Bacteriology of sachet water sold in Lagos, Nigeria. East African Medical Journal. 2005;82:235–240. doi: 10.4314/eamj.v82i5.9312. [DOI] [PubMed] [Google Scholar]
- Ejechi EO, Ejechi BO. Safe drinking water and satisfaction with environmental quality of life in some oil and gas industry impacted cities of Nigeria. Social Indicators Research. 2008;85:211–222. [Google Scholar]
- Greenland S. Principles of multilevel modelling. International Journal of Epidemiology. 2000;29:158–167. doi: 10.1093/ije/29.1.158. [DOI] [PubMed] [Google Scholar]
- Gundry S, Wright J, Conroy R. A systematic review of the health outcomes related to household water quality in developing countries. Journal of Water and Health. 2004;2:1–13. [PubMed] [Google Scholar]
- Hensher D, Shore N, Train K. Households' willingness to pay for water service attributes. Environmental & Resource Economics. 2005;32:509–531. [Google Scholar]
- Ifeanyi VO, Obiekezie SO, Udebuani AC, Abara PN. Quality evaluation of sachet water sold in Port Harcourt, Nigeria. International Journal of Natural and Applied Sciences. 2006;2:332–335. [Google Scholar]
- International Development Committee. Sanitation and Water: Sixth Report of Session 2006-07, House of Commons. The Stationery Office Limited; London, UK: 2007. [Google Scholar]
- Kwakye-Nuako G, Borketey P, Mensah-Attipoe I, Asmah R, Ayeh-Kumi P. Sachet drinking water in Accra: The potential threats of transmission of enteric pathogenic protozoan organisms. Ghana Medical Journal. 2007;41:62–67. doi: 10.4314/gmj.v41i2.55303. [DOI] [PMC free article] [PubMed] [Google Scholar]
- Maxwell D, Levin C, Armar-Klemesu M, Ruel M, Morris S, Ahiadeke C. Urban Livelihoods and Food and Nutrition Security in Greater Accra. Ghana: International Food Policy Research Institute (IFPRI); 2000. [Google Scholar]
- McDonald D, Ruiters G. The Age of Commodity: Water Privatization in Southern Africa. Earthscan; London, UK: 2005. [Google Scholar]
- McGarvey ST, Buszin J, Reed H, Smith DC, Rahman Z, Andrzejewski C, Awusabo-Asare K, White MJ. Community and household determinants of water quality in coastal Ghana. Journal of Water and Health. 2008;6:339–349. doi: 10.2166/wh.2008.057. [DOI] [PMC free article] [PubMed] [Google Scholar]
- McPhail AA. The 5-percent rule for improved water service: Can households afford more? World Development. 1993;21:963–973. [Google Scholar]
- Nickson A. The public-private mix in urban water supply. International Review of Administrative Sciences. 1997;63:165–186. [Google Scholar]
- Nsiah-Gyabaah K. Second Workshop on Peri-Urban Natural Resource Management Project at the Watershed Level. DFID; Kumasi, Ghana: 2001. The Looming National Dilemma of Water Crisis in Peri-urban Areas in Ghana. [Google Scholar]
- Nwosu JN, Ogueke CC. Evaluation of sachet water samples in Owerri Metropolis. Nigerian Food Journal. 2004;22:164–170. [Google Scholar]
- Obiri-Danso K, Okore-Hanson A, Jones K. The microbiological quality of drinking water sold on the streets in Kumasi, Ghana. Letters in Applied Microbiology. 2003;37:334–339. doi: 10.1046/j.1472-765x.2003.01403.x. [DOI] [PubMed] [Google Scholar]
- Olaoye OA, Onilude AA. Assessment of microbiological quality of sachet-packaged drinking water in Western Nigeria and its public health significance. Public Health. 2009;123:729–734. doi: 10.1016/j.puhe.2009.09.015. [DOI] [PubMed] [Google Scholar]
- Olowe OA, Ojurongbe O, Opaleye OO, Adedosu OT, Olowe RA, Eniola KIT. Bacteriological quality of water samples in Osogbo Metropolis. African Journal of Clinical and Experimental Microbiology. 2005;6:219–222. [Google Scholar]
- Onifade AK, Ilori RM. Microbiological analysis of sachet water vended in Ondo State, Nigeria. Environmental Research Journal. 2008;2:107–110. [Google Scholar]
- Orisakwe OE, Igwilo IO, Afonne OJ, Maduabuchi JMU, Obi E, Nduka JC. Heavy metal hazards of sachet water in Nigeria. Archives of Environmental & Occupational Health. 2006;61:209–213. doi: 10.3200/AEOH.61.5.209-213. [DOI] [PubMed] [Google Scholar]
- Oyedeji O, Olutiola PO, Moninuola MA. Microbiological quality of packaged drinking water brands marketed in Ibadan metropolis and Ile-Ife city in South Western Nigeria. African Journal of Microbiology Research. 2010;4:96–102. [Google Scholar]
- Pellow D. Landlords and Lodgers: Socio-spatial Organization in an Accra Community. Praeger; Westport, CT: 2002. [Google Scholar]
- Stoler J, Daniels D, Weeks JR, Stow D, Coulter L, Finch BK. Assessing the utility of satellite imagery with differing spatial resolutions for deriving proxy measures of slum presence in Accra. Ghana: GIScience & Remote Sensing; 2011. p. 48. [DOI] [PMC free article] [PubMed] [Google Scholar]
- Subramanian SV, Jones K, Duncan C. Multilevel methods for public health research. In: Kawachi I, Berkman LF, editors. Neighborhoods and Health. Oxford University Press; Oxford: 2003. pp. 65–111. [Google Scholar]
- Taylor P, Boussen CR, Awunyo-Akaba J, Nelson J. Office of Health and Nutrition, USAID. USAID; Washington, DC: 2002. Ghana Urban Health Assessment, Activity Report 114. [Google Scholar]
- The Millennium Development Goals Report 2008. United Nations; United Nations; New York, NY: 2008. [Google Scholar]
- United Nations Development Programme. Poverty and the Global Water Crisis. United Nations; New York, NY: 2006. Human Development Report 2006: Beyond Scarcity: Power. [Google Scholar]
- United Nations Human Settlements Programme. The Challenge of Slums: Global Report on Human Settlements. Earthscan; London, UK: 2003. [Google Scholar]
- United Nations Millennium Project. Task Force on Water and Sanitation. Earthscan; London, UK: 2005. Health, Dignity, and Development: What Will it Take? [Google Scholar]
- Van-Rooijen DJ, Spalthoff D, Raschid-Sally L. Domestic water supply in Accra: how physical and social constraints to planning have greater consequences for the poor. 33rd WEDC International Conference: Access to Sanitation and Safe Water: Global Partnerships and Local Actions; Accra, Ghana. 2008. p. 5. [Google Scholar]
- Weeks JR, Hill AG, Stow DA, Getis A, Fugate D. Can we spot a neighborhood from the ground? Defining neighborhood structure in Accra, Ghana. GeoJournal. 2007;69:9–22. doi: 10.1007/s10708-007-9098-4. [DOI] [PMC free article] [PubMed] [Google Scholar]
- Whittington D, Lauria DT, Mu XM. A study of water vending and willingness to pay for water in Onitsha, Nigeria. World Development. 1991;19:179–198. [Google Scholar]
- WHO/UNICEF, 2000 Global Water Supply and Sanitation Assessment 2000 Report. World Health Organization; Geneva, CH: [Google Scholar]
- Wright J, Gundry S, Conroy R. Household drinking water in developing countries: a systematic review of microbiological contamination between source and point-of-use. ropical Medicine & International Health. 2004;9:106–117. doi: 10.1046/j.1365-3156.2003.01160.x. [DOI] [PubMed] [Google Scholar]