

Abstract
Here we characterize the structure, stability and intracellular mode-of-action of DermaVir nanomedicine that is under clinical development for the treatment of HIV/AIDS. This nanomedicine is comprised of pathogen-like pDNA/PEIm nanoparticles (NPs) having the structure and function resembling spherical viruses that naturally evolved to deliver nucleic acids to the cells. Atomic force microscopy demonstrated spherical 100–200nm NPs with a smooth polymer surface protecting the pDNA in the core. Optical-absorption determined both the NP structural stability and biological activity relevant to their ability to escape from the endosome and release the pDNA at the nucleus. Salt, pH and temperature influence the nanomedicine shelf-life and intracellular stability. This approach facilitates the development of diverse polyplex nanomedicines where the delivered pDNA-expressed antigens induce immune responses to kill infected cells.
Keywords: vaccine, immunotherapy, immunity
Background
Nanomedicines developed for the induction of immune responses comprise the formulation of plasmid DNA (pDNA) into nanoparticles (NPs), and thus targeting antigen presenting cells of the immune system1–3. It is established that negatively charged pDNA spontaneously forms NPs with positively charged polymers4–8. Linear polyethylenimine (PEI) has been developed as a synthetic delivery system for pDNA1, 8–10 and can act as proton-sponge thus protecting the pDNA from endosomal degradation. We have modified the PEI with sugar residues and obtained a novel mannobiosylated linear polyethylenimine (PEIm) to target the pDNA-encoded antigens to antigen presenting cells required for the induction of potent immune responses11. The surface mannose residues on the pDNA/PEIm NPs mimic the surface of pathogens that are recognized by antigen-presenting cells12–13. Compared to viral vectors, synthetic NPs are attractive for pDNA-based vaccine development due to their excellent safety features and the absence of vector-induced immune responses that makes them suitable for repeated administration and boosting of immunity. The safety, immunogenicity and preliminary efficacy of the pDNA/PEIm nanomedicine that we study (DermaVir) has been reported in SIV infected primate and HIV-infected human subjects14–18. These polyplex nanomedicines offer a promising new treatment paradigm for the treatment of diverse diseases, including cancer, allergic and chronic infectious diseases. However, before polyplex nanomedicine products approach the global market a number of issues need to be comprehensively addressed beyond clinical efficiency and safety such as the relationship of their physical structure and biological function.
Here we investigate how the physico-chemical parameters of a polyplex nanomedicine influence its biological activity and clarify the relationship between NP structure, nanomedicine shelf-life and cellular mode-of-action. First, we characterized the geometry of the DermaVir19 nanomedicine (DV) and its active pharmaceutical ingredient; a large pDNA encoding 15 HIV antigens, by direct observation made by atomic force microscopy (AFM) and confirmed these findings by dynamic light scattering (DLS). These results showed that the large pDNA alone does not form NP and the extent of NPs compaction is formulation dependent. Since the variable degree of compaction of the pDNA might influence the biological activity we characterized the stability of these nanomedicines using optical absorption spectroscopy (hyperchromicity). We found that hyperchromicity measurement can be effectively used to determine the effect of the primary physical variables (pH, salt concentration, temperature) on the nanomedicine stability and ‘aging’ (property drifts in time due NP reorganization). Finally, we correlate the biological activity of the nanomedicine to the physical methods of characterization. Having measurements to routinely characterize the properties of nanomedicine formulations is required for efficient development of these materials for the prevention and treatment of major chronic diseases9.
Methods
All experiments were repeated at least once, more preferably twice. 3 parallel samples were used for UV-vis and particle size measurements, and 5 for biological activity assays. Uncertainties were estimated as one standard deviation from the mean from multiple measurements.
Preparation of NPs
pDNA: pLWXu1 1mg/mL solutions encoding 15 HIV antigens (12.5kbp)20. PEIm: 13.6mM solution of linear 22kDa polyethylenimine containing 3% grafted mannobiose, pKa = 8.3±0.022 (in vivo-jetPEI™-Man, PolyPlus Transfection, Illkirch, France)21. Different pDNA and PEIm lots were manufactured. 10mmol/L triethanolamine buffer and triethanolamine-hydrochloride (TEA/HCl, Sigma) containing 10w/w% Mannitol (TEAM) was prepared at pH 7.5±0.2, or as indicated.
DV1 formulation was prepared by diluting the pDNA with 6 volume glucose solution (10w/w%) and PEIm at a PEIm/pDNA molar equivalent (N/P ratios) of 4 (unless otherwise indicated). DV2 formulation was prepared by diluting the pDNA with 6 volume TEAM buffer and PEIm at a PEIm/pDNA molar equivalent (N/P ratios) of 4 (unless otherwise indicated). N/P ratio is calculated by dividing the nitrogen concentration of the PEIm solution with the phosphorous concentration of the pDNA solution.
SDS decomplexation of NPs
1,000 times molar excess of sodium dodecyl sulfate (SDS, Sigma) solution was added to the prepared NPs and incubated 1 hour at room temperature (23±2°C). The spectra of the SDS-treated NPs were normalized with the spectra of the SDS in the used concentration.
Nuclease resistance of the NPs
NPs were incubated with endonuclease enzyme (DNase I, New England BioLabs, USA) at 37°C for 15 minutes. Control pDNA was digested for 5 minutes at 37°C. Sample-enzyme ratio was chosen according to the manufacturer’s instructions. Reaction was terminated by adding EDTA solution to the samples. After digestion SDS decomplexation of the NPs was performed as described above and evaluated by AGE as described below.
Atomic force microscopy
Measurements were made using a commercial AFM (Bioscope I with Nanoscope IV controller, Veeco). A 7μL drop of the NP solution was placed on freshly cleaved mica or APS-mica for 3 minutes, then washed with ultra-pure, deionized water to remove salts, and dried in a gentle stream of argon. AFM imaging was made in air in the tapping mode. Silicon cantilevers were used (OMCL by Olympus, Tokyo, Japan), which have a nominal spring constant of 42N/nm, resonant frequency of 300kHz, and nominal tip radius of 7nm. Image processing was done using the Nanoscope Imaging software (Veeco Instruments, Santa Barbara CA) and the NIH ImageJ software (available at http://rsb.info.nih.gov/ij). For sampling consistency, all height and width measurements were performed along two cross-sections of each molecule or NP. We report the average data of the measurements made on 40 to 80 adsorbed NPs. Measurements showed little change in the nanomedicine morphology with the surface interaction (APS or mica).
Agarose gel electrophoresis (AGE)
250ng pDNA was loaded into 1% agarose gel (containing ethidium bromide) and TAE buffer pH 8.3 (Invitrogen). For the evaluation of supercoiled content NIH ImageJ software was used.
Hyperchromicity (Hc%) was determined by UV-vis spectrophotometry, validated according to ICHQ2R guideline, performed on 30μg/mL pDNA in triplicates (repeatability is within 2%), using quartz cuvette in a calibrated Jasco V-630 instrument. Full spectra were recorded from 190 to 1100nm with 5nm step width. The calculation of Hc percentage was the following:
Particle size measurements were performed from 10μg/ml pDNA samples using Brookhaven ZetaPALS™ instrument equipped with quartz cuvette. Parameters: 3 runs; temperature: 25°C.
Biological activity of DermaVir nanomedicine was determined by quantifying the expressed proteins in the supernatant by p24 ELISA as previously described9, 21.
Zeta potential analysis was performed from 10μg/mL pDNA samples using Brookhaven ZetaPALS™ instrument equipped with “four side clear” plastic cuvette. Parameters: 5 runs, 10 cycles; temperature: 25°C.
In vitro complement activation assay for the quantification of serum S-protein-bound C terminal complex (SC5b-9) was performed as described earlier22. Briefly, the test samples and control compounds were incubated with human sera for 45 minutes at 37°C. After terminating the reaction samples were tested for SC5b-9 levels using the TCC ELISA kit (Quidel Co, San Diego, CA), following the manufacturer’s instructions. For positive control Zymosan was used which is known to induce high activation of the complement system23.
Statistical analysis
To assess the significance of the results, Student’s t-test was performed on selected data.
Results
We examined two nanomedicine formulations prepared by the same mixing procedure: DV1 and DV2 in glucose and in TEAM buffer, respectively (see Methods section). Some physico-chemical properties of the two formulations are summarized in Table 1. We found that minor changes in formulation present major differences in structure and biological activity9.
Table 1.
Physico-chemical properties of DV1 and DV2 nanomedicines.
| Property | DV1 | DV2 |
|---|---|---|
| pH | 3.5 | 7.5 |
| Conductivity (μS/cm) | 135 | 75 |
| Particle size (DEff ± SD nm)* | 130 ± 7 | 133 ± 5 |
| Hyperchromicity (Hc) %† | 13.7 | 23.7 |
Particle size measured by DLS method.
The calculation of hyperchromicity % is described in Methods section.
Characterization of pDNA Nanomedicine Morphology
We determined the structure of the nanomedicine with two independent methods since NP size is one of the critical parameters in our conceptual model of pathogen-like particle delivery. Figures 1a–d show atomic force microscopy (AFM) images of the pDNA and the NPs found in both DV1 and DV2 formulations. The uncondensed pDNA strands are uniformly distributed and form a network structure typical for solutions containing long overlapping semi-flexible polymer chains (Figure 1a). The NPs, in both cases, have a roughly spherical shape having a diameter in the range between 100nm to 200nm, but the NPs in the DV2 formulation have rather smooth surface (Figure 1b). In contrast, the DV1 formulation exhibits hair-like protrusions of presumably uncompactified pDNA, hinting that these structures might be less stable (Figure 1c, d). The minimum pDNA width is about 6nm indicating that this part of the pDNA is uncoated. At other places, the DNA is thicker (about 10nm) suggesting that PEIm coats the pDNA (Figure 1d). Similar structures are seen when such pDNA complexes are induced to become uncomplexed by molecular additives so that DV1 is apparently a less stable nanomedicine formulation9, 20. We amplify on this interpretation for the different morphologies of DV1 and DV2 NPs, below. Direct AFM measurements of polyplexes between pDNA and poly(amido amine) synthetic polyelectrolytes has directly revealed that these complexes predominantly involve single pDNA molecule, although some larger clusters containing a few pDNA molecules are also observed to occur24. We expect the same behavior to occur in polyplexes and indeed find evidence for smaller and larger clusters in our dynamic scattering measurements.
Figure 1. Investigation of the particle sizes of pDNA/PEIm NPs.
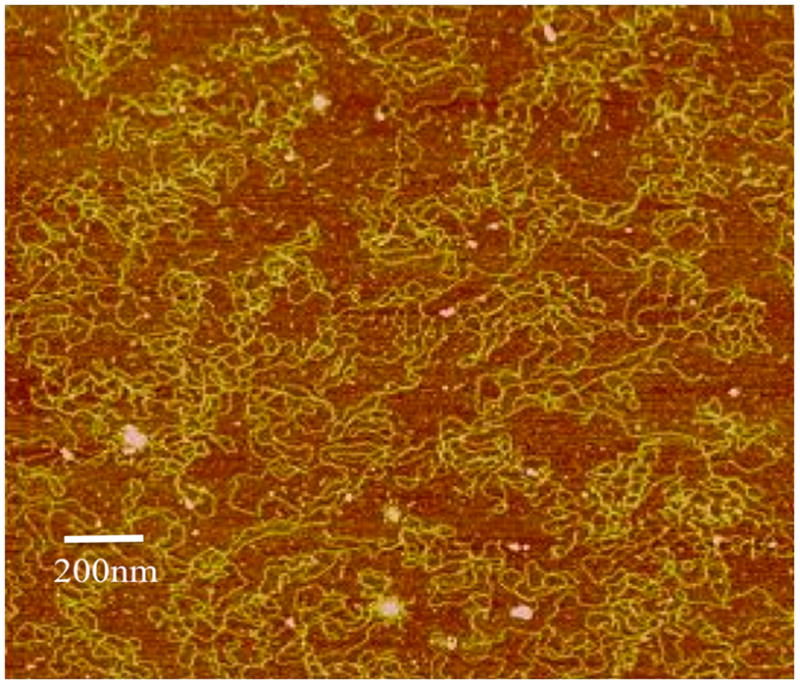
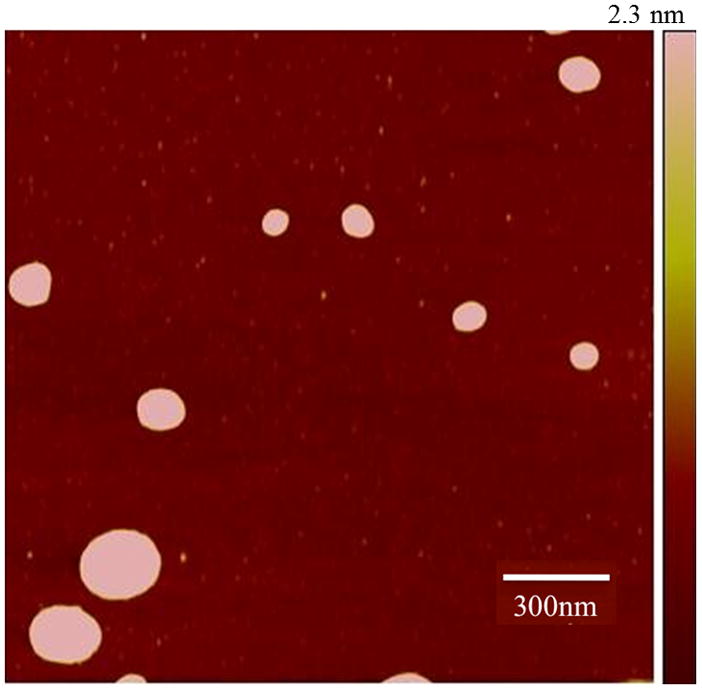
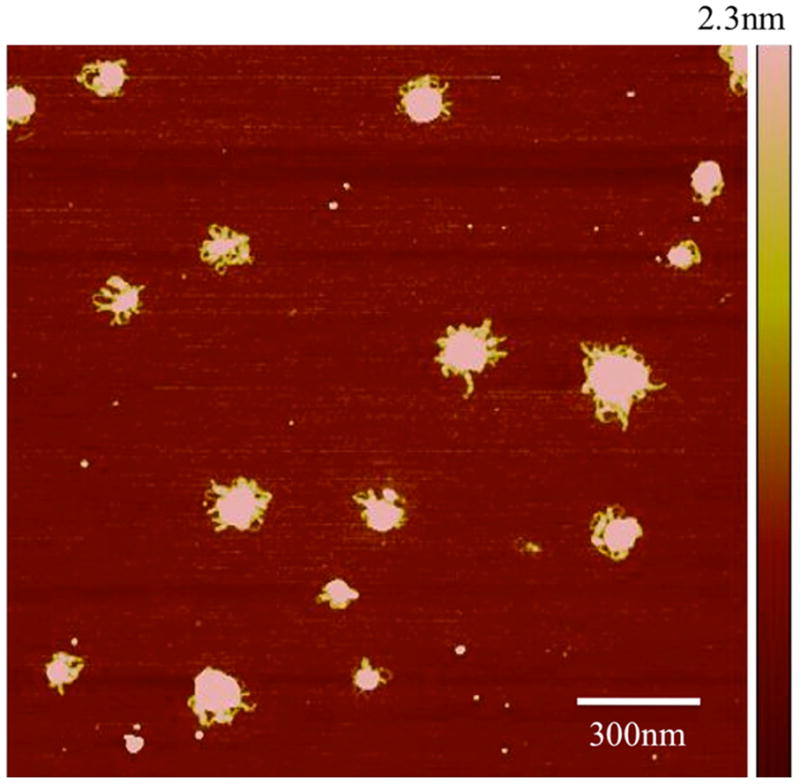
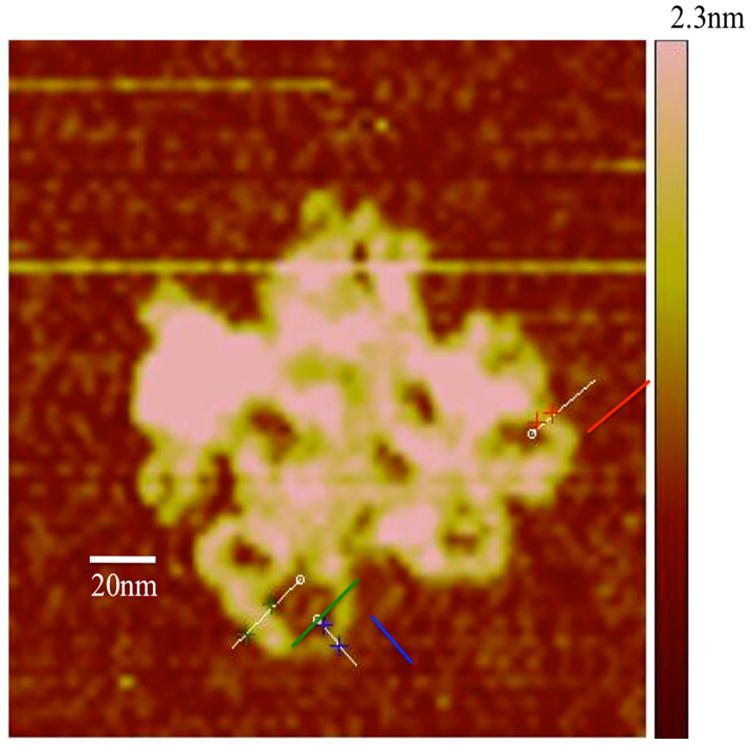
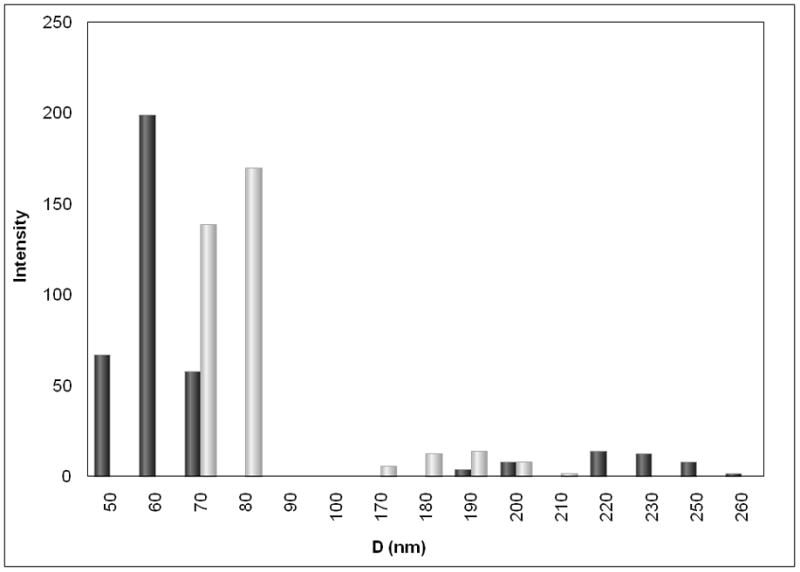
a, AFM image of pDNA in the absence of PEIm on mica surface. The pDNA strands form a random mesh typical of polymer solutions of long overlapping chains. b, AFM images of DV2 on mica. The NPs have smooth interfaces. c, AFM image of DV1 on mica. Hair-like protrusions of presumably uncompactified DNA are clearly visible. d, Magnified AFM image of the DV1. The minimum pDNA width is 6nm indicating that this part of the pDNA is uncoated DNA. At other places the pDNA is thicker (about 10 nm) suggesting that PEIm coats the pDNA. e, Representative particle size distributions of DV1 and DV2 measured by DLS; ■–DV1 and ■–DV2.
To further validate the estimates of the nanomedicine size, we performed DLS measurements in aqueous solution (see Methods). Consistent with the AFM data the NP diameter estimated from the experimental diffusion coefficient and the Stokes-Einstein relationship was found to be between 100nm and 200nm for both formulations (Table 1). Both the AFM and DLS measurements indicated a bimodal size distribution with NP sizes near 50nm to 90nm and 170nm to 260nm (Figure 1e).
Next, we studied the size of the NPs using DLS for variable pDNAs lengths, percentage of supercoiled content of the plasmid and pDNA and PEIm component ratios. For each variable, we demonstrated the formation of 70nm to 300nm size NPs. These results indicate that the length, the supercoiled content of the pDNA and the molar ratio of the pDNA and PEIm component (N/P ratio, see Methods) does not substantially affect NP size (Supplementary Tables 1, 2 and 3). We also investigated NPs made with different molecular weight PEIm-s and with PEI and showed that neither of these changes was related to the particle size (Supplementary Table 4). These results further demonstrated the robust capacity of these cationic polymers to condense the pDNA and form NPs.
Both DLS and AFM measurements indicate that these pathogen-like nanomedicines have shapes and dimensions similar to viruses25–26, but the different formulations exhibit a somewhat different fine structure. These variations in NP structure strongly suggest that the strength of the associations between the pDNA and synthetic polymer component is different in the two formulations, even though the overall size of the NPs remained constant.
Characterization of NP Formation
While a fundamental measurement of the binding constant between the pDNA and synthetic polymers is possible through competitive binding measurements27–28, it is desirable for clinical product formulation development to have a more facile method. A qualitative indication of this binding phenomenon can be obtained from absorption spectroscopy measurements. After adding PEIm to the pDNA we have observed an increase of absorbance – without any shift – in the whole spectral range including the wavelength range far from pDNA absorption, i.e., λ ≥ 320nm (Figure 2a). This ‘hyperchromicity’ (Hc) phenomenon is defined by the increase of optical density of a solution caused by changes of associative interactions of chemical species (see Methods for calculation of Hc%) and this measurement is particularly sensitive to the configuration of the base units of DNA since the proximity of these polarizable species gives rise to shifts in the optical absorption. Hc measurements are thus routinely used to characterize DNA double helix formation (‘hybridization’) in solution and these previous studies of DNA-DNA and DNA-NP interaction are informative about the interpretation that underlies this type of change in pDNA solution absorption spectra29. For investigation of Hc in nanomedicine formulations, we focused on solution absorbance changes at 260nm. We found that titration of the pDNA (P) with PEIm (N) causes continuous absorbance increase from molar N/P ratio of 0.5 to 1.5 (Figure 2b). Above N/P ratio of 2, where the pDNA is completely condensed with the PEIm, the absorbance remained constant indicating that no further interactions evolved between the components. As PEIm has baseline absorbance the measured Hc can be related to the forming interactions between the pDNA and the PEIm. This might be a general phenomenon for NPs since this type of measurement has also been utilized to characterize the binding of DNA to single wall carbon nanotubes29.
Figure 2. Spectrophotometric and zeta potential investigation of pDNA/PEIm NPs (DV2).
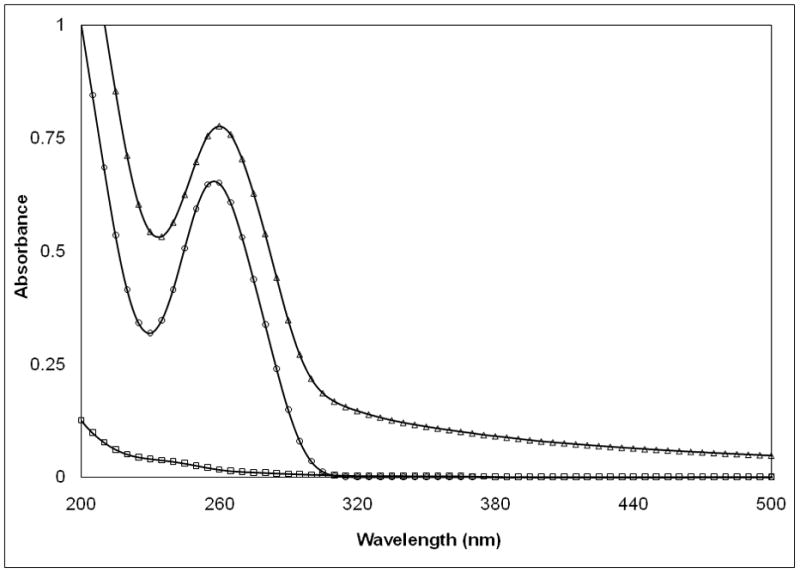
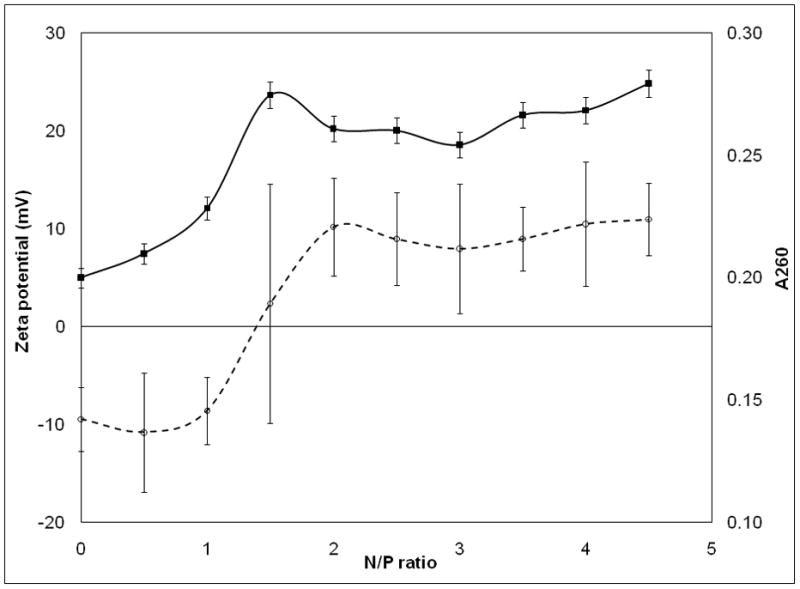
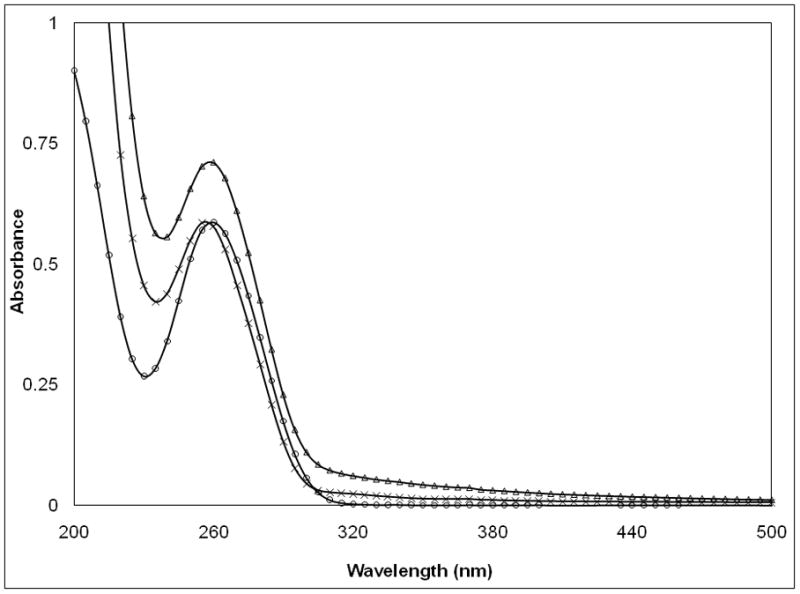
a, , UV-VIS-spectra of pDNA/PEIm NP and its components; pDNA (○), PEIm (□), pDNA/PEIm NP (△). b, Titration of pDNA (10μg/ml) with PEIm by UV-spectrophotometry (■) and zeta potential analysis (○). N/P=0 sample contains only pDNA. c, UV-VIS-spectra of pDNA (○), pDNA/PEIm NP before SDS treatment (△) and pDNA/PEIm NP after SDS treatment (×). SDS absorbance was subtracted from the spectrum. d, Residual gel electrophoresis of the pDNA (lane #2) and the NP before (lane #3) and after (lane #4) SDS treatment.
The observation of the Hc was confirmed with both zeta potential titration (Figure 2b) and agarose gel electrophoresis (Supplementary Figure 1). Above N/P ratio of 2, zeta potential remained constant and positive and the NP showed essentially no migration on the gel (Supplementary Figure 1). Once the pDNA is totally condensed, the addition of PEIm in excess caused no changes in particle size either (Supplementary Table 3). These results suggest that the percentage Hc correlates with the number of bonds formed between the phosphate and the amine groups of the NPs’ components. The correlation was confirmed by the decomplexation of the NPs. After the decomplexation of the NPs with SDS the Hc decreased to the absorbance of the pDNA (Figure 2c). In the decomplexed NPs, the pDNA migrated similarly to the control pDNA, while the NPs that were not treated with SDS did not migrate (Figure 2d).
We also investigated DV1 and DV2 formulations and found that Hc of DV1 is smaller than DV2 (Table 1) suggesting a smaller degree of association between the components. This observation is consistent with AFM images presented above and confirm that Hc provides a complementary tool to the NP size measurements for pDNA nanomedicine characterization. It is noteworthy, that the differences in the degree of association between the DV1 and DV2 formulations upon treatment of competing SDS could not be measured in freshly prepared samples by agarose gel migration (data not shown). Besides giving information on the degree of association between the pDNA and PEIm components of the nanoparticles, Hc measurement can also be utilized to describe the kinetics of the dissolution of the NPs to form freely suspended pDNA and PEIm molecules (See below). We note that the measurement of true binding constants of the complex formation by Hc, or other binding equilibrium measurement, requires the existence of equilibrium where Hc would then be constant. It is evident that the NPs can sometimes exist in a metastable state that can evolve over long timescales. Hc still provides an indicator of the nature and evolution of this complex state, even if it has no simple interpretation in terms of a simple binding constant. This is actually a common physical situation and the discussion of this type of non-equilibrium binding process has been discussed extensively recently in the binding of quantum dots to collagen layers30.
Influence of Temperature on NP Stability
Temperature is an important factor in clinical context and here we show additional evidences that the DV2 formulation is substantially more stable than DV1. We investigated the variation of Hc as a function of time at three different temperatures (4°C, 25°C and 37°C). We saw that Hc for the DV1 drifted in time as the NPs structure evolved (Figure 3a). In contrast, the Hc values for the DV2 sample were stable in time (Figure 3b). The increase of Hc of the pDNA naomedicine reflects the increase of absorbance of the free pDNA especially at higher temperatures (Figure 3c). Absorbance of the free pDNA saturated within a week, however, the Hc of DV1 did not reach that saturation. The stability of the DV1 formulation, as inferred from the Hc measurements, also increased upon cooling (Figure 3a). A similar trend was apparent in the pDNA that relates to the organization of the pDNA bases within the pDNA nanomedicine31–32. The Hc of the DV2 formulation remains constant over a time period of 8 days (Figure 3c). These stability data is consistent with the AFM measurements discussed above and suggest that the PEIm forms a robust complex with the pDNA in the DV2 formulation that shields the pDNA from the solution environment, while some of the pDNA in the DV1 formulation is in a state similar to the free pDNA in solution where the pDNA is potentially susceptible of degradation. Consequently, Hc provides a general parameter for “strength” of binding between the pDNA and PEIm and the evolution of the NPs, essential information in relation to controlling the stability and activity of the nanomedicine. The irregular structures characterizing the DV1 sample (Figure 1c) were found to become progressively more disorganized with increasing ‘aging’ time, and after a week no well-defined NPs were detected. A similar NP structure evolution was not observed in the DV2 sample, whose structure remained essentially invariant over a time period of several weeks (data not shown).
Figure 3.
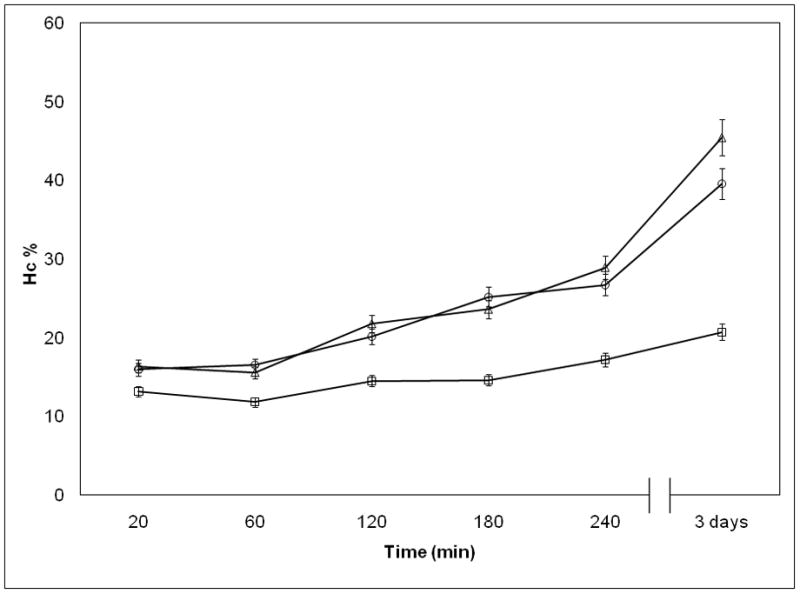
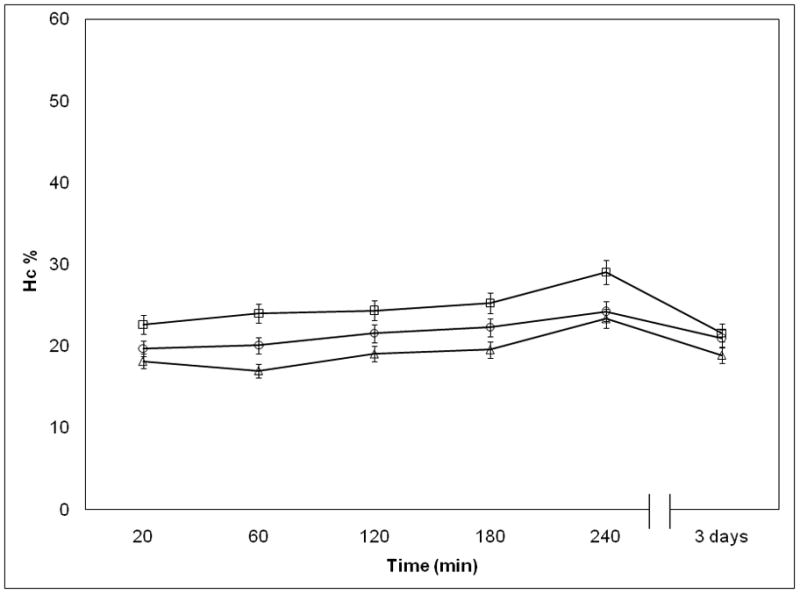
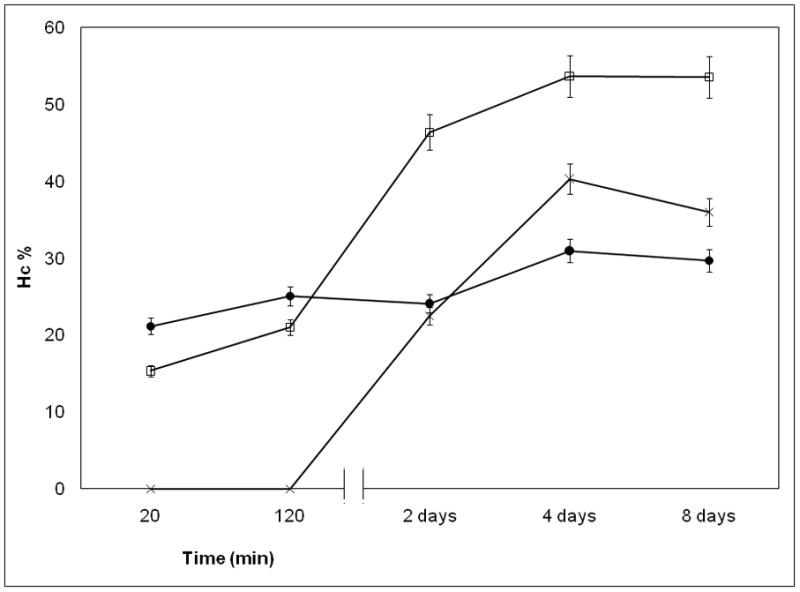
Investigation of pDNA/PEIm NP stability. a, Hc of DV1 measured in different time points after NP preparation; (□) 4°C, (○) 25°C, (△) 37°C. b, Hc of DV2 measured in different time points after NP preparation; (□) 4°C, (○) 25°C, (△) 37°C. c, Hc of DV1 (□), DV2 (●) and control pDNA (×) measured in different time points after incubating at 37°C.
Influence of pH and Salt Concentration on NP Stability
Next, we used Hc measurements to assess the effect of pH and salt (NaCl) concentration on NP structure. These are the most obvious variables in the nanomedicine formulation and understanding the sensitivity of nanomedicine to these variables is crucial for the control of the nanomedicine efficacy. As the two studied formulations DV1 and DV2 differed in both their pH and conductivity (Table 1) we investigated how these basic parameters affect the stability of nanomedicine through Hc measurements. First, we examined the effect of pH since this variable should strongly influence the strength of the ionic interactions between the two polyelectrolytes (pDNA and PEIm).
We found that the Hc of the pDNA nanomedicine is directly associated to the pH of the solvent (Figure 4a); as the pH increases, the Hc of the nanomedicine also increases. We also studied the effect of salt concentration (ionic strength) on the nanomedicine. The pDNA was supplemented with (0.1, 1, 3, 6 or 10) molar equivalents NaCl (calculated on the phosphate concentration of the pDNA) before mixing with the PEIm solution. Increasing the ionic strength decreased Hc (Figure 4b). Consistent results were obtained in the Hc vs. pH measurements (Figure 4a) we obtained similar results in Table 1: for DV1 formulation 13% (for pH 3.5) and for DV2 formulation 21% (for pH 7.5). The inverse correlation between Hc and NaCl concentration is also consistent with the lower Hc observed for DV1 than DV2 (Table 1) since the conductivity of the DV1 formulation is higher than for DV2 (Table 1). These results demonstrate that the morphology and property differences of the DV1 and DV2 formulations are the result of the different pH and ionic strength which determine the different degree of association of the components in the NPs and suggest that both of these parameters of the nanomedicine are important for the stability.
Figure 4. Effect of the ionic environment on the hyperchromicity of the pDNA/PEIm NPs.
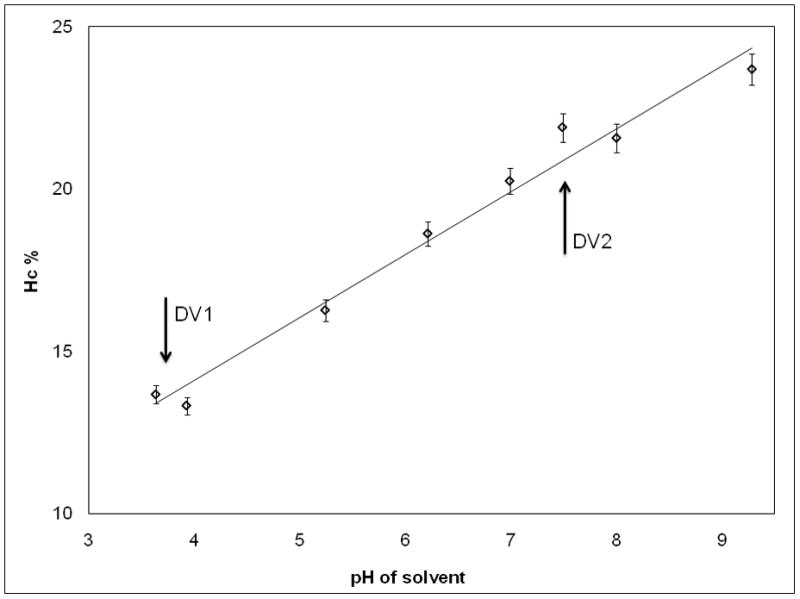
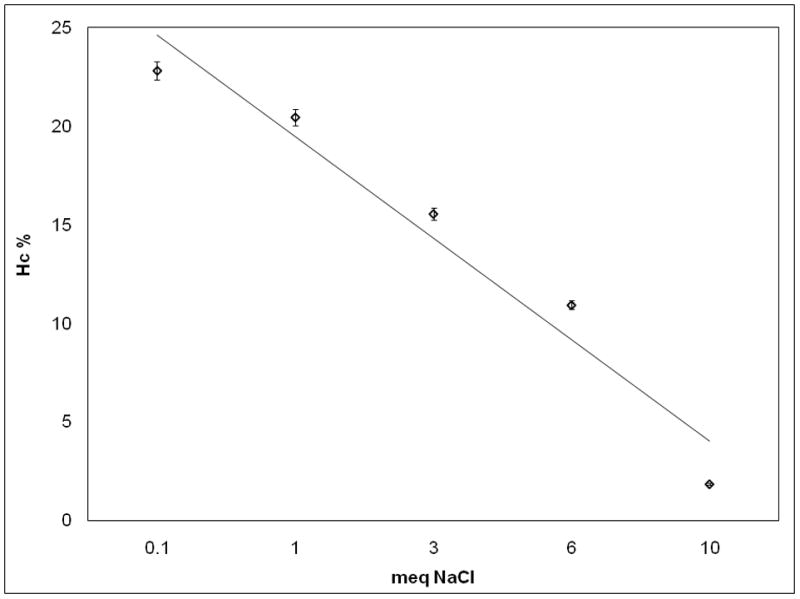
a, , Linear correlation between the pH of the solvent and the Hc% of pDNA/PEIm NPs. NP formulations were prepared using the same pDNA and PEIm at N/P ratio of 4 in different pH TEAM solutions. The pH of the DV1 and DV2 are marked with the arrows. (y=1.9403x+6.3354; r2=0.98) b, Inverse correlation between the NaCl concentration of pDNA solution and the measured Hc% of NP. Meq on the x axis stands for molar equivalents calculated on the phosphate concentration of pDNA (y=−5.1448x+29.761; r2=0.95).
Comparison of Biological Activities of NP Formulations
The biological activity of pDNA nanomedicine depends on the expression of the antigens encoded in the pDNA 12. We found that DV2 has significantly higher biological activity than DV1 (Figure 5a). This efficient gene expression correlates with the Hc trend as well as the higher nuclease resistance of DV2 compared to DV1 formulation (Table 1; Figure 5b). Consistently with the AFM data (Figure 1) the nuclease resistance assay demonstrates that the PEIm “envelop” protects the pDNA condensed in the DV2 in contrast to DV1 where the PEIm not perfectly covers the pDNA. Nucleases are present in both extra- and intra-cellular space to protect the organism from DNA, therefore we conclude that more pDNA of DV2 can enter the nucleus in contrast to DV1 where some of the pDNA gets digested. This result makes intuitive sense if we consider the mechanism of action depicted on a hypothetical model on Figure 5c. After cellular uptake, the NPs escape endosomal degradation with the help of the proton-sponge effect of the PEIm10, 33. The protonable nitrogens of the PEIm backbone are able to buffer the proton-rich environment of the endosome, thus protecting the pDNA inside the NP. It is evident that the stability of the NPs in the endosome having a rather low pH requires the NPs to be relatively stable and that the pDNA to be protected to avoid degradation. Our AFM images, Hc and nuclease resistance measurements on the stability of the NPs both suggest that the NPs of the DV1 formulation might not resist the intracellular degradation process as efficiently as in the DV2 formulation, and the chance of the uncompactified pDNA to become degraded in the lysosome is also evidently higher in this formulation. Our model is supported by recent findings showing that co-localization of PEI and the pDNA in the nuclei is required for gene expression29,34–35.
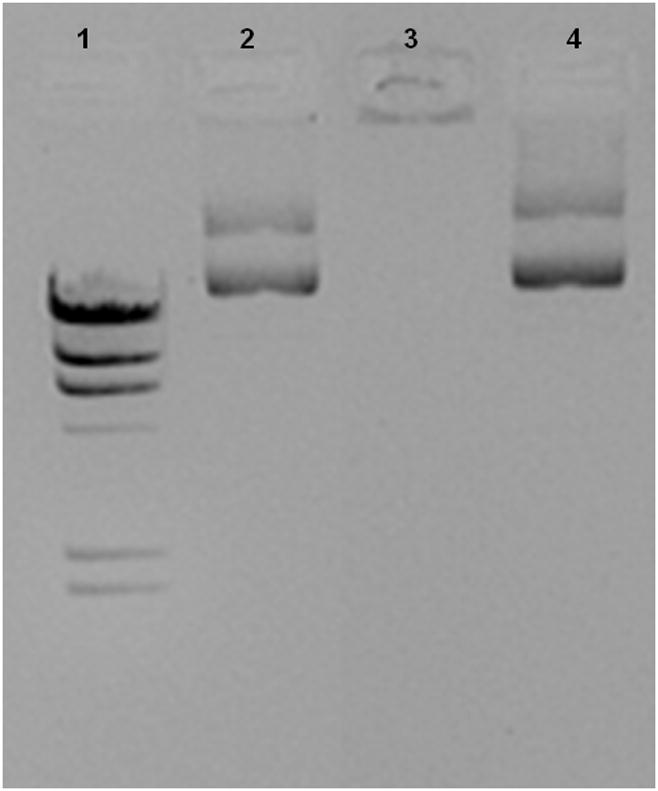
Figure 5. Effect of the hyperchromicity on gene expression.
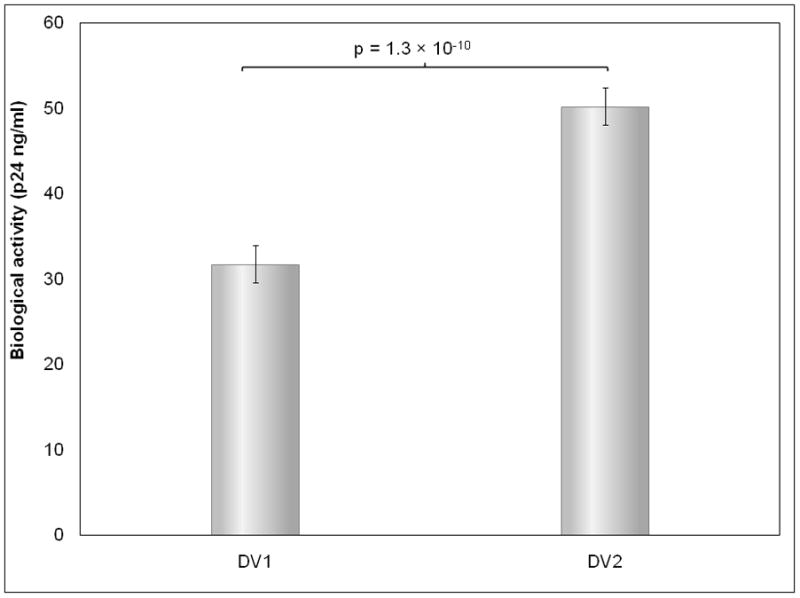
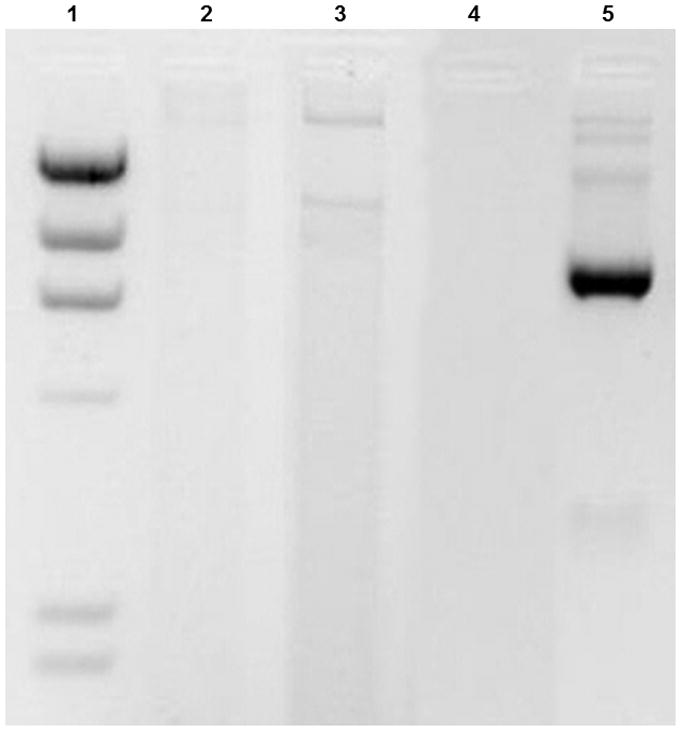
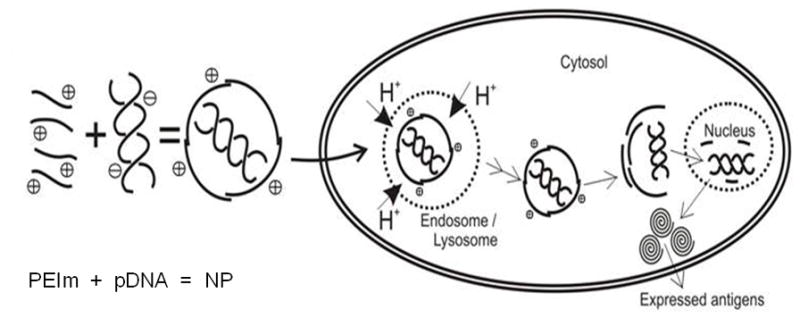
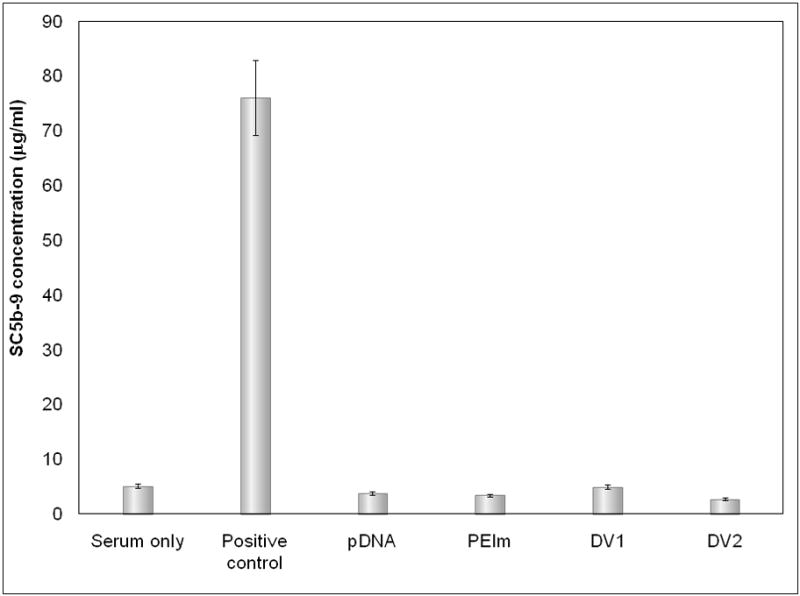
a, , Biological activity of DV1 and DV2. b Demonstration of the higher nuclease resistance of DV2 compared to DV1 formulation. Lanes: #1: marker; #2: DV1 digested with aspecific endonuclease and decomplexed; #3: DV2 digested with aspecific endonuclease and decomplexed; #4: pDNA digested with aspecific endonuclease; #5 control, untreated pDNA. c, Hypothetical model of pDNA nanomedicine uptake and antigen expression exemplified with the DermaVir HIV nanomedicine candidate. When Hc is optimal, the nanomedicine escapes from endosomal degradation, loosens in the cytosol and the pDNA reaches the nucleus, where the encoded several antigens are expressed. d, Complement activation of DV1, DV2, pDNA and PEIm. Positive control is Zymosan23.
One of the advantage of the “pathogen-like” nanomedicine compared to viral vectors that DermaVir is suitable for repeated administration to keep boosting immune responses required to fight chronic infectious diseases, like HIV/AIDS11–12, 14. We investigated the activation of the innate immune system with DermaVir since PEI was shown to activate the complement system36–37. DV1 and DV2 were incubated with 3 different human sera and surprisingly we found no complement activation by DermaVir nanomedicine (Figure 5d). It is noteworthy, that activation of the innate immunity by DermaVir cannot be completely excluded because the high variation of multiple human sera on complement activation38–39.
Discussion
We have established by both, AFM and DLS measurements that the size of the pDNA nanomedicine falls in the size range of viruses that naturally evolved to deliver genetic materials to cells (Figs. 1a–e). This led us to a strategy of directly engineering synthetic pathogen-like nanoparticles to optimize the pDNA delivery to cells. Uptake of larger (> 400nm) sized particles and bacteria generally occurs by different cellular transport mechanisms such as macropinocytosis and phagocytosis, while smaller sized particles and viruses usually translocate into the cell by receptor-mediated endocytosis25–26. It was surprising to us that basic nanomedicine parameters like the molar ratio of the components, the supercoiled form content and the length of the pDNA, polymer molecular weight did not appreciable influence the particle size of the NPs (Supplementary Table 1, 2, 3 and 4). These facts were crucial in setting our nanomedicine design parameters. Once the particle size was in the optimal range to ensure the receptor-mediated entry into target cells, sufficient stability is required to support the release of the pDNA from the endosome to the nucleus to efficiently express antigens within the cell40.
We found that the biological activity of the pDNA nanomedicine is dependent on their inherent structure and binding between the pDNA and PEIm, as determined by AFM and Hc, respectively. There are competing requirements of having sufficient stability to escaping endosomal degradation after cellular uptake and to remain intact all the way upon to arrive in the nucleus where the function of NP requires unraveling in the nuclear environment28, 35. The strength of the complex formation must be carefully controlled to satisfy all these requirements and setting the degree of association of the pDNA and PEIm components.
The evaluation of Hc is based on the “constant state” of the NPs when both the N/P ratio and the particle size are fixed. The measurable Hc is linked to the degree of association of the NP. Hc should be interpreted as a parameter describing the degree of interactions between the negatively charged phosphate oxygen of pDNA and the positively charged nitrogen (secondary amine) of PEIm. Since these interactions are driven by electrostatic forces Hc is sensitive to ionic strength and pH (Figure 4). These findings are confirmed by isothermal calorimetric (IC) titration and surface plasmon resonance (SPR) measuring the interaction between immobilized DNA and free PEI in the presence and absence of NaCl28.
The linear correlation between the Hc and the bulk pH of the nanomedicine is the result of the protonation state of its components. Theoretically, in low pH the secondary amines of the PEIm and the phosphates of the pDNA are protonated, therefore low number of bonds can be formed between them. At high pH the pDNA gets deprotonated and makes more interactions with the PEIm. According to Eliyahu et al. the degree of ionization of the amino group is highly dependent on the local pH (surface pH), which may differ from the bulk pH by 2 to 4 pH units41. Since measuring the local pH is not feasible, we operated with the bulk pH and Hc. We have established that the 6 to 7.5 optimal bulk pH value corresponding to a higher local surface pH value is optimal for both the thermodynamic stability and the biological activity9. The instrumental analysis methods like AFM, IC or SPR are powerful for the physical characterization of NPs, but their validation are problematic, therefore these methods are not suitable for the quality control of clinical nanomedicinal products.
Based on our results we concluded that the use of Hc as the measure of the degree of association of the pDNA and PEIm components is a powerful method for the determination of the NP’s inherent structure that affects the biological activity and the stability of the NPs. The approach described here should guide the clinical development of nanomedicines for prevention and treatment of infectious, neoplastic and immunologic diseases.
Supplementary Material
Titration of pDNA with PEIm followed by agarose gel electrophoresis.
Acknowledgments
The authors thank Ildikó Pulinka, Mónika Lakatos, Erika Horváth, Levente Molnár and Margit Vogel for their contribution.
Dr. Julianna Lisziewicz holds shares in Genetic Immunity. This work was supported by grants: HIKC05 and DVCLIN01 announced by the National Office for Research and Technology (NKTH) in Hungary. Ferenc Horkay and Preethi Chandran acknowledge the support of the Intramural Research Program of the NICHD, NIH. Janos Szebeni acknowledges the grant supports FP7 “Anticarb”, NKTH CARPA777.
Footnotes
Publisher's Disclaimer: This is a PDF file of an unedited manuscript that has been accepted for publication. As a service to our customers we are providing this early version of the manuscript. The manuscript will undergo copyediting, typesetting, and review of the resulting proof before it is published in its final citable form. Please note that during the production process errors may be discovered which could affect the content, and all legal disclaimers that apply to the journal pertain.
References
- 1.Garcea RL, Gissmann L. Virus-like particles as nanomedicines and vessels for the delivery of small molecules. Curr Opin Biotechnol. 2004;15:513–517. doi: 10.1016/j.copbio.2004.10.002. [DOI] [PubMed] [Google Scholar]
- 2.Jeong JH, Sung WK, Park TG. Molecular design of functional polymers for gene therapy. Progress in Polymer Science. 2007;32:1239–1274. [Google Scholar]
- 3.Zuber G, Dauty E, Nothisen M, Belguise P, Behr JP. Towards synthetic viruses. Adv Drug Deliv Rev. 2001;52:245–253. doi: 10.1016/s0169-409x(01)00213-7. [DOI] [PubMed] [Google Scholar]
- 4.Lobo BA, Koe G, Smith JG, Middaugh CR. Isothermal Titration Calorimetric Analysis of the Interaction Between Cationic Lipids and Plasmid DNA. Arch Biochem Biophys. 2001;386:95–105. doi: 10.1006/abbi.2000.2196. [DOI] [PubMed] [Google Scholar]
- 5.Zuidam NJ, Barenholz Y. Electrostatic and structural properties of complexes involving plasmid DNA and cationic lipids commonly used for gene delivery. Biochim Biophys Acta. 1998;1368:115–128. doi: 10.1016/s0005-2736(97)00187-9. [DOI] [PubMed] [Google Scholar]
- 6.Kleeman E, et al. Modified polyethylenimines as non-viral gene delivery systems for aerosol gene therapy: investigations of the complex structure and stability during air-jet and ultrasonic nebulization. J Controlled Release. 2004;100:437–450. doi: 10.1016/j.jconrel.2004.09.005. [DOI] [PubMed] [Google Scholar]
- 7.Remy J, et al. Gene transfer with lipospermines and polyethylenimines. Adv Drug Deliv Rev. 1998;30:85–95. doi: 10.1016/s0169-409x(97)00109-9. [DOI] [PubMed] [Google Scholar]
- 8.Sternberg B, Sorgi FL, Huang L. New structures in complex formation between DNA and cationic liposomes visualized by freeze-fracture electron microscopy. FEBS Lett. 1994;356:361–366. doi: 10.1016/0014-5793(94)01315-2. [DOI] [PubMed] [Google Scholar]
- 9.Tőke ER, Lőrincz O, Somogyi E, Lisziewicz J. Rational development of a stable liquid formulation for nanomedicine products. Int J Pharm. 2010;392:261–267. doi: 10.1016/j.ijpharm.2010.03.048. [DOI] [PubMed] [Google Scholar]
- 10.Boussif O, et al. A versatile vector for gene and oligonucleotide transfer into cells in culture and in vivo: Polyethylenimine. Proc Natl Acad Sci. 1995;92:7297–7301. doi: 10.1073/pnas.92.16.7297. [DOI] [PMC free article] [PubMed] [Google Scholar]
- 11.Lisziewicz J, et al. Induction of potent human immunodeficiency virus type 1-specific T-cell-restricted immunity by genetically modified dendritic cells. J Virol. 2001;75:7621–7628. doi: 10.1128/JVI.75.16.7621-7628.2001. [DOI] [PMC free article] [PubMed] [Google Scholar]
- 12.Lisziewicz J, et al. DermaVir: a novel topical nanomedicine for HIV/AIDS. J Invest Dermatol. 2005;124:160–169. doi: 10.1111/j.0022-202X.2004.23535.x. [DOI] [PubMed] [Google Scholar]
- 13.Irache JM, Salman HH, Gamazo C, Espuelas S. Mannose-targeted systems for the delivery of therapeutics. Expert Opin Drug Deliv. 2008;5:703–724. doi: 10.1517/17425247.5.6.703. [DOI] [PubMed] [Google Scholar]
- 14.Lisziewicz J, et al. Control of viral rebound through therapeutic immunization with DermaVir. AIDS. 2005;19:35–43. doi: 10.1097/00002030-200501030-00004. [DOI] [PubMed] [Google Scholar]
- 15.Lori F, Trocio J, Bakare N, Kelly LM, Lisziewicz J. DermaVir, a novel HIV immunization technology. Nanomedicine. 2005;23:2030–2034. doi: 10.1016/j.vaccine.2005.01.004. [DOI] [PubMed] [Google Scholar]
- 16.Lisziewicz J, Calarota S, Banhegyi D, Lisziewicz Zs, Ujhelyi E, Lori F. Single DermaVir Patch treatment of HIV+ individuals induces long-lasting, high-magnitude, and broad HIV-specific T cell responses. Paper presented at the 15th Conference on Retroviruses and Opportunistic Infections; Boston, MA, USA. 2008. Poster #715; [Google Scholar]
- 17.van Lunzen J, et al. DermaVir for initial treatment of HIV-infected subjects demonstrates preliminary safety, immunogenicity and HIV-RNA reduction versus placebo immunization. Paper presented at the XVIIIth International AIDS Conference; Vienna, Austria. 2010. Abstract #A-240-0111-12561. [Google Scholar]
- 18.Natz E, Lisziewicz J. Rational design of formulated DNA vaccines: the DermaVir approach. Gene Vaccines. (in press) [Google Scholar]
- 19.Certain commercial materials and instruments are identified in this article to adequately specify the experimental procedure. In no case does such identification imply recommendation or endorsement by the National Institute of Standards and Technology or the National Institutes of Health; nor does it imply that materials or equipment identified are necessarily the best available for the purposes.
- 20.Somogyi E, et al. A plasmid DNA immunogen expressing fifteen protein antigens and complex virus-like particles (VLP+) mimicking naturally occurring HIV. Vaccine. 2011;29:744–753. doi: 10.1016/j.vaccine.2010.11.019. [DOI] [PubMed] [Google Scholar]
- 21.Zékány L, Nagypál I. Computation Methods for the Determination of Formation Constants. New York: Plenum Press; 1991. [Google Scholar]
- 22.Szebeni J, Muggia FM, Alving CR. Complement activation by cremophor el as a possible contributor to hypersensitivity to paclitaxel: an in vitro study. J Natl Cancer Inst. 1998;90(4):300–306. doi: 10.1093/jnci/90.4.300. [DOI] [PubMed] [Google Scholar]
- 23.Szebeni J, Fontana JL, Wassef NF, Mongan PD, Morse DS, et al. Hemodynamic Changes Induced by Liposomes and Liposome-Encapsulated Hemoglobin in Pigs. Circulation. 1999;99:2302–2309. doi: 10.1161/01.cir.99.17.2302. [DOI] [PubMed] [Google Scholar]
- 24.Wan L, et al. DNA release dynamics from Bioreducible poly(amino amine) Polyplexes. J Phys Chem B. 2009;113:13735–13741. doi: 10.1021/jp901835u. [DOI] [PMC free article] [PubMed] [Google Scholar]
- 25.Lamaze C, et al. Interleukin 2 receptors and detergent-resistant membrane domains define a clathrin-independent endocytic pathway. Mol Cell. 2001;7:661–671. doi: 10.1016/s1097-2765(01)00212-x. [DOI] [PubMed] [Google Scholar]
- 26.Bruewer M, et al. Interferon-gamma induces internalization of epithelial tight junction proteins via a macropinocytosis-like process. FASEB J. 2005;19:923–933. doi: 10.1096/fj.04-3260com. [DOI] [PubMed] [Google Scholar]
- 27.Srinivasachari S, Liu Y, Prevette EL, Reineke TM. Trehalose Click Polymers Inhibit Nanoparticle Aggregation and Promote pDNA Delivery in Serum. J Am Chem Soc. 2006;128:8172–8184. doi: 10.1021/ja0585580. [DOI] [PubMed] [Google Scholar]
- 28.Han X, et al. The heterogeneous nature of polyethylenimine-DNA complex formation affects transient gene expression. Cytotechnology. 2009;60:63–75. doi: 10.1007/s10616-009-9215-y. [DOI] [PMC free article] [PubMed] [Google Scholar]
- 29.Hughes ME, Brandin E, Golovchenko JA. Optical Absorption of DNA-Carbon Nanotube Structures. Nanolett. 2007;7:1191–1194. doi: 10.1021/nl062906u. [DOI] [PMC free article] [PubMed] [Google Scholar]
- 30.Park JJ, et al. Charachterization of Non-Equilibrium Nanoparticle adsorption on a Model Biological Substrate. Langmuir. 2010;26:4822–4830. doi: 10.1021/la903581w. [DOI] [PubMed] [Google Scholar]
- 31.Bloomfield VA, Criothers DM, Tinoco I. Nucleic Acids: Structure, Properties and Functions. University Science Books; Sausalito, CA: 2000. [Google Scholar]
- 32.Tomac S, et al. Ionic Effects on the Stability of Peptide Nucleic Acid (PNA) Complexes. J Am Chem Soc. 1996;118:5544–5552. [Google Scholar]
- 33.Akinc A, Thomas M, Klibanov AM, Langer R. Exploring polyethyleneimine-mediated DNA transfection and the proton sponge hypothesis. J Gene Medicine. 2005;7:657–663. doi: 10.1002/jgm.696. [DOI] [PubMed] [Google Scholar]
- 34.Godbey WT, Kenneth KW, Mikos AG. Tracking the intracellular path of poly(ethyleneimine)/DNA complexes for gene delivery. Proc Natl Acad Sci. 1999;96:5177–5181. doi: 10.1073/pnas.96.9.5177. [DOI] [PMC free article] [PubMed] [Google Scholar]
- 35.Suh J, Wirtz D, Hanes J. Efficient active transport of gene nanocarriers to the nucleus. Proc Natl Acad Sci. 2003;100:3878–3882. doi: 10.1073/pnas.0636277100. [DOI] [PMC free article] [PubMed] [Google Scholar]
- 36.Plank C, Mechtler K, Szoka FC, Jr, Wagner E. Activation of the complement system by synthetic DNA complexes: a potential barrier for intravenous gene delivery. Hum Gene Ther. 1996;7(12):1437–1446. doi: 10.1089/hum.1996.7.12-1437. [DOI] [PubMed] [Google Scholar]
- 37.Merkel OM, et al. In vitro and in vivo complement activation and related anaphylactic effects associated with polyethyleneimine-graft-poly(ethyleneglycol) block copolymers. Biomaterials. 2011;32:4936–4942. doi: 10.1016/j.biomaterials.2011.03.035. [DOI] [PubMed] [Google Scholar]
- 38.Szebeni J, Baranyi L, Savay S, Lutz HU, Jelezarova E, Bunger R, et al. The role of complement activation in hypersensitivity to pegylated liposomal doxorubicin (doxil®) J Liposome Res. 2000;10(4):467–481. [Google Scholar]
- 39.Chanan-Khan A, Szebeni J, Savay S, Liebes L, Rafique NM, Alving CR, et al. Complement activation following first exposure to pegylated liposomal doxorubicin (doxil(r)): possible role in hypersensitivity reactions. Ann Oncol. 2003;14(9):1430–1437. doi: 10.1093/annonc/mdg374. [DOI] [PubMed] [Google Scholar]
- 40.Schaffer DV, Fidelman NA, Dan N, Lauffenburger DA. Vector unpacking as a potential barrier for receptor-mediated polyplex gene delivery. Biotech & Bioengr. 2000;67:598–606. doi: 10.1002/(sici)1097-0290(20000305)67:5<598::aid-bit10>3.0.co;2-g. [DOI] [PubMed] [Google Scholar]
- 41.Eliyahu H, Siani S, Azzam T, Domb AJ, Barenholz Y. Relationship between chemical composition, physical properties and transfection efficiency of polysaccharide-spermine conjugates. Biomaterials. 2006;27:1646–1655. doi: 10.1016/j.biomaterials.2005.09.005. [DOI] [PubMed] [Google Scholar]
Associated Data
This section collects any data citations, data availability statements, or supplementary materials included in this article.
Supplementary Materials
Titration of pDNA with PEIm followed by agarose gel electrophoresis.