

Abstract
Stimulated-echoes in MR can be used to provide high sensitivity to motion and flow, creating diffusion and perfusion weighting as well as T1 contrast, but conventional approaches inherently suffer from a 50% signal loss. The super stimulated-echo, which uses a specialized radiofrequency (RF) pulse train, has been proposed in order to improve the signal while preserving motion and T1 sensitivity. This paper presents a novel and straightforward method for designing the super stimulated-echo pulse train using inversion pulse design techniques. This method can also create adiabatic designs with an improved response to RF transmit field variations. The scheme was validated in phantom experiments and shown in vivo to improve SNR. We have applied a super stimulated-echo to metabolic MRI with hyperpolarized 13C-labeled molecules. For spectroscopic imaging of hyperpolarized agents, several repetition times are required but only a single stimulated-echo encoding is feasible, which can lead to unwanted motion blurring. To address this, a super stimulated-echo preparation scheme was used in which the diffusion weighting is terminated prior to the acquisition, and we observed a SNR increases of 60% in phantoms and 49% in vivo over a conventional stimulated-echo. Experiments following injection of hyperpolarized [1-13C]-pyruvate in murine transgenic cancer models have shown improved delineation for tumors since signals from metabolites within tumor tissues are retained while those from the vasculature are suppressed by the diffusion preparation scheme.
Index Terms: Super Stimulated-echo, Hyperpolarized C-13, magnetization preparation, inversion pulses, diffusion imaging, metabolic imaging
I. Introduction
Magnetic resonance imaging (MRI) with injected hyperpolarized 13C substrates is a promising new technique for metabolic imaging in vivo with demonstrated scientific and potential clinical value [1]–[4]. These studies have been made possible by the development of methods utilizing Dynamic Nuclear Polarization (DNP) and rapid dissolution techniques that provide a polarization increase of over 40,000 for 13C-labeled molecules [1], [2]. [1-13C]-pyruvate has been the most utilized molecule thus far because its conversion to [1-13C]-lactate been shown to distinguish between normal and diseased tissues in preclinical animal models [5]–[17]. In vivo imaging with hyperpolarized substrates requires rapid and efficient MR imaging techniques because the high polarization is irrecoverably lost due to T1 relaxation to thermal equilibrium and T2 relaxation following any RF excitation. This also requires that data be acquired relatively shortly after injection, and metabolites are observed in the vasculature in addition to the tissues or organs of interest. Furthermore, [1-13C]-lactate generated following a [1-13C]-pyruvate injection can be both transported out of cells and also generated in red blood cells [18], creating high levels of this potential tumor biomarker in the vasculature. These factors can potentially invalidate the attribution of detected lactate to metabolic conversion.
One way to suppress flowing, perfusing, or diffusing spins is to use large, offset spatial encoding gradients with either a spin-echo (SE) or stimulated-echo (STE) sequence. The STE acquisition has a mixing interval which can increase the diffusion sensitivity at the expense of T1 relaxation [19]–[21], unlike the SE where only T2 weighting occurs. This is well-suited to [1-13C]-pyruvate metabolic imaging, in which the T1s are relatively long (≈ 30 s in vivo [7]). 13C diffusion imaging is also made more difficult due to a gyromagnetic ratio of γ/2π = 1071 Hz/G, which is about 4-times smaller than 1H (γ/2π) = 4257 Hz/G), for which the STE T1 sensitivity is advantageous in generating large diffusion encoding strengths. We have previously applied a STE acquisition mode (STEAM) pulse sequence to hyperpolarized [1-13C]-pyruvate metabolic imaging [22], in which we found that, amongst the metabolites, [1-13C]-pyruvate had a higher vascular concentration while [1-13C]-alanine had a higher extravascular concentration. This study also found [1-13C]-lactate in prostate tumors had a higher extravascular concentration than [1-13C]-lactate in the kidneys and liver, leading to improved delineation of the tumors. One disadvantage of a STE is that there is an inherent 50% signal loss compared to the SE, even with no motion.
In order to more efficiently image localized metabolic conversion, we have developed and tested a stimulated-echo preparation (STEP) diffusion imaging scheme. This scheme contains a super stimulated-echo (super-STE) [23], [24], which is a tailored RF pulse train that generates improved signal over a conventional STE. By using a preparation scheme as opposed to a STEAM approach, the diffusion and perfusion weighting is terminated prior to imaging, and motion blurring artifacts that can occur during a relatively long MR spectroscopic imaging (MRSI) acquisition are reduced. This also can be followed by any type of imaging sequence; we used compressed sensing 3D echo-planar spectroscopic imaging (EPSI) [13], and other approaches such as spiral chemical shift imaging (CSI) [25]–[27], multi-echo parametric methods [28], [29] and metabolite-specific imaging [30], [31] could be used as well. This manuscript describes the super-STE from a theoretical point of view, presents a novel pulse design approach to create a super-STE, compares several diffusion imaging approaches, and presents preliminary data in transgenic mouse models of cancer demonstrating improved tumor delineation with the proposed super-STE preparation approach.
II. Theory
A. Stimulated-Echo
A maximum amplitude stimulated-echo is formed by a set of three 90° RF pulses, at a time after the third pulse that is equivalent to the spacing between the first two pulses, as shown in Fig. 1A. There is phase accumulation between the first two pulses, due to chemical shift and off-resonance (Δf), as well as the applied gradients (G⃗) and position (x⃗), resulting in an effective frequency and phase of
Fig. 1.

(A) STEAM: Conventional STE formation. (B) Super-STEAM: Super-STE encoding and conventional excitation. (C) Super-STEAM: Super-STE encoding and super-STE excitation. (D) Super-STEP: Super-STE encoding and super-STE refocusing to MZ. It can be followed by any imaging sequence. The solid lines indicate magnetization that contributes to the final signal, while the dashed components are not observed, as they are either crushed or have zero net signal, averaged across φ.
| (1) |
| (2) |
The second 90° RF pulse rotates the magnetization, which is entirely transverse, partially back into MZ, resulting in
| (3) |
assuming an initial magnetization M⃗0 = [0, 0, 1]. The crusher during the Mixing Time destroys the transverse components of Menc, after which the fractional magnetization remaining is
| (4) |
Finally, this encoded component is excited by the third 90°, and an equivalent phase accumulation occurs to create
| (5) |
The STE amplitude is the average of Mfinal across the phase profile (Mfinal,y integrates to zero),
| (6) |
or half the amplitude of M⃗0.
The modulation of the STE amplitude in φ(x⃗, f) places certain practical requirements on the STE. Relying on phase dispersion from chemical shift and off-resonance (Δf) is generally not sufficient for proper averaging, provides no diffusion sensitivity, and requires relatively long ΔT intervals. Thus an encoding gradient is used to create the phase dispersion, and should do so such that at least several complete 2π modulations are created across the voxel size. Done properly, this creates equivalent averaging of the STE amplitude profile across the imaging and spectral dimensions. This also spoils unwanted free-induction decay (FID) components that are excited by the final 90° which have no motion sensitivity.
B. Super Stimulated-Echo
One proposed approach to increase the amplitude of the STE is to use trains of RF pulses to create a super stimulated-echo (super-STE) [23], [24]. This is achieved by replacing the initial 90°-90° pair with an RF pulse train that is designed to create a square-wave modulation in Menc,z:
| (7) |
where the square-wave modulation is defined as,
| (8) |
and illustrated in Fig. 1B. This ideal case has no encoding loss in magnetization because, unlike the sinusoidal encoding (Eq. 3), all spins are left encoded along MZ. The oscillations as a function of φ(x⃗, f) preserve the spatial encoding for motion sensitivity and contrast evolution during the mixing time (TM). In reality, the pulse train must be of finite duration so
| (9) |
where Q̂ (·) is an approximation to Q(·) with non-zero transition widths between the +1 and −1 encoding bands, and εx(·), εy(·) are residual transverse magnetization that is suppressed by the TM crusher gradients.
If the final excitation pulse is a 90°, then
| (10) |
Again, Mfinal,y integrates to zero. In the ideal case Q̂ (·) = Q(·), the refocused component in Mfinal,x is now 0.64 (same as Equation 4), an improvement of 28% over the conventional STE.
The amplitude can further be increased by replacing the final 90° with a pulse train that also produces an approximate square-wave modulation, as illustrated in Fig. 1C. When matched to the initial square wave, the result is:
| (11) |
where Q̂ex(·) is the excitation modulation with frequency refocusing and ζy(·), ζz(·) are undesired residual magnetization. All magnetization is refocused in the ideal case, a 100% improvement over the conventional STE.
C. Stimulated-echo Preparation
Another approach that is beneficial for diffusion and perfusion-sensitive hyperpolarized 13C is to apply two identical pulse trains as a magnetization preparation scheme [32], which is illustrated in Fig. 1D. In this super stimulated-echo preparation (super-STEP), the magnetization is refocused by the second pulse train, but left along MZ and not MX as before. Following this refocusing onto the longitudinal axis, any imaging sequence can be applied, during which there will be no additional motion sensitivity. This is particularly advantageous when the imaging duration is long relative to TM, in which case there can be blurring due to the continued motion sensitivity during a STEAM. A preparation approach is highly advantageous for hyperpolarized 13C, where only a single STE/super-STE encoding is feasible because the magnetization is perturbed substantially from equilibrium. Furthermore, 3D 13C MRSI acquisitions are typically long relative to TM.
A super-STEP is implemented by simply replacing the final excitation pulse by the initial super-STE RF pulse train. This leaves the magnetization refocused and along MZ,
| (12) |
and the motion-related weighting that evolved during the mixing time is frozen.
D. Encoding Strength (b-value)
For a conventional STE, the resulting data is diffusion-weighted as (assuming isotropic diffusion)
| (13) |
where the b-value characterizes the encoding strength:
| (14) |
where Δ is the duration between the leading edges of the encoding gradients and δ is the gradient duration [19]–[21]. Neglecting encoding gradient ramps, we can rewrite this as
| (15) |
where Tdead = Trf + Tw is the encoding gradient dead time around the RF subpulses, including the pulse duration, Trf, and any additional dead time, Tw, that could include spatial selection gradients (not shown) or be used to minimize coil ringing and eddy current artifacts.
The diffusion sensitivity of the pulse train in a super-STE can be calculated using the extended phase graph (EPG) calculus, as described in [33], [34]. In a super-STE, the pulses are equally spaced and have identical gradients applied between, thus the EPG states observed are
| (16) |
| (17) |
for integer n up to the number of pulses used. The diffusion-weighting can be calculated by including a diffusion operator, as described by Eq. 10 in [34]:
| (18) |
where, for the super-STE, bn has two forms (Eq. 11 in [34]):
| (19) |
for Fn when the encoding gradient is applied (operator applied prior to transition from Fn to Fn+1); and
| (20) |
(over an interval τ) for Zn, and for Fn when no encoding gradient is applied (TM and Tdead). The diffusion-weighted echo amplitude is described by the final F0 component, and can be represented as a weighted sum of exponentials:
| (21) |
for weightings, Am, and exponential coefficients, km, that are pulse train dependent. This approach allows for rapid numerical calculation of the diffusion-weighting for a given super-STE pulse train. The Appendix includes further analysis and an approximation of this weighting into a single beff -value to enable comparisons with SE and STE approaches.
Note that these definitions of bn assume a constant amplitude gradient shape. However, ramped gradients can readily be incorporated by using a general definition for bn as described by Eqs. 22 (anisotropic diffusion) and 25 (isotropic diffusion) in [34]. For the range of gradient and RF timings used, using constant as compared to trapezoidal gradient shapes in these calculations results in less than 5% difference in bn for the worst case parameters, and the timings used in the majority of experiments had less than 1% difference. Reference [34] also includes more details of the EPG including how to incorporate for anisotropic diffusion. For the super-STEP approach, the final diffusion-weighting is expressed in the Z0 state as opposed to the F0 state.
III. Methods
A. Pulse Train Design
To implement the super-STE, a RF pulse train must be designed to create an approximate square-wave modulation in MZ. We propose an approach using gapped inversion pulses. To illustrate this method, consider the conventional 90°-90° encoding as a gapped 180° hard pulse with two discrete samples, where sampling a pulse creates periodic repetitions of the pulse profile at 1/ΔT, as in Fig. 2A. Using the Fourier Transform to approximate Menc of the 90°-90° yields repetitions of a sinc profile with a bandwidth of 1/(2ΔT). (The difference from this result, as shown in Fig. 2A, is because the Fourier Transform approximation breaks-down for large-tip pulses.) To design a super-STE, we note that the target profile of a selective inversion pulse is a single-lobe of a square-wave modulation. Creating an RF pulse train by gapping samples of a selective inversion pulse will thus create an approximation to a square-wave modulation for a super-STE (Fig. 2B). The inversion pulse is designed with a bandwidth of 1/(2ΔT), and the gapping of samples creates periodic repetitions at 1/ΔT. By applying gradients between the samples, this periodic off-resonance profile can be converted into a spatial profile as well. In other words, the B0 off-resonance profile of the continuous pulse is converted into a periodic spectral and spatial modulation pattern, Q̂ (φ(x⃗, f)).
Fig. 2.

Comparison of continuous pulses (dashed) and gapped pulse trains (solid lines) magnetization profiles. (A) Rectangular 180° and 90°-90° (conventional STE encoding). (B) Hyperbolic secant (sech) 180° inversion pulse and its gapped pulse train version (super-STE encoding) which creates a square-wave in MZ. The real and imaginary RF components are black and gray, respectively. (C) Sech super-STE profile, Q̂(φ(x⃗, f)), in response to B1 variations. The profile deviates noticably when there is 60% of the nominal B1 ampliude, but is practically indistinguishable from the nominal response for 80%, 120% (not shown), and 140% (not shown) amplitudes. (D) Gapped pulse train off-resonance profile for rectangular subpulses. The pulse train profile (solid lines) reflects the modulation of Q̂ (φ(x⃗, f)) by the subpulse profile (dashed lines). The profile depends on the subpulse shape and Trf/ΔT. The subpulse profile was calculated in the small-tip regime and scaled appropriately.
The advantage of this super-STE implementation is that it leverages selective inversion pulse design tools. This includes using the Shinnar-Le Roux (SLR) transform [35] and as well as adiabatic pulse shapes. The advantage of using the SLR is that it is precise, and can use finite-impulse response (FIR) filter design methods to create efficient pulse trains with a low number of samples. In this design method, the pulse duration is NΔT and bandwidth is 1/(2ΔT), so the time-bandwidth product (TBW) is N/2. For the pulse designs shown, the ripple was minimized to maximally preserve magnetization.
Using a gapped adiabatic inversion pulse approach will be more tolerant of B1 variations than the SLR, and has been demonstrated in 2D-selective adiabatic designs [36] as well as for B1-insensitive fast spin-echo excitation [37]. The B1 robustness is also beneficial for hyperpolarized 13C, where the equilibrium endogenous 13C signal is too small for accurate RF calibration. Our pulse train designs used the hyperbolic secant (sech, HS) pulse modulation [38]:
| (22) |
| (23) |
The B1 robustness is demonstrated by simulations in Fig. 2C. Other beneficial adiabatic pulse shapes include the sechn (HSn) [39] and the numerically optimized modulation (NOM) method [40]. In our experience, sechn shapes provided poor selectivity with low numbers of samples (N < 6), but NOM may be particularly beneficial in this regime.
The design of the subpulses used in the pulse train will effect the off-resonance profile, which is illustrated in Fig. 2D. The finite duration of individual subpulses introduces off-resonance sensitivity. The super-STE pulse train is the convolution of the gapped inversion RF pulse samples with the subpulse shape, and thus the Menc,Z profile will be approximately a multiplication of Q̂ (φ(x⃗, f)) by the Fourier transform of the subpulse shape. This is verified by the subpulse and pulse train profiles in Fig. 2D, which reflect the rectangular subpulse shape used in our designs. Other subpulse shapes could also be used, such as a sinc or Gaussian. Our experiments used rectangular subpulses with Trf ≤ 0.35 ms that have < 2% variation in amplitude across the spectral range of 650 Hz required from [1-13C]-lactate to 13C-urea at 3T.
In the super-STE pulse train excitation approach (Fig. 1C), the MX profile of the train, Q̂ex(·), must oscillate between +1 and −1. This can be done with the SLR by first designing an excitation pulse with a central band of amplitude sin α (for the general case of α ≤ 90°) with a width of 1/(2ΔT), and a outer band of amplitude −sin α. Gapping produces an approximate square-wave excitation. As with the encoding pulse train, the TBW is N/2 for N pulses. (The excitation requires an odd N in the filter design.) One disadvantage to this approach is that the refocused echo time is during the excitation pulse train. This can result in substantial first-order spectral phase accumulation by the end of the pulse train, which can be eliminated by adding a spin-echo pulse for the acquisition.
Figure 3 and Table I compare simulations of the conventional STE acquisition with the super-STE methods shown in Fig. 1. We attempted to match the SLR and sech pulses as close as possible, each with ΔT = 3 ms and N = 18 samples. The SLR pulse was linear-phase with a TBW = 9, while the sech had a μ = 4 and β = 0.034. The SLR design had an optimal transition width that was narrower than the sech, resulting in slightly higher fractions of preserved magnetization. Designing an optimized sech was more difficult because, to the best of our knowledge, there are not exact parameter definitions to minimize the transition widths for a given pulse duration and bandwidth. Furthermore, the sech, which ideally is continuous, may break down due to discretization with small N.
Fig. 3.

Comparison between different encoding pulse trains (left), combined with different refocusing methods (right - only refocused signal components shown). Both super-STE designs outperform the conventional 90°-90° by storing more magnetization in MencZ (left). Both the super-STE excitation and and STEP improve the signal, with the final magnetization refocused along MX or MZ. (The schemes from Fig. 1A,B are shown in “90° Excitation”, Fig. 1C in “Super-STE Excitation”, and Fig. 1D in “STEP”).
TABLE I.
Fractional signal losses between different encoding and refocusing methods shown in Fig. 3. The values were obtained by normalized integration of the magnetization profiles.
| Menc | Mfinal 90° (XY) | Mfinal super-STE 90° (XY) | Mfinal STEP (Z) | |
|---|---|---|---|---|
| 90-90 | 0.64 | 0.50 | 0.63 | 0.50 |
| Ideal super-STE | 1 | 0.64 | 1 | 1 |
| SLR super-STE | 0.91 | 0.62 | 0.86 | 0.86 |
| sech super-STE | 0.86 | 0.61 | 0.83 | 0.80 |
B. Experiments
The duration and amplitude of the STE encoding gradient was chosen to provide at least several 2π cycles of phase accumulation, φ(x⃗, f), across the largest voxel dimension, Δx, to average the STE modulation. This can be characterized by rewriting Eq. 2 at f = 0 as
| (24) |
where fG is the spatial encoding frequency and G⃗u is a unit vector in the applied gradient direction. Choosing 1/fG ≪ Δx will satisfy the modulation averaging requirement.
Phantom studies were performed using 0.7 mL of 8 M 13C-urea inside of a sealed 1 mL syringe, which was doped with gadolinium to reduce the relaxation times to T2 = 195 ms and T1 = 1.0s. All acquisitions were done with a TR = 5 s. Each RF pulse was identically scaled to assess the B1 response. The STEAM/super-STEAM experiments used encoding gradients with a magnitude of 0.76 G/cm applied on the Z axis, ramp time of 560 μs and 1 ms plateau; fG = 0.13 1/mm; TM = 14 ms; Trf = 0.16 ms; Tw = 0.72 ms; and diffusion-weightings of b = 0.068 s/mm2 (90-90), beff = 0.108 s/mm2 (super-STE 180s-90, N = 18). The super-STEP experiments used encoding gradients with a magnitude of 1.0 G/cm applied on the Z axis, ramp time of 560 μs and 1 ms plateau; fG = 0.17 1/mm; TM = 7 ms; Trf = 0.16 ms; Tw = 0.72 ms; and beff = 0.182 s/mm2.
All animal studies were carried out under a protocol approved by our Institutional Animal Care and Use Committee. Experiments were performed on a GE 3 T clinical MRI system (GE Healthcare, Waukesha, WI, USA) with 40 mT/m, 150 mT/m/ms gradients and a broadband RF amplifier. A custom built, dual-tuned mouse birdcage coil was used for RF transmission and signal reception [41]. A compound consisting of [1-13C] pyruvic acid and the trityl radical (GE Healthcare, Oslo, Norway) was polarized in a HyperSense DNP system (Oxford Instruments, Abingdon, UK) at 3.35 T and a temperature of 1.3° K. The hyperpolarized pyruvate was dissolved to 80 mM (mice) or 100 mM (rats), and 350 μL (mice) or 2.2 mL (rats) of this solution was injected into the animals over 12 seconds. An aliquot was taken and injected into a polarimeter to measure the percent polarization. The pH was monitored using the aliquot and other excess pyruvate. In one experiment, a compound consisting of 99% 13C-urea (Sigma-Aldrich, St. Louis, MO) in glycerol (6.4 M) with the trityl radical OXO63 (23 mM) (Oxford Instruments, UK) was co-polarized simultaneously with [1-13C] pyruvate [42]), and dissolved to 115 mM.
Experiments were performed with normal rats and mice to evaluate the performance of the pulses. 3D EPSI experiments were acquired in 8 sec with 10 mm (rats, STEAM/super-STEAM comparison) or 5 mm (mice, STEAM/super-STEP comparison) isotropic resolution (=Δx) and a 8×8×16 matrix. Images were acquired using the FID, a conventional STEAM (Fig. 1A), super-STEAM encoding (Fig. 1B), and a super-STEP (Fig. 1D). For the STEAM and super-STEAM encoding, a single encoding step was used followed by a series of excitations [43], whose flip angles were ramped in time to use up the majority of the hyperpolarized magnetization [44]. In the STEAM and super-STEAM comparison, both experiments used encoding gradients with a magnitude of 4.3 G/cm (2.5 G/cm applied simultaneously on all three axes), ramp time of 560 μs and 160 μs plateau; fG = 0.33 1/mm; TM = 7 ms; Trf = 0.35 ms; Tw = 0 ms; and b = 0.037 s/mm2 (STEAM), and beff = 0.076 s/mm2 (super-STEAM). In the STEAM and super-STEP comparison, the encoding gradients had a magnitude of 2.0 G/cm (STEAM) and 4.0 G/cm (super-STEP), applied on the z-axis, ramp time of 560 μs and 1720 μs plateau; fG = 0.49 1/mm (STEAM) and fG = 0.98 1/mm (super-STEP); TM = 1.05 s (STEAM) and TM = 1.0 s (super-STEP); Trf = 0.16 ms; Tw = 0 ms; and b = beff = 9.95 s/mm2 (STEAM and super-STEP).
Experiments were performed in normal mice, a transgenic adenocarcinoma of mouse prostate (TRAMP) mouse model, and a Tet-o-MYC/LAP-tTA double transgenic mouse model of liver cancer to explore the contrast in tumors. Two 3D MRSI experiments were acquired in each animal, one using the FID signal (“control”) and the other with a super-STEP. The acquisitions used a compressed sensing 3D MRSI, with a pseudo-random sampling pattern and non-linear reconstruction [13]. The data had 16×16×16 spatial matrix, 2.5×2.5×5.4 mm (0.034 cc) voxels (Δx = 5.4 mm), and was acquired in 16 sec, a 3.37-fold acceleration. For the super-STEP, a sech pulse train from Figure 3 and Table I was used with N = 18, the encoding gradients had a magnitude of 6.9 G/cm (4.0 G/cm applied on all axes), ramp time of 560 μs and 1720 μs plateau; fG = 1.7 1/mm; TM = 1.0 s; Trf = 0.16 ms; Tw = 0 ms; and beff = 119.4 s/mm2.
Statistical analysis was performed using paired t-tests in order to compare acquisitions. This controlled for both interanimal variations (respiration, vascularization, bolus size and delivery) and inter-experiment variability (pyruvate polarization, coil loading, flip angle calibration). The t-test statistics were adjusted for multiple comparisons on the same group by applying a Holm-Sidak step-down procedure in order to reduce the rate of false positives.
IV. Results
Figure 4 shows simulated pulse train performance results in the presence of relaxation and diffusion. A primary tradeoff in the super-STE is between the pulse train length and T2 decay. Using longer pulse trains better approximates a square-wave and preserves more magnetization, but there is also increased T2 decay which can negate the improvements in magnetization preservation. For ΔT/T2 > 0.5 with an SLR train design as shown in (Fig. 4A), there is less than 10% gain by using a super-STE. The gain is much greater for smaller ΔT/T2. For example, at ΔT/T2 = 0.1, going up to 18 pulses in the train still provided improved signal.
Fig. 4.

Simulated Menc preserved for SLR super-STE designs with various numbers of pulses. (T1 = ∞. N = 2 is conventional 90°-90° STE.) (A) As the pulse train length increases, T2 decay can outweigh the improved encoding efficiency. (B) Diffusion-weighting as a function of normalized diffusion (Eq. 21). This assumed isotropic diffusion and Tdead = 0 for two different mixing time durations (solid/dashed). As expected, there is more diffusion-weighting for longer pulse trains, although the super-STE shape is more complex than the STE. The SLR and sech train designs also vary, particularly at larger diffusion coefficients.
Another tradeoff in the super-STE pulse train design is the diffusion-weighting, which can be represented by a sum of exponentials (Eq. 21). Simulation results for isotropic diffusion using an EPG are shown in Fig. 4B. (The anisotropic tensor response can be derived as in [34]). Most notably, the longer pulse trains have generally more rapid signal loss as a function of D and a clearly different shape from the STE. See the Appendix for an analysis of the trade-offs of T2 decay and diffusion-weighting for typical relaxation rates, as well as a comparison to spin-echo diffusion.
Phantom tests (Fig. 5) showed that the super-STE encoding, with a gapped SLR and sech inversion pulse train design, had improved SNR over the STE for B1 ±20% the nominal amplitude. Using the STEP approach resulted in further SNR improvements over STE and super-STE encoding alone. The sech pulses had better B1 performance than the SLR pulses, as expected. However, at the desired B1, the SLR pulses performed slightly better, which was expected based on our difficulty optimizing the sech design. The sech profiles are slightly assymetric because these pulse trains are partially B1-insensitive above, but not below, the sech adiabatic threshold (also shown in Fig. 2C). Additional shifts between the simulated and measured profiles are a result of slight RF pulse power miscalibrations. Eddy currents, which accumulate constructively throughout the pulse train and are a common problem in diffusion-weighting imaging, and vibrational motion from the multiple gradient lobes could cause signal loss with in the super-STE pulse trains. Additional phantom experiments using maximal gradient strengths on all axes (not shown) caused up to 25% signal losses due to eddy currents and vibration.
Fig. 5.

Phantom tests of the B1 response for STE and super-STE. (A) Comparison for various STEAM encoding schemes (Fig. 1A,B). (B) Comparison for various STEP schemes (Fig. 1D). The dashed lines are simulated profiles and X’s are acquired data, corrected for T2 relaxation of the phantom. Note that the simulation curves include B1 variations for all pulses, including the excitation pulses.
We compared a conventional STEAM (Fig. 1A) and super-STEAM encoding (Fig. 1B) approaches in vivo (Fig. 6A) and found an average voxel-wise signal increase of 27% (29% pyr, 24% ala, 21% lac), which was statistically significant (p < .01) for each metabolite. Based on simulations, we predicted a 27.3% signal increase, which is in close agreement considering the potential physiologic and polarization differences. The metabolite amplitudes were also highly correlated (R2 = 0.75 for linear fit across all metabolites), indicating there was no difference in contrast between the two approaches. We also compared STEAM (Fig. 1A) and STEP (Fig. 1D) approaches (Fig. 6B), and found an average voxel-wise increase in signal of 49% (66% pyr, 25% ala, 44% lac), which was statistically significant (p < .01) for each metabolite. A 60% signal increase was predicted based on simulations. There was a slightly weaker correlation (R2 = 0.70 for linear fit across all metabolites) and also more variation between metabolites. This variability between experiments is likely due to diffusion sensitivity that accumulates during the STEAM MRSI acquisition versus the STEP, which freezes the diffusion weighting prior to the acquisition.
Fig. 6.

In vivo comparison between conventional and super STE methods. (A) Metabolite amplitudes for conventional STEAM (Fig. 1A) and super-STEAM encoding (Fig. 1B, sech 180°, ΔT = 1.65ms, N = 12), normalized by the measured polarization, in a normal rat. The least-squares linear fits show the metabolite amplitude correlation between the two experiments, demonstrating that the contrast was similar. (B) STEAM (90°-90°) and super-STEP metabolite amplitudes (b = beff = 9.95 s/mm2), normalized by polarization, in a normal mouse. Again, the linear fits show reasonable correlation. Using the super-STEAM encoding and super-STEP approaches had significantly increased SNR.
When applied to a transgenic prostate cancer model (TRAMP), the STEP approach improved the contrast for tumor lactate (Figs. 7 and 8), which is a putative cancer biomarker. In the color overlays (Fig. 7), some high lactate in the gut is suppressed and the tumor lactate is the largest metabolite in the STEP. In this acquisition, the encoding strength (beff = 119.4 s/mm2) and mixing time (TM = 1 s) were chosen such that they would suppress flowing metabolites in both the vasculature and microvasculature. The improved tumor lactate delineation is reflected by the significant increase in both the lactate to pyruvate ratio within the tumors (Fig. 8B) and ratio of peak tumor lactate to peak kidney/liver lactate (Fig. 8C). This indicates that the lactate observed in vivo in kidney and liver tissue may have had a larger vascular fraction than the lactate within tumor tissue. The pyruvate was the most attenuated of all metabolites, which implies that it is more concentrated in the vasculature compared to the lactate and alanine observed.
Fig. 7.
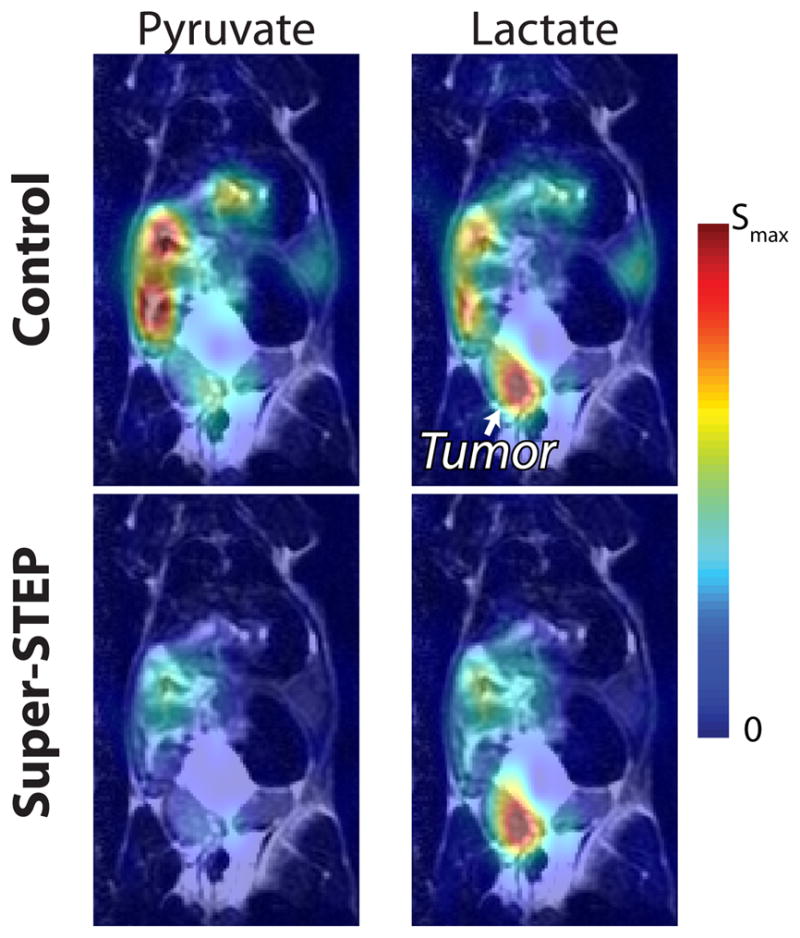
Representative TRAMP 13C data overlays with and without a super-STEP (beff = 119.4 s/mm2). The STEP highlights the lactate in the tumor.
Fig. 8.

(A) The average metabolite amplitudes across several organs in normal (N = 4) and transgenic prostate tumor mice (N = 4) show how the distribution is affected by the super-STEP (beff = 119.4 s/mm2). The tumor lactate was the largest metabolite signal across the entire animal. The preparation significantly suppressed metabolites in the kidneys and liver (* indicates p < .05). The delineation of prostate tumors (squares) and liver tumors (circles) was significantly improved with the STEP, as measured by the (B) mean lactate : pyruvate in the tumors (p < .05) and (C) the maximum tumor lactate : maximum normal tissue lactate (p < .05), where the kidneys and liver were used for a normal tissue reference.
Initial results in a liver tumor model have also shown similar improvements in tumor lactate contrast (Fig. 9, circles in Fig. 8B,C). The tumor had elevated lactate with no preparation pulses, but the delineation improved with super-STEP. Alanine also showed improved delineation of the tumor in this animal. The pyruvate distributions were relatively similar. The perfusion agent 13C-urea [2] was polarized and imaged simultaneously in this study, and also showed better localization to the tumor with the STEP. This indicates the urea was better perfused into the tumor tissue than elsewhere in the liver.
Fig. 9.

Preliminary liver tumor model 13C data overlays with and without a super-STEP (beff = 119.4 s/mm2). (Color scale is same as Fig. 7.) In this experiment, 13C-urea was co-polarized with [1-13C]-pyruvate and both compounds were injected. As in the TRAMP, the STEP highlights the lactate in the tumor. The urea signal is also better localized to the tumor with the perfusion weighting, suggesting it is better perfused into the tumor tissue compared with other tissues.
V. Discussion
In this paper, we have presented a new perspective and design approach for the super-STE, as well as demonstrated a potential application in hyperpolarized metabolic MRI. Simulations of the super-STE diffusion signal decay (Fig. 4) and peak SNR for various tissue types (Fig. 10) presented in this paper provide a framework for understanding the super-STE and informing future applications. Additional experimental validations of these results would be valuable prior to diffusion-weighted imaging applications.
Fig. 10.

Simulation comparison between SE, STE and super-STE diffusion sequences, assuming a typical clinical system maximum gradient strength of 4 G/cm, neglecting gradient ramps, and a single-exponential model for the super-STE (Eq. 26). (A) For hyperpolarized 13C-pyruvate imaging with estimated in vivo relaxation rates. The dashed gray lines indicate the approximate b-value threshold where a super-STE approach is advantageous over a SE. The colored dashed lines demonstrate key tradeoffs: (left) The STE and super-STE have less signal as T1 is shortened due to mixing time relaxation. (right) Increased RF pulse dead-time reduces signal for all sequences, and the loss is greater in the super-STE due to a larger number of pulses used. (B) 1H diffusion for several tissue types with Tdead = 2 ms. For skeletal muscle and cartilage, which have shorter T2s, the super-STE is advantageous for large b-values.
In the STE experiments that did not use a preparation scheme (ie multiple refocusings of Menc), the approximate b-value can increase by more than 10-fold over the course of the 8 sec acquisition. The mixing time (TM in Eqs. 15 and 26) becomes much larger than the δ or Tdead terms, and thus linearly scales b across the acquisition order. This will result in a non-uniform k-space weighting which ultimately leads to image blurring in the presence of perfusion and diffusion. On the other hand, the STEP approach has a b-value which is the same throughout the following acquisition. This is the primary reason that we have adopted a preparation-based approach with the super-STE.
Sources of potential errors in the super-STE pulse trains include motion and eddy currents. The chance of motion artifacts increases with the pulse train length, N. The super-STE relies on coherent rotations from the subpulses, which will become incoherent with motion during the pulse train. Our pulse trains were designed to be ≤ 52 ms in duration in order to reduce artifacts, and this additional tradeoff should be considered in super-STE pulse train design. Our phantom experiments also indicated that eddy currents, which accumulate constructively throughout the pulse train, could cause additional signal loss during the pulse train. This can be alleviated by standard methods such as gradient pre-compensation or additional dead-time around RF subpulses. Some possible super-STE specific approaches include reversing the polarity of subsequent gradients to cancel out eddy currents or, if spatial selection is desired, leaving the gradient on during the subpulses to reduce switching-induced eddy currents.
The matched excitation pulse train very efficiently uses the magnetization, as shown in the simulations. It does not freeze the weighting as in the STEP approach, but could be beneficial if only a few excitations were required. Using this pulse may also require an accurate refocusing pulse, particularly for spectroscopy, because substantial linear phase in frequency can accrue during the long excitation pulse train.
Prior work has used the transition between pseudo steady states (TRAPS) mechanism [45] and an extended phase graph (EPG)-based algorithm [46], [47] to design super-STE pulse trains. In this approach, the flip angles are solved for sequentially to put approximately all of the magnetization in Zk states (k ≠ 0), which represents the periodic MZ components. The design selects for the most populous states in the 0° static pseudosteady state (SPSS) to increase the magnetization stored for the super-STE. Using a gapped SLR inversion pulse design similarly minimizes the transition regions and ripple to increase this storage, and we expect very comparable performances between these two approaches. One disadvantage using SLR and adiabatic designs is that they begin to perform poorly for a low number of pulses (about N < 6), and in this case the EPG algorithm maybe advantageous. Adiabatic-based trains have the advantage of inherent robustness to B1 variations. In the EPG approach, minimum power solutions have generally been selected for in the over-determined system [45], [46], but it maybe possible to instead select for solutions with greater B1 insensitivity.
The pulse trains can be adapted to be slice selective because they are equivalent to a spectral-spatial RF pulse. We have described the spectral portion of the design, which is readily incorporated into established methods for large flip-angle and adiabatic spectral-spatial designs [36], [48].
VI. Conclusion
In this project we have developed and applied a super stimulated-echo preparation (super-STEP) sequence for diffusion and flow encoding with hyperpolarized 13C. The super-STE uses a RF pulse train to provide improved SNR over the conventional STE. We have introduced a new super-STE pulse train design approach using inversion pulse design methods, which allows for adiabatic pulse shapes that are more robust to RF transmit field variations. The magnetization preparation approach leaves the magnetization refocused longitudinally but with the desired diffusion and flow sensitivity. There is no additional motion encoding during the imaging sequence. This reduces blurring artifacts compared to a hyperpolarized STEAM, since the spins decay and can only support a single encoding step. When applied to murine transgenic cancer models following injection of hyperpolarized [1-13C]-pyruvate, this approach led to improved delineation for tumors by suppressing vascular metabolites and highlighting those perfused into the tissue.
Acknowledgments
The authors would like to acknowledge Kristen Scott, Dr. Robert Bok, Dr. Cornelius Von Morze, Dr. Simon Hu, and Peter Shin for assistance performing the experiments, Dr. James Tropp for the 1H/13C mouse coil, as well as Dr. Dimitrios Karampinos and Dr. Kayvan Keshari for valuable discussions. This work was supported by an American Cancer Society Postdoctoral Fellowship (grant #PF-09-036-01-CCE), NIH grants (K99-EB012064, P41-EB013598, R01-EB007588 & R01-CA111291), and UC Discovery Grant ITLbio04-10148 with GE Healthcare.
Appendix: Comparison of Diffusion-Weighted Pulse Sequences
As demonstrated in Fig. 4, the increased encoding efficiency of the super-STE also comes with increased signal losses due to T2 and diffusion. In this Appendix, we use simulations to provide an approximate comparison between the SE, STE, and various super-STE pulse train lengths for diffusion-weighted imaging.
In order to simplify this comparison, we used a single exponential approximation of the super-STE diffusion weighting. Figure 4B shows that for the SLR train design and attenuation factors greater than 10−2, the diffusion weighting is approximately a single exponential. Focusing on this regime is justified for most experiments because greater attenuation would require relatively large SNRs in excess of 100 often not seen in MRI/MRSI. (For a b-value of 6, 000 s/mm2, which is relatively large for typical clinical diffusion imaging, the attenuation is 0.015 for D = 0.7 × 10⁻³ s/mm2, the approximate apparent diffusion coefficient brain matter.) Thus we assume:
| (25) |
| (26) |
where Sδ, Sdead, and SM are scaling factors to account for the gradient duration, RF wait duration, and mixing time, respectively. The scaling factors were determined by EPG simulations, and the single exponential model was validated to be reasonable over a range of N with the SLR design and for attenuations > 10−2.
Using this model, we compared the maximum expected signal for optimized SE, STE, and super-STE diffusion pulse sequences up to b, beff values of 10,000 s/mm2. For optimal efficiency, we assumed diffusion encoding gradients were applied as soon as possible following any RF pulses, although relaxation and diffusion during the finite pulse dead times (Tdead) were included. The SE signal is deterministic for a given b and depends on T2. In the STE and super-STE, there is T1 decay during the mixing time. Bloch simulations including relaxation were combined with a numerical search in order to find optimal δ and TM with maximal signal for STE sequences.
For [1-13C]-pyruvate diffusion imaging with clinical gradients and RF hardware, our simulations estimate that the super-STE will have improved performance for large b-values (Fig. 10A). These are based on previous relaxation estimates for 13C molecules of interest (pyruvate, lactate, and alanine) to have T2 between 100 ms and 1.5 s (3 T) [49], and T1s of approximately 30 s (9.4 T) [7] in vivo. At the b, beff threshold where the super-STE is advantageous (dashed lines), the pulse sequences had a b = 18 s/mm2, with parameters δ = 14.7 ms (SE) and δ = 1.5ms, TM = 1.00 s (super-STE N = 30) for the shorter T2 value (left, Fig. 10A), and b = 3000 s/mm2 with δ = 84.3 ms (SE) and δ = 14.3ms, TM = 1.51 s (super-STE N=30) for the longer T2 (right, Fig. 10A). As another example, at b = 1000 s/mm2, using a super-STE pulse train of N = 30, we estimate a 77 % signal increase over a SE (and 40 % over a STE) assuming T2 = 100 ms. It is, in particular, the long T1 values for the 13C molecules combined with their low gyromagnetic ratio that make the super-STE approach beneficial for this application.
For proton diffusion imaging at 3T (Fig. 10B), our simulations indicated a STE/super-STE approach would have improved performance for some tissues at large b-values. In particular, the shorter T2 tissues (muscle, cartilage) showed that super-STE pulse trains up to length N = 10 would provide a 10–20% improvement in SNR for b-values from 500– 5,000 s/mm2 (muscle) and 300–2,000 s/mm2 (cartilage). For this application, the shorter T1 values means that less TM can be used in super-STE sequences, and the higher gyromagnetic ratio allows for higher SE b-values with shorter TEs than with 13C.
On pre-clinical imaging systems, where stronger gradients are available, additional simulations (not shown) indicated that only very high b-value 13C diffusion imaging might benefit from a super-STE. (For a maximum gradient amplitude of 100 G/cm, T1 = 30 s, T2 = 100 ms, and Tdead = 1 ms, a super-STE with N = 30 had higher signal only for b > 5800 s/mm2.) For 13C with longer T2 values and for 1H in the tissues shown in Fig. 10B, the SE had the highest expected signal for b ≤ 10, 000 s/mm2.
References
- 1.Ardenkjaer-Larsen JH, Fridlund B, Gram A, Hansson G, Hansson L, Lerche MH, Servin R, Thaning M, Golman K. Increase in signal-to-noise ratio of > 10,000 times in liquid-state NMR. Proc Natl Acad Sci U S A. 2003;100(18):10 158–10 163. doi: 10.1073/pnas.1733835100. [DOI] [PMC free article] [PubMed] [Google Scholar]
- 2.Golman K, Ardenkjaer-Larsen JH, Petersson JS, Mansson S, Leunbach I. Molecular imaging with endogenous substances. Proc Natl Acad Sci U S A. 2003;100(18):10 435–10 439. doi: 10.1073/pnas.1733836100. [DOI] [PMC free article] [PubMed] [Google Scholar]
- 3.Golman K, in‘t Zandt R, Thaning M. Real-time metabolic imaging. Proc Natl Acad Sci U S A. 2006;103(30):11 270–11 275. doi: 10.1073/pnas.0601319103. [DOI] [PMC free article] [PubMed] [Google Scholar]
- 4.Kurhanewicz J, Vigneron DB, Brindle K, Chekmenev EY, Comment A, Cunningham CH, DeBerardinis RJ, Green GG, Leach MO, Rajan SS, Rizi RR, Ross BD, Warren WS, Malloy CR. Analysis of cancer metabolism by imaging hyperpolarized nuclei: Prospects for translation to clinical research. Neoplasia. 2011 Feb;13(2):81–97. doi: 10.1593/neo.101102. [DOI] [PMC free article] [PubMed] [Google Scholar]
- 5.Chen AP, Albers MJ, Cunningham CH, Kohler SJ, Yen Y-F, Hurd RE, Tropp J, Bok R, Pauly JM, Nelson SJ, Kurhanewicz J, Vigneron DB. Hyperpolarized C-13 spectroscopic imaging of the TRAMP mouse at 3T–initial experience. Magn Reson Med. 2007;58:1099–1106. doi: 10.1002/mrm.21256. [DOI] [PubMed] [Google Scholar]
- 6.Albers MJ, Bok R, Chen AP, Cunningham CH, Zierhut ML, Zhang VY, Kohler SJ, Tropp J, Hurd RE, Yen YF, Nelson SJ, Vigneron DB, Kurhanewicz J. Hyperpolarized C-13 lactate, pyruvate, and alanine: Noninvasive biomarkers for prostate cancer detection and grading. Cancer Res. 2008;68(20):8607–8615. doi: 10.1158/0008-5472.CAN-08-0749. [DOI] [PMC free article] [PubMed] [Google Scholar]
- 7.Day SE, Kettunen MI, Gallagher FA, Hu DE, Lerche M, Wolber J, Golman K, Ardenkjaer-Larsen JH, Brindle KM. Detecting tumor response to treatment using hyperpolarized 13C magnetic resonance imaging and spectroscopy. Nat Med. 2007;13(11):1382–1387. doi: 10.1038/nm1650. [DOI] [PubMed] [Google Scholar]
- 8.Park I, Larson PEZ, Zierhut ML, Hu S, Bok R, Ozawa T, Kurhanewicz J, Vigneron DB, VandenBerg SR, James CD, Nelson SJ. Hyperpolarized 13C MR metabolic imaging: application to brain tumors. Neuro Oncol. 2010 Feb;12(2):133–44. doi: 10.1093/neuonc/nop043. [DOI] [PMC free article] [PubMed] [Google Scholar]
- 9.Schroeder MA, Cochlin LE, Heather LC, Clarke K, Radda GK, Tyler DJ, Shulman RG. In vivo assessment of pyruvate dehydrogenase flux in the heart using hyperpolarized carbon-13 magnetic resonance. Proc Natl Acad Sci U S A. 2008;105(33):12 051–12 056. doi: 10.1073/pnas.0805953105. [DOI] [PMC free article] [PubMed] [Google Scholar]
- 10.Merritt ME, Harrison C, Storey C, Jeffrey FM, Sherry AD, Malloy CR. Hyperpolarized 13C allows a direct measure of flux through a single enzyme-catalyzed step by NMR. Proc Natl Acad Sci U S A. 2007;104(50):19 773–19 777. doi: 10.1073/pnas.0706235104. [DOI] [PMC free article] [PubMed] [Google Scholar]
- 11.Kettunen MI, Hu D, Witney TH, McLaughlin R, Gallagher FA, Bohndiek SE, Day SE, Brindle KM. Magnetization transfer measurements of exchange between hyperpolarized [1-13C]pyruvate and [1-13C]lactate in a murine lymphoma. Magn Reson Med. 2010;63(4):872–880. doi: 10.1002/mrm.22276. [DOI] [PubMed] [Google Scholar]
- 12.Dafni H, Larson PEZ, Hu S, Yoshihara HAI, Ward CS, Venkatesh HS, Wang C, Zhang X, Vigneron DB, Ronen SM. Hyperpolarized 13C spectroscopic imaging informs on hypoxia-inducible factor-1 and myc activity downstream of platelet-derived growth factor receptor. Cancer Res. 2010 Oct;70(19):7400–10. doi: 10.1158/0008-5472.CAN-10-0883. [DOI] [PMC free article] [PubMed] [Google Scholar]
- 13.Hu S, Lustig M, Balakrishnan A, Larson PEZ, Bok R, Kurhanewicz J, Nelson SJ, Goga A, Pauly JM, Vigneron DB. 3D compressed sensing for highly accelerated hyperpolarized 13C MRSI with in vivo applications to transgenic mice models of cancer. Magn Reson Med. 2010 Feb;63(2):312–321. doi: 10.1002/mrm.22233. [DOI] [PMC free article] [PubMed] [Google Scholar]
- 14.Harris T, Eliyahu G, Frydman L, Degani H. Kinetics of hyperpolarized 13C1-pyruvate transport and metabolism in living human breast cancer cells. Proc Natl Acad Sci U S A. 2009 Oct;106(43):18 131–6 . doi: 10.1073/pnas.0909049106. [DOI] [PMC free article] [PubMed] [Google Scholar]
- 15.Larson PEZ, Bok R, Kerr AB, Lustig M, Hu S, Chen AP, Nelson SJ, Pauly JM, Kurhanewicz J, Vigneron DB. Investigation of tumor hyperpolarized [1-13C]-pyruvate dynamics using time-resolved multiband RF excitation echo-planar MRSI. Magn Reson Med. 2010 Mar;63(3):582–591. doi: 10.1002/mrm.22264. [DOI] [PMC free article] [PubMed] [Google Scholar]
- 16.Darpolor MM, Yen Y-F, Chua M-S, Xing L, Clarke-Katzenberg RH, Shi W, Mayer D, Josan S, Hurd RE, Pfefferbaum A, Senadheera L, So S, Hofmann LV, Glazer GM, Spielman DM. In vivo mrsi of hyperpolarized [1-(13)c]pyruvate metabolism in rat hepatocellular carcinoma. NMR Biomed. 2011;24(5):506–513. doi: 10.1002/nbm.1616. [DOI] [PMC free article] [PubMed] [Google Scholar]
- 17.Witney TH, Kettunen MI, Hu D-e, Gallagher FA, Bohndiek SE, Napolitano R, Brindle KM. Detecting treatment response in a model of human breast adenocarcinoma using hyperpolarised [1-13c]pyruvate and [1,4-13c2]fumarate. Br J Cancer. 2010 Oct;103(9):1400–6. doi: 10.1038/sj.bjc.6605945. [DOI] [PMC free article] [PubMed] [Google Scholar]
- 18.Romijn JA, Chinkes DL, Schwarz JM, Wolfe RR. Lactate-pyruvate interconversion in blood: implications for in vivo tracer studies. Am J Physiol. 1994 Mar;266(3 Pt 1):E334–40. doi: 10.1152/ajpendo.1994.266.3.E334. [DOI] [PubMed] [Google Scholar]
- 19.Tanner JE. Use of the stimulated echo in NMR diffusion studies. J Chem Phys. 1970;52(5):2523–6. [Google Scholar]
- 20.Merboldt K-D, Hanicke W, Frahm J. Self-diffusion nmr imaging using stimulated echoes. J Magn Reson. 1985;64(3):479–486. [Online]. Available: http://www.sciencedirect.com/science/article/pii/0022236485901118. [Google Scholar]
- 21.Merboldt KD, Hänicke W, Frahm J. Diffusion imaging using stimulated echoes. Magn Reson Med. 1991 Jun;19(2):233–9. doi: 10.1002/mrm.1910190208. [DOI] [PubMed] [Google Scholar]
- 22.Larson PEZ, Hurd RE, Kerr AB, Bok R, Kurhanewicz J, Vigneron DB. Stimulated-echo contrast with hyperpolarized [1-13C]-pyruvate. Proceedings of the 18th Annual Meeting of ISMRM; Stockholm. 2010. p. 375. [Google Scholar]
- 23.Hennig J, Il’yasov KA. Superstimulated echoes and other z-modulation signals: Basic principles and applications to diffusion imaging. Proceedings of the 6th Annual Meeting of ISMRM; Sydney. 1998. p. 658. [Google Scholar]
- 24.Hennig J. Method for the production of nuclear magnetic spectroscopy signals through spatial modulation of z-magnetization. 6,246,238. US Patent. 2001 Jun;
- 25.Mayer D, Levin YS, Hurd RE, Glover GH, Spielman DM. Fast metabolic imaging of systems with sparse spectra: application for hyperpolarized 13C imaging. Magn Reson Med. 2006 Oct;56(4):932–7. doi: 10.1002/mrm.21025. [DOI] [PubMed] [Google Scholar]
- 26.Levin YS, Mayer D, Yen YF, Hurd RE, Spielman DM. Optimization of fast spiral chemical shift imaging using least squares reconstruction: application for hyperpolarized (13)C metabolic imaging. Magn Reson Med. 2007 Aug;58(2):245–52. doi: 10.1002/mrm.21327. [DOI] [PubMed] [Google Scholar]
- 27.Mayer D, Yen YF, Tropp J, Pfefferbaum A, Hurd RE, Spielman DM. Application of subsecond spiral chemical shift imaging to real-time multislice metabolic imaging of the rat in vivo after injection of hyperpolarized 13C1-pyruvate. Magn Reson Med. 2009 Sep;62(3):557–64. doi: 10.1002/mrm.22041. [DOI] [PMC free article] [PubMed] [Google Scholar]
- 28.Reeder SB, Brittain JH, Grist TM, Yen YF. Least-squares chemical shift separation for (13)C metabolic imaging. J Magn Reson Imaging. 2007 Oct;26(4):1145–52. doi: 10.1002/jmri.21089. [DOI] [PubMed] [Google Scholar]
- 29.Leupold J, Månsson S, Petersson JS, Hennig J, Wieben O. Fast multiecho balanced SSFP metabolite mapping of (1)H and hyperpolarized (13)C compounds. MAGMA. 2009 Aug;22(4):251–6. doi: 10.1007/s10334-009-0169-z. [DOI] [PubMed] [Google Scholar]
- 30.Cunningham CH, Chen AP, Lustig M, Hargreaves BA, Lupo J, Xu D, Kurhanewicz J, Hurd RE, Pauly JM, Nelson SJ, Vigneron DB. Pulse sequence for dynamic volumetric imaging of hyperpolarized metabolic products. J Magn Reson. 2008;193(1):139–146. doi: 10.1016/j.jmr.2008.03.012. [DOI] [PMC free article] [PubMed] [Google Scholar]
- 31.Lau AZ, Chen AP, Ghugre NR, Ramanan V, Lam WW, Connelly KA, Wright GA, Cunningham CH. Rapid multislice imaging of hyperpolarized 13c pyruvate and bicarbonate in the heart. Magn Reson Med. 2010 Nov;64(5):1323–31. doi: 10.1002/mrm.22525. [DOI] [PubMed] [Google Scholar]
- 32.Hennig J, Weigel M. A new look at an old mechanism: Principles and applications of superstimulated echo tse. Proceedings of the 13th Annual Meeting of ISMRM; Miami Beach. 2005. p. 286. [Google Scholar]
- 33.Kiselev VG. Calculation of diffusion effect for arbitrary pulse sequences. J Magn Reson. 2003 Oct;164(2):205–11. doi: 10.1016/s1090-7807(03)00241-6. [DOI] [PubMed] [Google Scholar]
- 34.Weigel M, Schwenk S, Kiselev VG, Scheffler K, Hennig J. Extended phase graphs with anisotropic diffusion. J Magn Reson. 2010 Aug;205(2):276–85. doi: 10.1016/j.jmr.2010.05.011. [DOI] [PubMed] [Google Scholar]
- 35.Pauly J, Le Roux P, Nishimura D, Macovski A. Parameter relations for the Shinnar-Le Roux selective excitation pulse design algorithm. IEEE Trans Med Imaging. 1991;10(1):53–65. doi: 10.1109/42.75611. [DOI] [PubMed] [Google Scholar]
- 36.Conolly S, Pauly J, Nishimura D, Macovski A. Two-dimensional selective adiabatic pulses. Magn Reson Med. 1992 Apr;24(2):302–13. doi: 10.1002/mrm.1910240211. [Online]. Available: http://onlinelibrary.wiley.com/doi/10.1002/mrm.1910240211/abstract. [DOI] [PubMed] [Google Scholar]
- 37.Madhuranthakam AJ, Busse RF, Brittain JH, Rofsky NM, Alsop DC. B1-insensitive fast spin echo using adiabatic square wave enabling of the echo train (sweet) excitation. Magn Reson Med. 2008 Jun;59(6):1386–93. doi: 10.1002/mrm.21630. [DOI] [PubMed] [Google Scholar]
- 38.Silver MS, Joseph RI, Hoult DI. Selective spin inversion in nuclear magnetic resonance and coherent optics through an exact solution of the Bloch-Riccati equation. Phys Rev A. 1985 Apr;31(4):2753–2755. doi: 10.1103/physreva.31.2753. [DOI] [PubMed] [Google Scholar]
- 39.Tannus A, Garwood M. Improved performance of frequency-swept pulses using offset-independent adiabaticity. J Magn Reson A. 1996;120(1):133–137. 5. [Google Scholar]
- 40.Ugurbil K, Garwood M, Rath AR. Optimization of modulation functions to improve insensitivity of adiabatic pulses to variations in b1 magnitude. J Magn Reson. 1988;80(3):448–469. [Online]. Available: http://www.sciencedirect.com/science/article/B7GXD-4CRGD7T-5C/2/44943190676c2a1477b49f34bf519c1a. [Google Scholar]
- 41.Derby K, Tropp J, Hawryszko C. Design and evaluation of a novel dual-tuned resonator for spectroscopic imaging. J Magn Reson. 1990;86(33):256–262. [Google Scholar]
- 42.Wilson DM, Keshari KR, Larson PEZ, Chen AP, Criekinge MV, Bok R, Nelson SJ, Macdonald JM, Vigneron DB, Kurhanewicz J. Multi-compound polarization by dnp allows simultaneous assessment of multiple enzymatic activities in vivo. J Magn Reson. 2010;205(1):141–147. doi: 10.1016/j.jmr.2010.04.012. [DOI] [PMC free article] [PubMed] [Google Scholar]
- 43.Frahm J, Haase A, Matthei D, Merboldt KD, Hänicke W. Rapid NMR imaging using stimulated echoes. J Magn Reson. 1985 Jan;65(1):130–135. [Google Scholar]
- 44.Nagashima K. Optimum pulse flip angles for multi-scan acquisition of hyperpolarized nmr and mri. J Magn Reson. 2008 Feb;190(2):183–188. doi: 10.1016/j.jmr.2007.10.011. [DOI] [PubMed] [Google Scholar]
- 45.Hennig J, Weigel M, Scheffler K. Multiecho sequences with variable refocusing flip angles: optimization of signal behavior using smooth transitions between pseudo steady states (traps) Magn Reson Med. 2003 Mar;49(3):527–35. doi: 10.1002/mrm.10391. [DOI] [PubMed] [Google Scholar]
- 46.Hennig J, Weigel M, Scheffler K. Calculation of flip angles for echo trains with predefined amplitudes with the extended phase graph (epg)-algorithm: Principles and applications to hyperecho and traps sequences. Magn Reson Med. 2004 Jan;51:68–80. doi: 10.1002/mrm.10658. [DOI] [PubMed] [Google Scholar]
- 47.Hennig J. A new approach for the design of composite pulses based on the extended phase graph (EPG)-algorithm. Proceedings of the 11th Annual Meeting of ISMRM; Toronto. 2003. p. 967. [Google Scholar]
- 48.Pauly JM, Spielman D, Macovski A. Echo-planar spin-echo and inversion pulses. Magn Reson Med. 1993 Jun;29(6):776–782. doi: 10.1002/mrm.1910290609. [DOI] [PubMed] [Google Scholar]
- 49.Yen Y-F, Roux PL, Bok R, Tropp J, Chen AP, Zhang V, Zierhut ML, Albers M, Park I, Nelson SJ, Vigneron DB, Kurhanewicz J, Hurd RE. Apparent T2 of 13C-labeled metabolites in vivo. Proceedings of the 16th Annual Meeting of ISMRM; Toronto. 2008. p. 1747. [Google Scholar]