

Abstract
Parkinson’s disease (PD) is the most frequent neurodegenerative movement disorder and manifests at old age. While many details of its pathogenesis remain to be elucidated, in particular the protein and mitochondrial quality control during stress responses have been implicated in monogenic PD variants. Especially the mitochondrial kinase PINK1 and the ubiquitin ligase PARKIN are known to cooperate in autophagy after mitochondrial damage. As autophagy is also induced by loss of trophic signaling and PINK1 gene expression is modulated after deprivation of cytokines, we analyzed to what extent trophic signals and starvation stress regulate PINK1 and PARKIN expression. Time course experiments with serum deprivation and nutrient starvation of human SH-SY5Y neuroblastoma cells and primary mouse neurons demonstrated phasic induction of PINK1 transcript up to twofold and PARKIN transcript levels up to sixfold. The corresponding threefold starvation induction of PARKIN protein was limited by its translocation to lysosomes. Analysis of primary mouse cells from PINK1-knockout mice indicated that PARKIN induction and lysosomal translocation occurred independent of PINK1. Suppression of the PI3K-Akt-mTOR signaling by pharmacological agents modulated PARKIN expression accordingly. In conclusion, this expression survey demonstrates that PARKIN and PINK1 are coregulated during starvation and suggest a role of both PD genes in response to trophic signals and starvation stress.
Electronic supplementary material
The online version of this article (doi:10.1007/s10048-011-0303-8) contains supplementary material, which is available to authorized users.
Keywords: Parkinson’s disease, PARKIN, PINK1, Starvation stress, Neurodegeneration
Introduction
Parkinson’s disease (PD) is after Alzheimer’s disease the second most frequent neurodegenerative disease, with both syndromes being probably triggered by a combination of genetic predisposition and cumulative effects of environmental and physiological stressors, manifesting progressively with old age [1]. The resulting clinical movement deficit in PD is largely explained by the selective atrophy of dopaminergic neurons in the midbrain. The accumulation of ubiquitinated cytoplasmic aggregates (“Lewy bodies”) containing proteins such as α-synuclein and the appearance of oxidative stress in the affected tissues are established hallmarks of PD pathology. Rodents treated with the neurotoxins 6-OH-dopamine or the mitochondrial inhibitor 1-methyl-4-phenylpyridinium (MPP+) exhibit characteristic disease symptoms and were crucial to establish therapies. Over the past decade, the identification of more than a dozen mutant genes responsible for monogenic PD syndromes [2, 3] and another dozen PD candidate genes with significant risk association in GWAS studies [4–6] has greatly advanced our knowledge about pathogenesis, but the function of most corresponding gene products is still enigmatic and the pathways in common for both autosomal dominant and recessive PD variants remain elusive.
The PARKIN gene encoded at the PARK2 locus was identified particularly early as a frequent cause of young-onset autosomal recessive PD, and its protein sequence clearly codes for an ubiquitin E3 ligase [7]. Initial assumptions about its role for polyubiquitination and proteasomal protein degradation [8] are now being challenged, and its relevant substrates and its relevant loss of function are being discussed controversially, e.g., regarding mitochondrial DNA damage, autophagy, and apoptosis [9–13]. One isolated report with particularly convincing data demonstrated a role of PARKIN for receptor tyrosine kinase (RTK) endocytosis and signaling, implicating it in growth regulation [14]. PARKIN expression can be upregulated in dependence on ATF4, a transcription factor triggered by mitochondrial stress and the unfolded protein response [15].
Some PARKIN functions were shown to be downstream of Pten-induced protein kinase 1 (PINK1), a mitochondrial outer membrane kinase encoded at the autosomal recessive PARK6 locus [16, 17]. PINK1 provides protection against ROS-induced damage, and its mRNA level increases with progressive cell age [18]. Furthermore, PINK1 is transcriptionally induced in response to stress via FOXO3a and is stabilized against proteolytic degradation when the mitochondrial membrane potential dissipates [19, 20]. In Drosophila melanogaster the loss of PINK1 and PARKIN results in increased mitochondrial fission [21–23]. The role of PINK1 in mitochondrial dynamics of mammalian cells, however, is more complex and controversial as reviewed recently [24]: PINK1 was described to act as a fission factor [23] as well as a fusion factor [25, 26], while our PINK1-knockout mouse model demonstrated no effect on the mitochondrial morphology of unstressed cells [27]. PINK1 and PARKIN appear to act together also in the degradation of damaged mitochondria (mitophagy) [28–31]. It was proposed that the accumulation of PINK1 protein in dysfunctional mitochondria is a prerequisite for the relocalization of PARKIN from the cytosol to the mitochondrial outer membrane [19, 28, 29]. There is ongoing debate whether this is caused via direct phosphorylation and which other proteins interact with PINK1 and PARKIN [29, 32, 33]. It is also unclear which environmental and physiological stress events play the prominent role for the PINK1/PARKIN pathway. The relevance of stress was particularly investigated for the polyubiquitin–proteasome degradation of proteins [17, 27, 34, 35], but recently, the mutation effects could be maximized when potent mitochondrial uncouplers like CCCP were used as stressor [36].
In view of the regulation of PINK1 in response to a more physiological challenge namely cytokine deprivation [20], we were interested whether the physiological competition for nutrients and growth factors which control autophagy [37] has a role in the regulation of PARKIN. A previous study reported PARKIN expression to be downregulated in SH-SY5Y neuroblastoma cells by proteasomal stress, but unchanged after oxidative stress and ER stress, while an independent study observed PARKIN upregulation in some neuroblastoma cell lines after ER stress [38, 39]. Our observations indicate that trophic deprivation and nutrient starvation cause distinct regulations of PARKIN and PINK1 in neuronal cells.
Material and methods
Chemicals and media
Bafilomycin A1, rapamycin (all Sigma-Aldrich, Taufkirchen, Germany) and LY294002 (Jena Bioscience, Jena, Germany) stocks were prepared with DMSO and stored at −20°C until use. All cell culture media, l-glutamine, penicillin G–streptomycin solution, and minimal essential medium with Earle’s salts (MEM) nonessential amino acids were purchased from Invitrogen (Karlsruhe, Germany), DMSO and PBS were from Sigma-Aldrich (Taufkirchen, Germany).
Cell culture
SH-SY5Y cells were purchased from The European Collection of Cell Cultures (Sigma-Aldrich, Taufkirchen, Germany) and cultured in Roswell Park Memorial Institute (RPMI) 1,640 medium containing 2 g/l d-glucose, 2 mM l-glutamine and 10% FCS. HeLa cells were obtained from Deutsche Sammlung von Mikroorganismen und Zellkulturen GmbH (Braunschweig, Germany, DSM-No. ACC57) and were cultured in MEM supplemented with 10% FCS and 1% MEM nonessential amino acids. Primary cortical neurons were isolated from 1- to 4-day-old mice as described before [27] and were kept in Neurobasal medium with 10 mM l-glutamine for 10–20 days before performing experiments. Mouse embryonic fibroblasts (MEF) were isolated from mouse embryos with standard procedures and cultivated in DMEM with 4.5 g/l d-glucose supplemented with 15% BGS (Fisher Scientific, Schwerte, Germany). All cells were kept at 37°C with 5% CO2 and 95% air.
Starvation experiments
SH-SY5Y cells were starved of trophic factors by incubating them in their normal growth medium (RPMI 1640 containing 2 g/l d-glucose and 2 mM l-glutamine) but without FCS (serum starvation). The starvation effect was maximized by incubating SH-SY5Y cells and primary neurons in HBSS (Invitrogen, nutrient starvation). HBSS contains 1.26 mM CaCl2, 0.493 mM MgCl2 × 6H2O, 0.407 mM MgSO4 × 7H2O, 5.33 KCl, 0.441 KH2PO4, 4.17 mM NaHCO3, 137.93 mM NaCl, 0.338 mM Na2HPO4, 0.0266 mM Phenol Red, and 5.56 mM (1 g/l) d-glucose but no amino acids.
To analyze mRNA levels by real-time reverse transcriptase quantitative PCR (qPCR), 0.5 × 10⁶ SH-SY5Y cells were seeded in a six well, while 2.5 × 10⁶ SH-SY5Y cells were seeded in a 10-cm dish to investigate protein expression, always 20 h prior to experimental start. Medium was removed, cells washed with PBS and covered with 2 ml (for RNA) or 10 ml (for protein) of control medium or starvation medium as indicated in the figure captions. Neurons were starved without washing them with PBS. Afterwards cells were incubated for the appropriate time at 37°C, 95%, air and 5% CO2. Neuron starvation experiments were performed in two to four individual neuron cultures for each genotype and time point.
RNA isolation, cDNA synthesis, and quantitative real-time PCR
Supernatant medium was collected and spun down (5 min, 500×g, 4°C). Cell pellets were combined with adherent cells, and both were washed twice with PBS. Lysis of cells and isolation of total RNA was carried out utilizing the RNeasy mini kit (QIAGEN, Hilden, Germany). For first-strand synthesis, 1 μg of total RNA was digested with DNase I and reverse transcribed with SuperScript III reverse transcriptase utilizing oligo(dT)20 and random primers (all Invitrogen, Karlsruhe, Germany). Transcript changes of 30 ng cDNA per sample were analyzed in a 20-μl reaction volume with qPCR in a StepOnePlus Real-Time PCR System and the appropriate TaqMan gene expression assays (all Applied Biosystems, Darmstadt, Germany): SGK1 (Hs00178612_m1), FOXO3a (Hs00921424_m1), PINK1 (Hs00260868_m1), and PARKIN (Hs01038318_m1). Mean of expression changes was normalized to mean of TATA box-binding protein (TBP: Hs99999910_m1) as an internal “housekeeping” control. For analysis of mRNA levels from mouse neurons, TaqMan gene expression assays pink1 (Mm00550827_m1), parkin (Mm00450186_m1), and tbp (Mm00446973_m1) were used. Relative expression changes were calculated with the 2−ΔΔCt method [40] utilizing Microsoft Excel 2007 software, whereupon the ΔCt of the corresponding control served as calibrator. The resulting 2−∆∆Ct values of n experiments (indicated in the figures) were averaged for the appropriate time and treatment.
SDS-PAGE and western blotting
To determine PARKIN and LC3 protein expression, adherent cells were collected by scraping in 5 ml PBS supplemented with Complete EDTA free protease inhibitor (PI) cocktail (Roche Diagnostics GmbH, Mannheim, Germany), centrifuged for 5 min at 500×g, 4°C and combined with floating cells, which were likewise spun down. Cell pellets were washed twice with PBS-PI (5 min, 4°C). The resulting cell pellets were frozen in liquid nitrogen and stored at −80°C until further analysis. Proteins were extracted with 2× SDS lysis buffer (137 mM Tris/HCl pH 6.8, 4% SDS, 20% glycerol) and freshly added PhosSTOP phosphatase inhibitor and PI cocktail (all Roche Diagnostics GmbH, Mannheim, Germany). Samples were sonicated (5 s, 3 cycles × 10%, 40% power) with a Sonopuls UW2070 ultrasonic homogenizer to advance cell lysis, to destroy DNA and to homogenize the samples. Afterwards samples were spun down (20 min, 16,100×g, RT). Subsequently protein concentration was determined with the BC assay protein quantitation kit (VWR, Darmstadt, Germany). To investigate PARKIN expression, 30 μg protein per sample, prepared with 6× Laemmli sample buffer, were boiled for 5 min at 95°C and separated on a 10% SDS gel. Proteins were transferred to nitrocellulose membrane (Whatman, Dassel, Germany) by wet blotting (50 V, 90 min). Membranes were blocked for 1 h with 5% skim milk powder/TBS–Tween (0.05%) and probed with primary monoclonal (clone PRK8) mouse anti-PARKIN [41] antibody (New England Biolabs, Frankfurt, Germany) at titer 1:1,000 overnight at 4°C. Specificity of anti-PARKIN antibody was controlled utilizing PARKIN-knockout (ko) and wild-type (wt) mouse brain samples. Quantification of PARKIN and equal protein loading was controlled by normalization to GAPDH (monoclonal (6C5) antimouse, 1:15,000; Merck, Darmstadt, Germany). Primary antibodies were detected with IRDye 800CW conjugated goat antimouse IgG secondary antibody (1:20,000, 1 h, RT) on the Odyssey Infrared Imaging System (both LI-COR, Bad Homburg, Germany). Band intensities were measured with the appropriate Odyssey software, and protein expression ratios were calculated with Microsoft Excel 2007 software. To investigate autophagosome formation 30 μg protein from each sample were separated on a NuPage 12% Bis–Tris precast gel utilizing 1× NuPage MOPS SDS running buffer (both Invitrogen, Karlsruhe, Germany). LC3 protein was detected through chemiluminescence on a PVDF membrane (Bio-Rad Laboratories, Munich, Germany). Membranes were probed with a monoclonal antimouse LC3 (clone 2G6) antibody (Nanotools, Tenningen, Germany) at titer 1:500. Primary antibody was detected with a secondary ECL antimouse IgG HRP-linked antibody (Amersham Biosciences, Glattbrugg Switzerland) at titer 1:15,000 on ECL hyperfilm (Amersham Biosciences). The ratio of LC3-II/GAPDH expression was determined by quantification of the western blot with ImageJ.
Constructs and transfection
GFP-PARKIN has been described previously [42]. To obtain cherry-GFP-PARKIN an existing cherry-GFP fusion protein was digested with BspEI and BamH1 to remove the insert. Into these sites the PARKIN ORF was cloned after digesting GFP-PARKIN with BspEI and BamH1. All constructs were verified by sequencing. SH-SY5Y cells and MEF were transfected by electroporation with the cell line transfection kit V respective with the MEF transfection kit and the Nucleofector II (all Lonza, Basel, Switzerland) according to the manufacturer’s instruction. HeLa cells were transfected with Effectene (Qiagen, Hilden, Germany) likewise according to the manufacturer’s instruction.
Confocal laser scanning microscopy and immunostaining
LAMP-1 and LAMP-2 were detected with anti-LAMP-1 CD 107A and anti-LAMP-2 CD 107B antibody, while p62/SQSTM1 was detected with anti-p62 Ick ligand as primary antibody (all BD Bioscience, Heidelberg, Germany). Cy2-conjugated Affini Pure Donkey antimouse IgG (H+L) antibody served as secondary antibody (Dianova, Hamburg, Germany). All microscopic analyses were performed with a Leica TCS SP5 confocal laser scanning microscope equipped with the appropriate filters and a HCX PL APO lambda blue 63.0×, 1.40 OIL UV objective that was controlled by the LAS AF scan software (version 1.8.2) (Leica Microsystem, Wetzlar, Germany). Pictures were visualized with IMARIS 6.0.0 (BITPLANE Scientific solutions), and no deconvolution was performed. Images were maximum image projections apart from the insets in Fig. 3c, d which represent single slices.
Fig. 3.
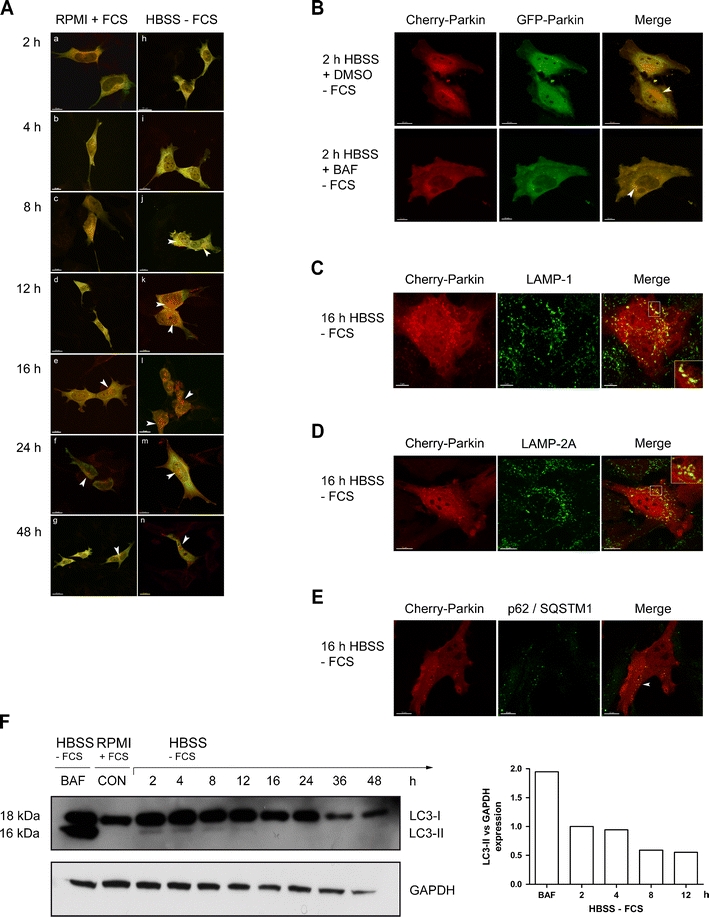
PARKIN translocates to lysosomes during starvation. a SH-SY5Y cells were transfected with cherry-GFP-PARKIN and after 2 days incubated with either control medium (RPMI + FCS) or starvation medium (HBSS − FCS), fixed afterwards and examined by LSM. Starting from 8 h incubation with HBSS medium, in addition to the cytoplasmic fluorescence, PARKIN punctae appeared that exhibited only red (cherry) but no green (GFP) fluorescence. In contrast, cells kept in RPMI + 10% FCS showed these PARKIN punctae at later time points and lower frequency. b HeLa cells were transfected with cherry-GFP-PARKIN and after 2 days incubated for 2 h with starvation medium (HBSS − FCS) containing bafilomycin A1 (10 nM) or vehicle (0.1% DMSO) and fixed afterwards. Bafilomycin A1 treatment reduced the amount of PARKIN punctae, as indicated by their red and green staining. c–e HeLa cells were transfected with cherry-GFP-PARKIN and after 2 days incubated for 16 h with starvation medium (HBSS − FCS), fixed afterwards and stained for the lysosomal marker protein LAMP-1 (c) or LAMP-2 (d) and p62/SQSTM1 (e). A partial colocalization as indicated by yellow staining in the merged image as well as engulfment of red cherry-PARKIN punctae by lysosomes is visible (insets represent single slices). Furthermore cherry-PARKIN punctae convincingly colocalize with p62/SQSTM1. f SH-SY5Y cells were amino acid and serum starved (HBSS − FCS) or nonstarved for 16 h and analyzed for the LC3-II/GAPDH ratio to monitor autophagosome formation. LC3-I conversion to LC3-II was controlled by adding bafilomycin A1 (5 nM, 16 h) in addition to starvation
Statistics
Raw data generated with Microsoft Excel 2007 were transferred to GraphPad Prism 4.03 software to calculate mean, SEM, and P values. For qPCR significance was calculated by unpaired t test between mean of 2−∆∆Ct values under different conditions, e.g., nonstarved (RPMI + FCS) vs. starved (HBSS − FCS) for the corresponding time. Experimental variation was whenever possible (qPCR) calculated by averaging ΔΔCt values of the controls of n experiments and generating 2−∆∆Ct values. SEM is indicated by error bar in the figures. One-way ANOVA followed by Tukey posttest was used to calculate statistics for PARKIN protein expression change (Fig. 2b) and mRNA changes of primary neurons (Fig. 5). P values smaller than 0.05-fold were considered to be significantly different: *P ≤ 0.05, **P ≤ 0.01, and *** P ≤ 0.001.
Fig. 2.
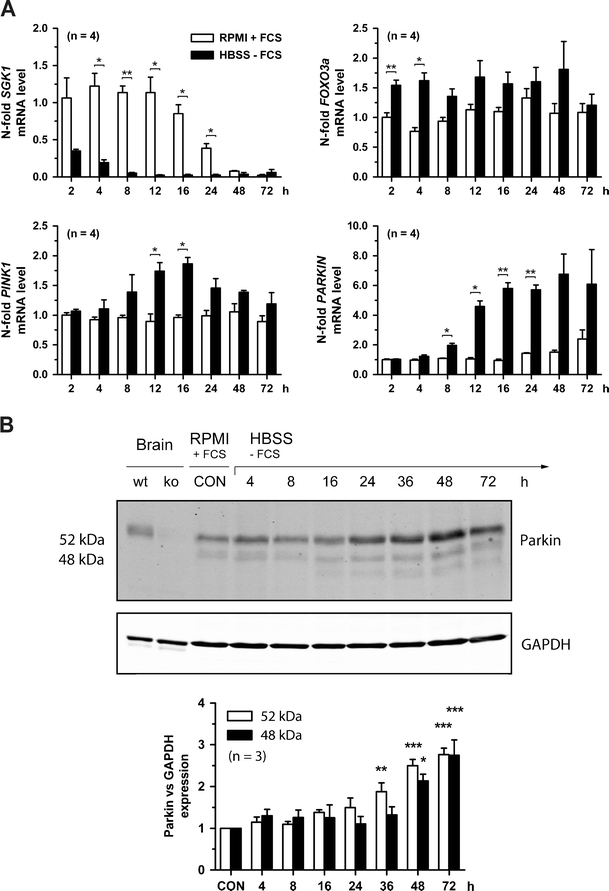
The combination of serum deprivation and nutrient starvation potentiates the PARKIN induction at the mRNA and protein level in SH-SY5Y cells. a Human SH-SY5Y dopaminergic neuroblastoma cells were cultured in RPMI medium containing 10% FCS (RPMI + FCS) or in HBSS without amino acids and serum (HBSS − FCS) and lowered glucose (1 g/l). At the indicated time points the different transcripts were quantified and normalized to nonstarvation (RPMI + FCS) at time 2 h; n = 4. b PARKIN protein expression was analyzed by western blot and normalized to GAPDH levels. The specificity of anti-PARKIN antibody was controlled utilizing PARKIN-knockout (ko) and wild-type (wt) mouse brain samples. PARKIN protein levels are significantly increasing during starvation after 36 h; n = 3
Fig. 5.
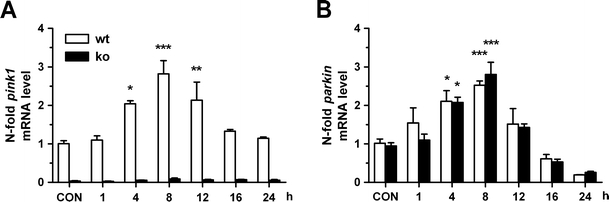
Starvation-triggered PARKIN induction and translocation to lysosomes occur independent of PINK1 expression. Primary neuron cultures of wild-type (wt) and PINK1-knockout mice (ko) littermates were starved with HBSS medium or nonstarved for 24 h (CON). a PINK1 and b PARKIN mRNA levels were analyzed by qPCR, indicating that the PARKIN induction is independent of PINK1; n = 2–4
Results
Serum deprivation of SH-SY5Y neuroblastoma cells results in decreased SGK1 and increased FOXO3a, PINK1, and PARKIN transcript levels
In view of the role of PINK1 in the stress response pathway of cytokine deprivation [20], we aimed to gain a deeper understanding of PARKIN, which is putatively acting downstream of PINK1 in the signaling network. As first step we analyzed the PARKIN mRNA expression in different cell systems used as PD models. HEK-293 cells exhibited low PARKIN mRNA levels, while HeLa cells, which were used as control, contained no PARKIN as shown before [41, 43] (Fig. S1). In contrast, fibroblasts had a very high PARKIN transcript expression and the expression levels of the human dopaminergic neuroblastoma cell line SH-SY5Y lay between fibroblasts and HEK-293 cells. Since PD affects preferentially the dopaminergic nigrostriatal projection, we chose the SH-SY5Y cells as the best characterized and established PD in vitro model system. We subjected SH-SY5Y to serum deprivation by incubating them in RPMI medium with 2 g/l d-glucose and 2 mM l-glutamine but without FCS and compared them to cells incubated in RPMI medium with 10% FCS. Cells were subjected to a 72-h time course, and the transcript levels of PARKIN, PINK1, and the transcription factor FOXO3a, which is known to upregulate PINK1 expression as part of an antiapoptotic response to cytokine withdrawal [20], were analyzed. FOXO3a itself was observed to aggregate in Lewy bodies and is thus implicated in the pathogenesis of PD [44]. Serum/glucocorticoid-regulated kinase 1 (SGK1) was used as a positive control in view of the known strong dependence of its transcript levels from serum availability; furthermore, SGK1 is known to inhibit FOXO3a function via phosphorylation and it shows altered expression in the MPP+ mouse model of PD [45, 46].
In SH-SY5Y cultivated without FCS, reductions of SGK1 appeared already at 2 h, became significant from 4 until 24 h, and were discernible until 72 h, with a peak of five- to 10-fold downregulation at 12–24 h (Fig. 1). These alterations were paralleled by the expected, approximately 1.5-fold significant induction of FOXO3a already at 2 h, which lasted until 12–24 h, followed by a gradual decline to the baseline by 72 h. They were also paralleled by a delayed, approximately 1.5-fold significant induction of PINK1 levels between 8 and 24 h, and a return to the baseline at 48 h. The main finding of this experiment presents the relatively early and high induction of PARKIN levels, significant from 4 to 24 h, that reached threefold values over starting levels at 12 h and returned to baseline values by 48–72 h (Fig. 1), demonstrating that PARKIN expression strongly depends on the presence of trophic factors.
Fig. 1.
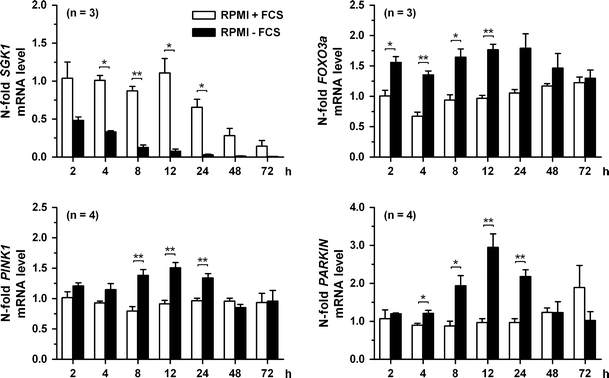
Serum starvation of human SH-SY5Y dopaminergic neuroblastoma cells cultured without FCS elicits strong PARKIN mRNA level changes. SH-SY5Y dopaminergic neuroblastoma cells were cultured in RPMI medium containing 10% FCS (RPMI + FCS) or no serum (RPMI − FCS). At the indicated time points, the different transcripts were quantified and normalized for each stage of starvation to nonstarvation (RPMI + FCS) at time 2 h. Strong PARKIN mRNA level changes occurred as well as an upregulation of PINK1 mRNA; SGK1 and FOXO3a: n = 3; PINK1 and PARKIN: n = 4
Additional nutrient starvation doubles the levels of PARKIN and PINK1 mRNA induction in SH-SY5Y cells
To investigate if the induction of PINK1 and PARKIN mRNA is part of a graded response to trophic deprivation, the starvation stress was maximized by additional deprivation from nutrients through a switch from RPMI medium with 10% FCS to HBSS medium (1 g/l d-glucose, no serum or amino acids, specific composition see “Material and methods” section). Again mRNA levels of SGK1 were maintained until 12 h under control conditions, but showed significant reductions under starvation conditions with a similar time course as in Fig. 1 and a peak again at 12 h, but a stronger effect with more than 10-fold changes between 8 and 16 h (Fig. 2a). As with serum deprivation alone, FOXO3a transcript levels were already significantly upregulated at 2 h and reached an approximately 1.5-fold induction by 4 h, but the upregulation was no longer significant at 8 and 12 h suggesting that the additional effects of nutrient starvation are mediated by further factors. The induction of PINK1 mRNA levels was enhanced to twofold values, with a peak and clear significance by 12 and 16 h as previously, but curiously a lack of significance at 8 and 24 h in comparison to serum deprivation alone. In contrast, the induction of PARKIN mRNA levels was markedly enhanced until sixfold, again with a similar time course of significant changes between 8 and 24 h and a peak by 12–16 h, but no return to the baseline even after 72 h (Fig. 2a).
To assess whether this strong PARKIN mRNA induction served to increase PARKIN protein levels or to maintain PARKIN protein levels in compensation of autophagic degradation, immunoblot analyses of PARKIN protein levels were performed (Fig. 2b). Gradual increases of the major 52-kDa and the minor 48-kDa PARKIN isoforms until 72 h after starvation were observed without exhibiting differences, peaking at an approximately threefold induction with high significance at 72 h. In conclusion, qPCR and immunoblot data in neural cells confirm a graded upregulation of PARKIN expression in response to serum and nutrient withdrawal, suggesting a protective function of PARKIN in periods of starvation.
Starvation-induced translocation of PARKIN to lysosomes
In view of the established role of PARKIN in mitophagy [47], we hypothesized that the induction of PARKIN expression during deprivation of trophic factors is related to a putative function in the starvation-induced autophagic degradation of proteins and/or organelles. To investigate a possible role of PARKIN in the autophago-lysosomal pathway, the fusion protein cherry-GFP-PARKIN was constructed. As the green GFP fluorescence is sensitive towards acidity while the red cherry fluorescence is stable under acid conditions, the presence of PARKIN in acid-containing lysosomes can be monitored by the loss of its green fluorescence [48]. Microscopical analysis of transfected SH-SY5Y neuroblastoma cells exhibited green and red cytosolic fluorescence in a diffuse distribution throughout the cytosol at time points 2 and 4 h [Fig. 3a (a–b and h–i)]. However, starting from 8 h with a maximum around 16 h an increasing percentage of starved cells in HBSS medium contained PARKIN punctae [Fig. 3a (j–n)] emitting only red, but no green fluorescence. In contrast, control cells kept in RPMI medium with 10% FCS showed similar PARKIN punctae only much later (24–48 h) and in a lower amount per cell [Fig. 3a (f–g)]. At the end of the observation period (48 h), the general amount of PARKIN punctae in starved cells was reduced compared to the 16 h peak and was similar under both conditions. These data indicate that starvation triggered a phasic response of PARKIN peaking at 16 h, with subcellular relocalization and acid exposure, compatible with an association of PARKIN with proteins or organelles that are degraded by the autophago-lysosomal pathway.
To corroborate this notion, HeLa cells transfected with cherry-GFP-Parkin were subjected to starvation medium (HBSS − FCS). HeLa cells were chosen for this experiment since these cells do not contain endogenous PARKIN [41, 43] and are morphologically better for high-resolution microscopy than neuroblastoma cells. Already after 2 h starvation, the HeLa cells exhibited red PARKIN punctae (Fig. 3b, upper panel). Since bafilomycin A1 is known to block the autophago-lysosomal flux, we sought additional evidence to support the involvement of PARKIN in the autophagosomal pathway. Indeed, incubation with bafilomycin A1 over 2 h eliminated the exclusively red PARKIN punctae typical of starved cells, with all detectable PARKIN punctae now exhibiting both red and green fluorescence (Fig. 3b, lower panel). These observations confirm that bafilomycin A1 prevents the acidification of autophago-lysosomes [49] and thus loss of the GFP signal, indicating it interferes with the processing of PARKIN in the autophago-lysosomal pathway.
Furthermore, we analyzed whether PARKIN colocalized with marker proteins of the lysosomal membrane and of the protein degradation pathway. After transfection of HeLa cells with cherry-PARKIN and starvation for 16 h, the lysosome-associated membrane proteins LAMP-1 and LAMP-2 were visualized by immunostaining. Some of the cherry-PARKIN punctae colocalized completely with LAMP-1 (Fig. 3c) and LAMP-2 (Fig. 3d), while other PARKIN punctae appeared to be engulfed by lysosomes (see insets in Fig. 3c, d). After 16 h starvation of transfected HeLa cells, also some p62/sequestosome 1 (SQSTM1) signals colocalized with PARKIN punctae (Fig. 3e). SQSTM1 is associated with polyubiquitinated protein aggregates to be degraded by autophagy.
To correlate the PARKIN translocation to lysosomes with the time course of autophagy, an immunoblot analysis of the autophagosome marker LC3 was performed (Fig. 3f), quantifying the conversion of the cytosolic LC3-I (18 kDa) variant to the autophagosome-bound LC3-II (16 kDa) by proteolytic cleavage and lipidation. As a positive control, enrichment of LC3-II was achieved by long-term treatment with bafilomycin A1 (BAF), which blocks the fusion of autophagosomes with lysosomes. LC3-II band intensity in starved SH-SY5Y cells was maximal already after 2 h, diminished at later time points and disappeared completely from 16 h onwards (Fig. 3f).
Thus the time course in starving neural cells indicates (1) that autophagosome formation is initiated already at 2 h, (2) that lysosomal engulfment of PARKIN starts around 8 h, and (3) that autophagosome formation is already ceasing by the time of maximal PARKIN mRNA induction at 16 h, while (4) PARKIN protein continues to accumulate until 72 h. Overall, the data support the current views that PARKIN associates with protein aggregates and/or organelles on their way to autophagic degradation in lysosomes.
The starvation effect on PARKIN expression can be mimicked by rapamycin or LY294002 and repressed by bafilomycin A1 and LY294002
To further support the activation of PARKIN expression by deprivation of trophic factors, we exposed control cells and HBSS-starved cells to pharmacological agents which induce autophagy (mTOR inhibitor rapamycin), block autophagosome maturation (bafilomycin A1), or block the trophic factor signaling via PI3K-Akt [PI3K inhibitor LY294002 (LY)], quantifying the peak PARKIN mRNA induction at the 16 h time point (Fig. 4a). In unstarved cells, bafilomycin A1 exerted no influence (Fig. 4a, BAF, white bar), while the rapamycin and LY294002 were able to upregulate PARKIN mRNA significantly up to twofold (RAP, LY, white bars). Similar to previous observations, starvation triggered a fourfold PARKIN mRNA induction compared to the PARKIN mRNA levels at 16 h in unstarved cells (Fig. 4a, CON, black bar). In starved cells (black bars), rapamycin treatment failed as expected to enhance the starvation effect, while both bafilomycin A1 and LY294002 limited the PARKIN induction from fourfold to twofold, correlating with an impaired PARKIN usage after bafilomycin A1 treatment (Fig. 3b). The repressing effect of LY294002 here may be explained by its known autophagy inhibition effects [50]. To validate these mRNA data, the levels of endogenous PARKIN protein after 24 h were determined by immunoblot analysis (Fig. 4b). In good agreement with the transcript levels, PARKIN protein levels were visibly enhanced in unstarved cells by rapamycin or LY294002 and in starved cells treated only with DMSO. Treatment of starved cells with bafilomycin A1 or LY294002 resulted in evident PARKIN reduction. Overall, the treatment of starved and unstarved cells with pharmacological agents supports our notion that PARKIN expression is indeed regulated by trophic signaling via the PI3K-Akt-mTOR pathway.
Fig. 4.
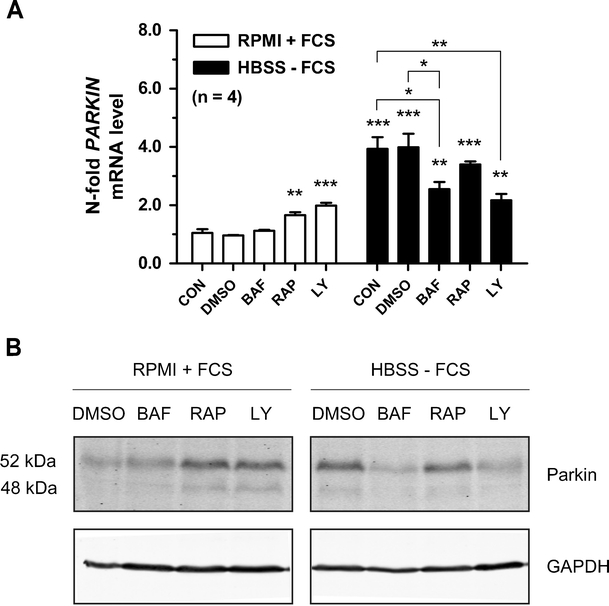
Pharmacological modulation of PARKIN expression. a SH-SY5Y cells were treated with control (RPMI + FCS) or starvation medium (HBSS − FCS) containing either 0.05% DMSO, 5 nM bafilomycin A1 (BAF), 0.5 μM rapamycin (RAP), 25 μM LY294002 (LY), or nothing (CON) and incubated for 16 h. Significance was determined between unstarved cells (white bar, CON) and unstarved treated cells as well as between starved cells (black bar, CON) and starved treated cells. Analysis of PARKIN mRNA demonstrated clearly its modulation by the applied drugs; n = 4. b SH-SY5Y cells were treated as in a and after 24 h PARKIN expression levels were determined by western blot, supporting the mRNA data presented in a
Starvation-triggered PARKIN induction in primary neurons and PARKIN relocalization in embryonal mouse fibroblasts occur independent of PINK1 expression
As PARKIN and PINK1 are both induced by starvation and PARKIN is known to rescue some PINK1 deficiency phenotypes and is therefore thought to act downstream of PINK1 [26, 51] and PINK1 is necessary for CCCP-induced PARKIN translocation to mitochondria [28], we investigated whether the starvation-triggered PARKIN induction depends on PINK1. For this purpose, ex vivo primary cortical neuron cultures (DIV 14) of wt and PINK1-ko mice bred from littermates [27] were subjected to starvation stress. Significant inductions from 4 h on with a threefold peak around 8 h were observed for PARKIN mRNA levels both in wt and ko cells and for PINK1 mRNA in wt cells (Fig. 5a, b). These findings indicate that starvation-triggered PARKIN transcription is not controlled by PINK1 expression and are in agreement with the previous data from neuroblastoma cells where a significant upregulation occurred earlier for PARKIN than for PINK1 (Figs. 1 and 2).
To test whether the loss of PINK1 affects PARKIN translocation to lysosomes, MEF from wt and PINK1-ko animals were transfected with the cherry-GFP-Parkin construct. After 2 days MEF were incubated either with control medium containing 15% bovine growth serum (DMEM + BGS) or with starvation medium (HBSS–BGS) for 16 h. Confocal microscopy analysis demonstrated similar formation of red PARKIN punctae in MEF from wt and PINK1-ko mice (Fig. S2), confirming the PINK1 independence of PARKIN induction and lysosomal translocation during starvation.
In summary, their regulation pattern after drug exposure and their phasic induction during starvation but not during ER or oxidative stress [38] indicate that PARKIN and PINK1 are coregulated during trophic deprivation and undergo parallel fates or play similar roles in response to starvation.
Discussion
In this study we investigated the involvement and the regulation of parkinsonism-related genes in response to serum and nutrient starvation. Our expression analyses document a prominent role for PARKIN in growth factor signaling: during unavailability of serum and nutrients, neural SH-SY5Y cells induce PARKIN more than other published pathway components [20] in a phasic pattern for mRNA levels at 8–24 h after starvation, in a process dependent on PI3K-Akt-mTOR signaling and autophagy. These data are supported by alterations of PARKIN mRNA levels after application of pharmacological drugs targeting the PI3K-Akt-mTOR pathway, as we found a significant upregulation of the PARKIN transcript in unstarved cells after specific inhibition of the PI3K-Akt-mTOR phosphorylation cascade either through LY294002 or through rapamycin. The PI3K-Akt signaling is involved in a number of different pathways including cell growth, proliferation, cell cycle control, cell migration and invasion, survival, protein, glycogen and fatty acid synthesis [52]. While the upregulation of PARKIN mRNA in unstarved cells after LY294002 treatment is most probably due to LY294002’s ability to mimic starvation, it could be also/additionally a compensatory antiapoptotic mechanism. As Akt blocks Bax conformation changes and mitochondrial translocation [53, 54] and PARKIN has antiapoptotic properties [55–58], an increase of the PARKIN transcript could therefore compensate for the LY294002-mediated inhibition of Akt.
Our results are compatible with strong biochemical evidence in peripheral cell types showing the ubiquitin E3 ligase PARKIN able to modulate EGF receptor trafficking and promote PI3K-Akt signaling through a direct interaction between the PARKIN ubiquitin-like (Ubl) domain and the ubiquitin-interacting motif of the protein Eps15, a component of the RTK endocytosis machinery [14], indicating that PARKIN function affects RTK signaling and that a dysregulation could be relevant for the nervous system.
Published data about transcriptional dysregulation in PD are scarce and usually not controlled by time course analyses, in spite of the intense investigations into PD pathogenesis and into the dozen novel PD genes over the past decade [59]. A genome-wide survey of the brain transcriptome from the MPP+-treated mouse model of PD identified an upregulated expression of the immediate early gene SGK1 as the prominent effect [46]. SGK1 transcription is strongly stimulated by serum or specific growth factors such as insulin but also by other stressors such as high glucose concentrations or oxidative stress and is activated by PI3K signaling [60]. SGK1 exerts an antiapoptotic effect through its inhibitory phosphorylation of FOXO3a and BAD [61]. The transcription factor FOXO3a is induced by nutrient restriction and oxidative stress, is inhibited by Akt-signaling, and mediates the protective upregulation of antioxidant proteins such as MnSOD and later the proapoptotic regulation of FasL, Bim, and Bcl-6 [62]. FOXO3a was observed to be sequestered into Lewy bodies, the pathognomonic protein aggregates in neurons affected by PD [44]. Thus, SGK1 and FOXO3a represent credible examples of transcriptional dysregulation in PD, both being implicated in stress-dependent PI3K-Akt growth signaling.
Our analysis whether PARKIN expression levels depended on the presence of serum growth factors showed similarly strong effects early on for FOXO3a and SGK1, later for PARKIN and PINK1 in dopaminergic neuronal cells (Fig. 1). This effect could be maximized to a twofold PINK1 transcript induction and sixfold PARKIN induction upon the additional removal of nutrients from the culture medium (Fig. 2). This transcript induction served not only to compensate the ongoing PARKIN protein sequestration in autophagosomes and lysosomes (Fig. 3), but was sufficient to elevate the PARKIN protein steady-state levels threefold after 36 h in a sustained fashion, suggesting that PARKIN is specifically needed during this period, hours after maximal LC3-II conversion and induction of lysosomal degradation (compare the time courses for PARKIN protein and LC3-II in Figs. 2b and 3a, f). A degradation of PARKIN by lysosomes was implicated after CCCP treatment [28, 29, 63], and our data show that inhibition of the autophago-lysosomal pathway during starvation, e.g., by bafilomycin A1 significantly reduced PARKIN mRNA levels, indicating a similar fate for PARKIN during starvation. However, CCCP-induced PARKIN degradation was dependent on PINK1, while starvation-triggered PARKIN induction became significant before the PINK1 induction (Fig. 2), and appeared independent from PINK1 (Fig. 5), suggesting only partially shared upstream regulation mechanisms and implying that PARKIN participates in different pathways in stress response depending on the specific stressor.
Thus, serum deprivation and nutrient starvation result not only in the known early expression regulation of FOXO3a and SGK1 during the early period of growth factor signaling and autophagosome formation (until 12 h in our assay, see Fig. 3f) but also in a later strong upregulation of PARKIN and PINK1 levels, which could exert protective antiapoptotic effects [64]. The data are compatible with the previously reported dependence of PINK1 expression on the activity of the phosphatase PTEN, which antagonizes the PI3K-Akt-mTOR kinase signaling cascade [65]. Cell type-specific regulation of PARKIN had already been noted after ER or proteasomal stress [38, 39], but a time course correlation of this effect to cellular processes or an investigation into the mechanisms involved was not attempted, except an identification of ATF4 as transcription factor of PARKIN [15].
In conclusion, our systematic expression studies of dopaminergic neural cells documented in a time course over 72 h after starvation and treated with drugs to modulate specific pathways all consistently point to an important role of PARKIN and PINK1 in the serum- and nutrient-dependent signaling, suggesting that they act closely together in this pathway. It would be interesting to investigate whether additional parkinsonism-relevant genes are involved in the same signaling network; similar expression profiling studies could be useful to screen novel disease-associated candidate genes and elucidate their putative roles in stress response pathways.
Electronic supplementary material
Below is the link to the electronic supplementary material.
DOC 2615 kb
Acknowledgments
We thank Tessa Frielinghaus and Birgitt Meseck-Selchow for the technical assistance and further support.
Financial support
This work was supported by grants of the German Federal Ministry of Education (BMBF 01GS08138), through the National Genome Research Network (NGFNplus), and the GerontoMitoSys network (BMBF PTJ 0315584A).
Ethical standards
The authors declare that the experiments comply with the current laws of the country in which they were performed.
Conflict of interest
The authors declare that they have no conflict of interest.
Open Access
This article is distributed under the terms of the Creative Commons Attribution Noncommercial License which permits any noncommercial use, distribution, and reproduction in any medium, provided the original author(s) and source are credited.
References
- 1.Gasser T. Mendelian forms of Parkinson’s disease. Biochim Biophys Acta. 2009;1792(7):587–596. doi: 10.1016/j.bbadis.2008.12.007. [DOI] [PubMed] [Google Scholar]
- 2.Polymeropoulos MH, Lavedan C, Leroy E, Ide SE, Dehejia A, Dutra A, Pike B, Root H, Rubenstein J, Boyer R, Stenroos ES, Chandrasekharappa S, Athanassiadou A, Papapetropoulos T, Johnson WG, Lazzarini AM, Duvoisin RC, Di Iorio G, Golbe LI, Nussbaum RL. Mutation in the alpha-synuclein gene identified in families with Parkinson’s disease. Science. 1997;276(5321):2045–2047. doi: 10.1126/science.276.5321.2045. [DOI] [PubMed] [Google Scholar]
- 3.Klein C, Schneider SA, Lang AE. Hereditary parkinsonism: Parkinson disease look-alikes—an algorithm for clinicians to “PARK” genes and beyond. Mov Disord. 2009;24(14):2042–2058. doi: 10.1002/mds.22675. [DOI] [PubMed] [Google Scholar]
- 4.Simon-Sanchez J, Schulte C, Bras JM, Sharma M, Gibbs JR, Berg D, Paisan-Ruiz C, Lichtner P, Scholz SW, Hernandez DG, Kruger R, Federoff M, Klein C, Goate A, Perlmutter J, Bonin M, Nalls MA, Illig T, Gieger C, Houlden H, Steffens M, Okun MS, Racette BA, Cookson MR, Foote KD, Fernandez HH, Traynor BJ, Schreiber S, Arepalli S, Zonozi R, Gwinn K, van der Brug M, Lopez G, Chanock SJ, Schatzkin A, Park Y, Hollenbeck A, Gao J, Huang X, Wood NW, Lorenz D, Deuschl G, Chen H, Riess O, Hardy JA, Singleton AB, Gasser T. Genome-wide association study reveals genetic risk underlying Parkinson’s disease. Nat Genet. 2009;41(12):1308–1312. doi: 10.1038/ng.487. [DOI] [PMC free article] [PubMed] [Google Scholar]
- 5.Satake W, Nakabayashi Y, Mizuta I, Hirota Y, Ito C, Kubo M, Kawaguchi T, Tsunoda T, Watanabe M, Takeda A, Tomiyama H, Nakashima K, Hasegawa K, Obata F, Yoshikawa T, Kawakami H, Sakoda S, Yamamoto M, Hattori N, Murata M, Nakamura Y, Toda T. Genome-wide association study identifies common variants at four loci as genetic risk factors for Parkinson’s disease. Nat Genet. 2009;41(12):1303–1307. doi: 10.1038/ng.485. [DOI] [PubMed] [Google Scholar]
- 6.Nalls MA, Plagnol V, Hernandez DG, Sharma M, Sheerin UM, Saad M, Simon-Sanchez J, Schulte C, Lesage S, Sveinbjornsdottir S, Stefansson K, Martinez M, Hardy J, Heutink P, Brice A, Gasser T, Singleton AB, Wood NW. Imputation of sequence variants for identification of genetic risks for Parkinson’s disease: a meta-analysis of genome-wide association studies. Lancet. 2011;377(9766):641–649. doi: 10.1016/S0140-6736(10)62345-8. [DOI] [PMC free article] [PubMed] [Google Scholar]
- 7.Kitada T, Asakawa S, Hattori N, Matsumine H, Yamamura Y, Minoshima S, Yokochi M, Mizuno Y, Shimizu N. Mutations in the parkin gene cause autosomal recessive juvenile parkinsonism. Nature. 1998;392(6676):605–608. doi: 10.1038/33416. [DOI] [PubMed] [Google Scholar]
- 8.Tanaka K, Suzuki T, Hattori N, Mizuno Y. Ubiquitin, proteasome and parkin. Biochim Biophys Acta. 2004;1695(1–3):235–247. doi: 10.1016/j.bbamcr.2004.09.026. [DOI] [PubMed] [Google Scholar]
- 9.Kahle PJ, Haass C. How does parkin ligate ubiquitin to Parkinson’s disease? EMBO Rep. 2004;5(7):681–685. doi: 10.1038/sj.embor.7400188. [DOI] [PMC free article] [PubMed] [Google Scholar]
- 10.Lim KL, Dawson VL, Dawson TM. Parkin-mediated lysine 63-linked polyubiquitination: a link to protein inclusions formation in Parkinson’s and other conformational diseases? Neurobiol Aging. 2006;27(4):524–529. doi: 10.1016/j.neurobiolaging.2005.07.023. [DOI] [PubMed] [Google Scholar]
- 11.Rothfuss O, Fischer H, Hasegawa T, Maisel M, Leitner P, Miesel F, Sharma M, Bornemann A, Berg D, Gasser T, Patenge N. Parkin protects mitochondrial genome integrity and supports mitochondrial DNA repair. Hum Mol Genet. 2009;18(20):3832–3850. doi: 10.1093/hmg/ddp327. [DOI] [PubMed] [Google Scholar]
- 12.Chen D, Gao F, Li B, Wang H, Xu Y, Zhu C, Wang G. Parkin mono-ubiquitinates Bcl-2 and regulates autophagy. J Biol Chem. 2010;285(49):38214–38223. doi: 10.1074/jbc.M110.101469. [DOI] [PMC free article] [PubMed] [Google Scholar]
- 13.Vives-Bauza C, Przedborski S. Mitophagy: the latest problem for Parkinson’s disease. Trends Mol Med. 2011;17(3):158–165. doi: 10.1016/j.molmed.2010.11.002. [DOI] [PubMed] [Google Scholar]
- 14.Fallon L, Belanger CM, Corera AT, Kontogiannea M, Regan-Klapisz E, Moreau F, Voortman J, Haber M, Rouleau G, Thorarinsdottir T, Brice A, van Bergen En Henegouwen PM, Fon EA. A regulated interaction with the UIM protein Eps15 implicates parkin in EGF receptor trafficking and PI(3)K-Akt signalling. Nat Cell Biol. 2006;8(8):834–842. doi: 10.1038/ncb1441. [DOI] [PubMed] [Google Scholar]
- 15.Bouman L, Schlierf A, Lutz AK, Shan J, Deinlein A, Kast J, Galehdar Z, Palmisano V, Patenge N, Berg D, Gasser T, Augustin R, Trumbach D, Irrcher I, Park DS, Wurst W, Kilberg MS, Tatzelt J, Winklhofer KF. Parkin is transcriptionally regulated by ATF4: evidence for an interconnection between mitochondrial stress and ER stress. Cell Death Differ. 2011;18:769–782. doi: 10.1038/cdd.2010.142. [DOI] [PMC free article] [PubMed] [Google Scholar]
- 16.Zhou C, Huang Y, Shao Y, May J, Prou D, Perier C, Dauer W, Schon EA, Przedborski S. The kinase domain of mitochondrial PINK1 faces the cytoplasm. Proc Natl Acad Sci U S A. 2008;105(33):12022–12027. doi: 10.1073/pnas.0802814105. [DOI] [PMC free article] [PubMed] [Google Scholar]
- 17.Valente EM, Abou-Sleiman PM, Caputo V, Muqit MM, Harvey K, Gispert S, Ali Z, Del Turco D, Bentivoglio AR, Healy DG, Albanese A, Nussbaum R, Gonzalez-Maldonado R, Deller T, Salvi S, Cortelli P, Gilks WP, Latchman DS, Harvey RJ, Dallapiccola B, Auburger G, Wood NW. Hereditary early-onset Parkinson’s disease caused by mutations in PINK1. Science. 2004;304(5674):1158–1160. doi: 10.1126/science.1096284. [DOI] [PubMed] [Google Scholar]
- 18.Mai S, Klinkenberg M, Auburger G, Bereiter-Hahn J, Jendrach M. Decreased expression of Drp1 and Fis1 mediates mitochondrial elongation in senescent cells and enhances resistance to oxidative stress through PINK1. J Cell Sci. 2010;123(Pt 6):917–926. doi: 10.1242/jcs.059246. [DOI] [PubMed] [Google Scholar]
- 19.Jin SM, Lazarou M, Wang C, Kane LA, Narendra DP, Youle RJ. Mitochondrial membrane potential regulates PINK1 import and proteolytic destabilization by PARL. J Cell Biol. 2010;191(5):933–942. doi: 10.1083/jcb.201008084. [DOI] [PMC free article] [PubMed] [Google Scholar]
- 20.Mei Y, Zhang Y, Yamamoto K, Xie W, Mak TW, You H. FOXO3a-dependent regulation of Pink1 (Park6) mediates survival signaling in response to cytokine deprivation. Proc Natl Acad Sci U S A. 2009;106(13):5153–5158. doi: 10.1073/pnas.0901104106. [DOI] [PMC free article] [PubMed] [Google Scholar]
- 21.Poole AC, Thomas RE, Andrews LA, McBride HM, Whitworth AJ, Pallanck LJ. The PINK1/Parkin pathway regulates mitochondrial morphology. Proc Natl Acad Sci U S A. 2008;105(5):1638–1643. doi: 10.1073/pnas.0709336105. [DOI] [PMC free article] [PubMed] [Google Scholar]
- 22.Deng H, Dodson MW, Huang H, Guo M. The Parkinson’s disease genes pink1 and parkin promote mitochondrial fission and/or inhibit fusion in Drosophila. Proc Natl Acad Sci U S A. 2008;105(38):14503–14508. doi: 10.1073/pnas.0803998105. [DOI] [PMC free article] [PubMed] [Google Scholar]
- 23.Yang Y, Ouyang Y, Yang L, Beal MF, McQuibban A, Vogel H, Lu B. Pink1 regulates mitochondrial dynamics through interaction with the fission/fusion machinery. Proc Natl Acad Sci U S A. 2008;105(19):7070–7075. doi: 10.1073/pnas.0711845105. [DOI] [PMC free article] [PubMed] [Google Scholar]
- 24.Jendrach M, Gispert S, Ricciardi F, Klinkenberg M, Schemm R, Auburger G. The mitochondrial kinase PINK1, stress response and Parkinson’s disease. J Bioenerg Biomembr. 2009;41(6):481–486. doi: 10.1007/s10863-009-9256-0. [DOI] [PubMed] [Google Scholar]
- 25.Dagda RK, Cherra SJ, 3rd, Kulich SM, Tandon A, Park D, Chu CT. Loss of PINK1 function promotes mitophagy through effects on oxidative stress and mitochondrial fission. J Biol Chem. 2009;284(20):13843–13855. doi: 10.1074/jbc.M808515200. [DOI] [PMC free article] [PubMed] [Google Scholar]
- 26.Exner N, Treske B, Paquet D, Holmstrom K, Schiesling C, Gispert S, Carballo-Carbajal I, Berg D, Hoepken HH, Gasser T, Kruger R, Winklhofer KF, Vogel F, Reichert AS, Auburger G, Kahle PJ, Schmid B, Haass C. Loss-of-function of human PINK1 results in mitochondrial pathology and can be rescued by parkin. J Neurosci. 2007;27(45):12413–12418. doi: 10.1523/JNEUROSCI.0719-07.2007. [DOI] [PMC free article] [PubMed] [Google Scholar]
- 27.Gispert S, Ricciardi F, Kurz A, Azizov M, Hoepken HH, Becker D, Voos W, Leuner K, Muller WE, Kudin AP, Kunz WS, Zimmermann A, Roeper J, Wenzel D, Jendrach M, Garcia-Arencibia M, Fernandez-Ruiz J, Huber L, Rohrer H, Barrera M, Reichert AS, Rub U, Chen A, Nussbaum RL, Auburger G. Parkinson phenotype in aged PINK1-deficient mice is accompanied by progressive mitochondrial dysfunction in absence of neurodegeneration. PLoS One. 2009;4(6):e5777. doi: 10.1371/journal.pone.0005777. [DOI] [PMC free article] [PubMed] [Google Scholar]
- 28.Narendra DP, Jin SM, Tanaka A, Suen DF, Gautier CA, Shen J, Cookson MR, Youle RJ. PINK1 is selectively stabilized on impaired mitochondria to activate Parkin. PLoS Biol. 2010;8(1):e1000298. doi: 10.1371/journal.pbio.1000298. [DOI] [PMC free article] [PubMed] [Google Scholar]
- 29.Vives-Bauza C, Zhou C, Huang Y, Cui M, de Vries RL, Kim J, May J, Tocilescu MA, Liu W, Ko HS, Magrane J, Moore DJ, Dawson VL, Grailhe R, Dawson TM, Li C, Tieu K, Przedborski S. PINK1-dependent recruitment of Parkin to mitochondria in mitophagy. Proc Natl Acad Sci U S A. 2010;107(1):378–383. doi: 10.1073/pnas.0911187107. [DOI] [PMC free article] [PubMed] [Google Scholar]
- 30.Geisler S, Holmstrom KM, Skujat D, Fiesel FC, Rothfuss OC, Kahle PJ, Springer W. PINK1/Parkin-mediated mitophagy is dependent on VDAC1 and p62/SQSTM1. Nat Cell Biol. 2010;12(2):119–131. doi: 10.1038/ncb2012. [DOI] [PubMed] [Google Scholar]
- 31.Matsuda N, Sato S, Shiba K, Okatsu K, Saisho K, Gautier CA, Sou YS, Saiki S, Kawajiri S, Sato F, Kimura M, Komatsu M, Hattori N, Tanaka K. PINK1 stabilized by mitochondrial depolarization recruits Parkin to damaged mitochondria and activates latent Parkin for mitophagy. J Cell Biol. 2010;189(2):211–221. doi: 10.1083/jcb.200910140. [DOI] [PMC free article] [PubMed] [Google Scholar]
- 32.Kim Y, Park J, Kim S, Song S, Kwon SK, Lee SH, Kitada T, Kim JM, Chung J. PINK1 controls mitochondrial localization of Parkin through direct phosphorylation. Biochem Biophys Res Commun. 2008;377(3):975–980. doi: 10.1016/j.bbrc.2008.10.104. [DOI] [PubMed] [Google Scholar]
- 33.Sha D, Chin LS, Li L. Phosphorylation of parkin by Parkinson disease-linked kinase PINK1 activates parkin E3 ligase function and NF-kappaB signaling. Hum Mol Genet. 2010;19(2):352–363. doi: 10.1093/hmg/ddp501. [DOI] [PMC free article] [PubMed] [Google Scholar]
- 34.Petrucelli L, O’Farrell C, Lockhart PJ, Baptista M, Kehoe K, Vink L, Choi P, Wolozin B, Farrer M, Hardy J, Cookson MR. Parkin protects against the toxicity associated with mutant alpha-synuclein: proteasome dysfunction selectively affects catecholaminergic neurons. Neuron. 2002;36(6):1007–1019. doi: 10.1016/S0896-6273(02)01125-X. [DOI] [PubMed] [Google Scholar]
- 35.Klinkenberg M, Thurow N, Gispert S, Ricciardi F, Eich F, Prehn JH, Auburger G, Kogel D. Enhanced vulnerability of PARK6 patient skin fibroblasts to apoptosis induced by proteasomal stress. Neuroscience. 2010;166(2):422–434. doi: 10.1016/j.neuroscience.2009.12.068. [DOI] [PubMed] [Google Scholar]
- 36.Tanaka A, Cleland MM, Xu S, Narendra DP, Suen DF, Karbowski M, Youle RJ. Proteasome and p97 mediate mitophagy and degradation of mitofusins induced by Parkin. J Cell Biol. 2010;191(7):1367–1380. doi: 10.1083/jcb.201007013. [DOI] [PMC free article] [PubMed] [Google Scholar]
- 37.Mortimore GE, Schworer CM. Induction of autophagy by amino-acid deprivation in perfused rat liver. Nature. 1977;270(5633):174–176. doi: 10.1038/270174a0. [DOI] [PubMed] [Google Scholar]
- 38.Koch A, Lehmann-Horn K, Dachsel JC, Gasser T, Kahle PJ, Lucking CB. Proteasomal inhibition reduces parkin mRNA in PC12 and SH-SY5Y cells. Parkinsonism Relat Disord. 2009;15(3):220–225. doi: 10.1016/j.parkreldis.2008.05.005. [DOI] [PubMed] [Google Scholar]
- 39.Wang HQ, Imai Y, Kataoka A, Takahashi R. Cell type-specific upregulation of Parkin in response to ER stress. Antioxid Redox Signal. 2007;9(5):533–542. doi: 10.1089/ars.2006.1522. [DOI] [PubMed] [Google Scholar]
- 40.Livak KJ, Schmittgen TD. Analysis of relative gene expression data using real-time quantitative PCR and the 2-[Delta][Delta]CT method. Methods. 2001;25(4):402–408. doi: 10.1006/meth.2001.1262. [DOI] [PubMed] [Google Scholar]
- 41.Pawlyk AC, Giasson BI, Sampathu DM, Perez FA, Lim KL, Dawson VL, Dawson TM, Palmiter RD, Trojanowski JQ, Lee VM. Novel monoclonal antibodies demonstrate biochemical variation of brain parkin with age. J Biol Chem. 2003;278(48):48120–48128. doi: 10.1074/jbc.M306889200. [DOI] [PubMed] [Google Scholar]
- 42.Mai S, Muster B, Bereiter-Hahn J, Jendrach M (2011) Autophagy proteins LC3B, ATG5 and ATG12 participate in quality control after mitochondrial damage and influence lifespan. Autophagy (in press) [DOI] [PMC free article] [PubMed]
- 43.Denison SR, Wang F, Becker NA, Schule B, Kock N, Phillips LA, Klein C, Smith DI. Alterations in the common fragile site gene Parkin in ovarian and other cancers. Oncogene. 2003;22(51):8370–8378. doi: 10.1038/sj.onc.1207072. [DOI] [PubMed] [Google Scholar]
- 44.Su B, Liu H, Wang X, Chen SG, Siedlak SL, Kondo E, Choi R, Takeda A, Castellani RJ, Perry G, Smith MA, Zhu X, Lee HG. Ectopic localization of FOXO3a protein in Lewy bodies in Lewy body dementia and Parkinson’s disease. Mol Neurodegener. 2009;4:32. doi: 10.1186/1750-1326-4-32. [DOI] [PMC free article] [PubMed] [Google Scholar]
- 45.Brunet A, Park J, Tran H, Hu LS, Hemmings BA, Greenberg ME. Protein kinase SGK Mediates survival signals by phosphorylating the forkhead transcription factor FKHRL1 (FOXO3a) Mol Cell Biol. 2001;21(3):952–965. doi: 10.1128/MCB.21.3.952-965.2001. [DOI] [PMC free article] [PubMed] [Google Scholar]
- 46.Stichel CC, Schoenebeck B, Foguet M, Siebertz B, Bader V, Zhu XR, Lubbert H. sgk1, a member of an RNA cluster associated with cell death in a model of Parkinson’s disease. Eur J Neurosci. 2005;21(2):301–316. doi: 10.1111/j.1460-9568.2005.03859.x. [DOI] [PubMed] [Google Scholar]
- 47.Youle RJ, Narendra DP. Mechanisms of mitophagy. Nat Rev. 2011;12(1):9–14. doi: 10.1038/nrm3028. [DOI] [PMC free article] [PubMed] [Google Scholar]
- 48.Kimura S, Noda T, Yoshimori T. Dissection of the autophagosome maturation process by a novel reporter protein, tandem fluorescent-tagged LC3. Autophagy. 2007;3(5):452–460. doi: 10.4161/auto.4451. [DOI] [PubMed] [Google Scholar]
- 49.Klionsky DJ, Elazar Z, Seglen PO, Rubinsztein DC. Does bafilomycin A1 block the fusion of autophagosomes with lysosomes? Autophagy. 2008;4(7):849–950. doi: 10.4161/auto.6845. [DOI] [PubMed] [Google Scholar]
- 50.Blommaart EF, Krause U, Schellens JP, Vreeling-Sindelarova H, Meijer AJ. The phosphatidylinositol 3-kinase inhibitors wortmannin and LY294002 inhibit autophagy in isolated rat hepatocytes. Eur J Biochem. 1997;243(1–2):240–246. doi: 10.1111/j.1432-1033.1997.0240a.x. [DOI] [PubMed] [Google Scholar]
- 51.Park J, Lee SB, Lee S, Kim Y, Song S, Kim S, Bae E, Kim J, Shong M, Kim JM, Chung J. Mitochondrial dysfunction in Drosophila PINK1 mutants is complemented by parkin. Nature. 2006;441(7097):1157–1161. doi: 10.1038/nature04788. [DOI] [PubMed] [Google Scholar]
- 52.Manning BD, Cantley LC. AKT/PKB signaling: navigating downstream. Cell. 2007;129(7):1261–1274. doi: 10.1016/j.cell.2007.06.009. [DOI] [PMC free article] [PubMed] [Google Scholar]
- 53.Yamaguchi H, Wang HG. The protein kinase PKB/Akt regulates cell survival and apoptosis by inhibiting Bax conformational change. Oncogene. 2001;20(53):7779–7786. doi: 10.1038/sj.onc.1204984. [DOI] [PubMed] [Google Scholar]
- 54.Gardai SJ, Hildeman DA, Frankel SK, Whitlock BB, Frasch SC, Borregaard N, Marrack P, Bratton DL, Henson PM. Phosphorylation of Bax Ser184 by Akt regulates its activity and apoptosis in neutrophils. J Biol Chem. 2004;279(20):21085–21095. doi: 10.1074/jbc.M400063200. [DOI] [PubMed] [Google Scholar]
- 55.Jiang H, Ren Y, Zhao J, Feng J. Parkin protects human dopaminergic neuroblastoma cells against dopamine-induced apoptosis. Hum Mol Genet. 2004;13(16):1745–1754. doi: 10.1093/hmg/ddh180. [DOI] [PubMed] [Google Scholar]
- 56.Lo Bianco C, Schneider BL, Bauer M, Sajadi A, Brice A, Iwatsubo T, Aebischer P. Lentiviral vector delivery of parkin prevents dopaminergic degeneration in an alpha-synuclein rat model of Parkinson’s disease. Proc Natl Acad Sci U S A. 2004;101(50):17510–17515. doi: 10.1073/pnas.0405313101. [DOI] [PMC free article] [PubMed] [Google Scholar]
- 57.Berger AK, Cortese GP, Amodeo KD, Weihofen A, Letai A, LaVoie MJ. Parkin selectively alters the intrinsic threshold for mitochondrial cytochrome c release. Hum Mol Genet. 2009;18(22):4317–4328. doi: 10.1093/hmg/ddp384. [DOI] [PMC free article] [PubMed] [Google Scholar]
- 58.Hwang S, Kim D, Choi G, An SW, Hong YK, Suh YS, Lee MJ, Cho KS. Parkin suppresses c-Jun N-terminal kinase-induced cell death via transcriptional regulation in Drosophila. Mol Cells. 2010;29(6):575–580. doi: 10.1007/s10059-010-0068-1. [DOI] [PubMed] [Google Scholar]
- 59.Crosiers D, Theuns J, Cras P, Van Broeckhoven C. Parkinson disease: Insights in clinical, genetic and pathological features of monogenic disease subtypes. J Chem Neuroanat. 2011;42(2):131–141. doi: 10.1016/j.jchemneu.2011.07.003. [DOI] [PubMed] [Google Scholar]
- 60.Webster MK, Goya L, Ge Y, Maiyar AC, Firestone GL. Characterization of sgk, a novel member of the serine/threonine protein kinase gene family which is transcriptionally induced by glucocorticoids and serum. Mol Cell Biol. 1993;13(4):2031–2040. doi: 10.1128/mcb.13.4.2031. [DOI] [PMC free article] [PubMed] [Google Scholar]
- 61.Lang F, Bohmer C, Palmada M, Seebohm G, Strutz-Seebohm N, Vallon V. (Patho)physiological significance of the serum- and glucocorticoid-inducible kinase isoforms. Physiol Rev. 2006;86(4):1151–1178. doi: 10.1152/physrev.00050.2005. [DOI] [PubMed] [Google Scholar]
- 62.Storz P. Forkhead homeobox type O transcription factors in the responses to oxidative stress. Antioxid Redox Signal. 2011;14(4):593–605. doi: 10.1089/ars.2010.3405. [DOI] [PMC free article] [PubMed] [Google Scholar]
- 63.Narendra D, Tanaka A, Suen DF, Youle RJ. Parkin is recruited selectively to impaired mitochondria and promotes their autophagy. J Cell Biol. 2008;183(5):795–803. doi: 10.1083/jcb.200809125. [DOI] [PMC free article] [PubMed] [Google Scholar]
- 64.Fitzgerald JC, Plun-Favreau H. Emerging pathways in genetic Parkinson’s disease: autosomal-recessive genes in Parkinson’s disease—a common pathway? FEBS J. 2008;275(23):5758–5766. doi: 10.1111/j.1742-4658.2008.06708.x. [DOI] [PubMed] [Google Scholar]
- 65.Unoki M, Nakamura Y. Growth-suppressive effects of BPOZ and EGR2, two genes involved in the PTEN signaling pathway. Oncogene. 2001;20(33):4457–4465. doi: 10.1038/sj.onc.1204608. [DOI] [PubMed] [Google Scholar]
Associated Data
This section collects any data citations, data availability statements, or supplementary materials included in this article.
Supplementary Materials
DOC 2615 kb