

Abstract
We present a combined atomic force microscopy and fluorescence microscopy study of the behavior of a ternary supported lipid bilayer system containing a saturated lipid (DPPC), an unsaturated lipid (DOPC), and ergosterol in the presence of high ethanol (20 vol %). We find that the fluorescent probe Texas Red DHPE preferentially partitions into the ethanol-induced interdigitated phase, which allows the use of fluorescence imaging to investigate the phase behavior of the system. Atomic force microscopy and fluorescence images of samples with the same lipid mixture show good agreement in sample morphology and area fractions of the observed phases. Using area fractions obtained from fluorescence images over a broad range of compositions, we constructed a phase diagram of the DPPC/DOPC/ergosterol system at 20 vol % ethanol. The phase diagram clearly shows that increasing unsaturated lipid and/or ergosterol protects the membrane by preventing the formation of the interdigitated phase. This result supports the hypothesis that yeast cells increase ergosterol and unsaturated lipid content to prevent interdigitation and maintain an optimal membrane thickness as ethanol concentration increases during anaerobic fermentations. Changes in plasma membrane composition provide an important survival factor for yeast cells to deter ethanol toxicity.
Introduction
Ethanol, a naturally occurring and biologically important metabolite, can have numerous effects on the function of fermenting microorganisms such as yeasts, as it can impact nutrient metabolism, protein function and biosynthesis, small molecule transport, and membrane structure (1–3). These broad effects may be due partly to the amphiphilic nature of this short-chain alcohol. Although most organisms cannot tolerate high levels of alcohol, certain yeasts (e.g., Saccharomyces cerevisiae) are able to maintain viability in the presence of up to 15–20 vol % ethanol. Through natural and directed evolution, yeasts have developed many strategies, also known as survival factors, to deal with ethanol toxicity (1). One important survival factor is to modify plasma membrane composition by increasing the content of unsaturated lipids and ergosterol (1,2,4,5). Sterols such as ergosterol (Fig. 1), a cholesterol analog and the predominant sterol in yeast, induce the formation of a liquid-ordered (Lo) phase (6,7) and play an important role in modulating membrane dynamics (8,9), structure (10,11), and mechanical properties (12–15) of model membranes. The chemical structure of ergosterol differs from that of cholesterol by the presence of two additional double bonds (at positions C7 and C22) and a methyl group at C24 of the side chain (see Fig. 1). It has been proposed that changes in the plasma membrane composition of yeast cells in response to ethanol toxicity increase membrane fluidity to compensate for the disruption caused by ethanol (1,2). However, it is unclear how the fluidity of the membrane is affected by these changes in composition, as sterols are known to increase order and condense the membrane (6,8,11), whereas unsaturated lipids are likely to have the opposite effect.
Figure 1.
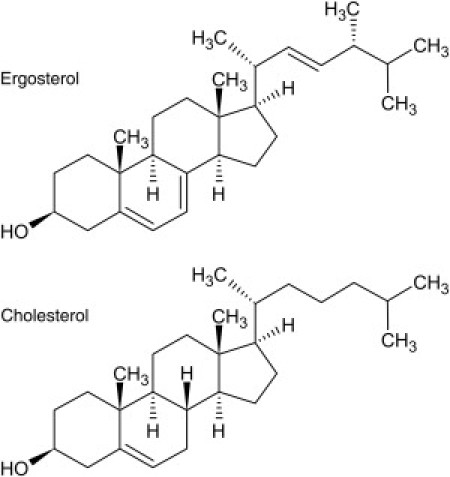
Structure of the sterols ergosterol and cholesterol.
It is generally accepted that short-chain alcohols partition to the lipid-water interface with the hydroxyl group facing the solvent and the hydrocarbons positioned next to the lipid tails (16–19). However, changes in the membrane induced by ethanol can vary depending on the type of lipid and the presence of sterols (20–25), as illustrated in Fig. 2. In the case of membranes composed of unsaturated lipids (i.e., the liquid-disordered phase, Lα), ethanol and other short-chain alcohols reduce the interfacial tension in a concentration-dependent manner, which results in progressive bilayer thinning accompanied by lateral expansion (26,27). Saturated lipids below the transition temperature (i.e., the gel phase, Lβ′) show little structural change until an alcohol threshold is reached, where a phase transition to the interdigitated LβI phase takes place (28–30). The LβI phase has a gel-like structure (29,31) with significantly reduced thickness (LβI phase is 1.9–2.0 nm lower than the Lβ′ phase in 1,2-dipalmitoyl-sn-glycero-3-phosphocholine (DPPC) (23,32,33)) and therefore a large area/molecule (see Slater and Huang (34) for a review of lipid interdigitation). Sterols modulate the formation of the interdigitated phase (21–23). Rowe and co-workers showed that cholesterol gradually reduces the area fraction of LβI-phase DPPC in 12 vol % ethanol and completely eliminates interdigitation at 20 mol % cholesterol (22). In previous work, we quantified this behavior over a large range of DPPC, sterol, and ethanol concentrations by developing the first, to our knowledge, lipid/sterol/ethanol phase diagrams (21). Phase boundaries were determined through step changes in membrane mechanical properties and vesicle appearance. The sloped LβI-phase boundary indicates that with higher amounts of ergosterol or cholesterol, higher amounts of ethanol are required to form the LβI phase and to disrupt mechanical integrity (21).
Figure 2.

Cartoon illustration of the effects of ethanol on the Lα, Lo, and Lβ′ phases at low and high ethanol concentrations. Lipids below the transition temperature (e.g., DPPC) are shown in orange at left and middle, lipids above the transition temperature (e.g., DOPC) are shown in blue at right, and sterols are shown as yellow ellipses. In the case of the Lα phase, ethanol reduces the interfacial tension in a concentration-dependent manner, resulting in progressive bilayer thinning accompanied by lateral expansion. For the Lβ′ and Lo phases, formation of the interdigitated LβI phase is induced above an ethanol threshold that is modulated by sterol concentration. The LβI phase has a gel-like structure with significantly reduced thickness and therefore a large area/molecule.
In this work, we use atomic force microscopy (AFM) and fluorescence microscopy to study the behavior of ternary model membranes composed of the saturated lipid DPPC, the unsaturated lipid 1,2-dioleoyl-sn-glycero-3-phosphocholine (DOPC), and ergosterol exposed to ethanol. Inclusion of the unsaturated lipid provides a model system that, in comparison to our previous studies (21,23), more closely resembles a real yeast plasma membrane, which contains a large number of unsaturated lipid species (35). AFM has been widely used to study the effects of ethanol (23,24,33,36) and other anesthetics (32,37,38) on model supported membranes, as it provides high-resolution details of both the morphology and the membrane thickness. However, the discrepancy in the amounts of ethanol (5–10 times higher), long incubation periods, and reheating after bilayer formation required to induce interdigitation in supported versus unsupported membranes of a single saturated lipid, due to the interaction with the support, presented a barrier for this type of ethanol study (23,33,36). In a previous report (23), we developed a sample-preparation methodology, utilized here, that minimizes the influence of the support on the observed effects of ethanol on the bilayer and eliminates the discrepancy. Although this methodology is not particularly complicated, mainly including ethanol and buffer throughout the preparation process, beginning with the resuspension of the dry lipids, it allowed us to reproduce the phase boundaries observed in unsupported DPPC/ethanol systems (21,23,28). Fluorescence microscopy has also played an important role in understanding phase changes caused by ethanol (20,22,30,39), although the fluorescent probes have been used to sense changes in the lipid environment and not to directly image samples. In this report, we image supported lipid bilayers (SLBs) using tapping-mode AFM to identify interdigitated LβI-phase, Lα, and Lo phases over a narrow composition range. These images are then correlated with the observed probe partitioning of Texas red 1,2-dihexadecanoyl-sn-glycero-3-phosphoethanolamine (TR-DHPE) over the same composition range such that phases can be identified and their area fractions quantified using fluorescence microscopy of SLBs. Using measured area fractions of phases, we develop a pseudo-ternary-phase diagram for DPPC/DOPC/ergosterol membranes in 20 vol % ethanol. Based upon this phase diagram, we propose what to our knowledge is a new mechanism to explain how increases in unsaturated lipid and ergosterol content improve ethanol tolerance in yeast membranes.
Materials and Methods
Materials
DPPC, DOPC, and 1-oleoyl-2-(6-((7-nitro-2-1,3-benzoxadiazol-4-yl)amino)hexanoyl)-sn-glycero-3-phosphocholine (NBD-PC) were obtained from Avanti Polar Lipids (Alabaster, AL). Ergosterol was purchased from Sigma-Aldrich (St. Louis, MO). TR-DHPE was obtained from Invitrogen (Carlsbad, CA). Phosphate-buffered saline (PBS) 10× powder concentrate, HPLC-grade chloroform, and ACS-grade ethanol (99.5%) were purchased from Fisher Scientific (Pittsburgh, PA). All materials were used without further purification. All water used in these experiments was purified in a Barnstead Nanopure System (Barnstead Thermolyne, Dubuque, IA) with a resistivity ≥17.9 MΩ. PBS-ethanol buffer (137 mM NaCl, 2.6 mM KCl, 9.7 mM Na2HPO4, 2.2 mM KH2PO4, and 20 vol % ethanol) was adjusted to pH 7.4. Grade V2 muscovite mica was obtained from Ted Pella (Redding, CA).
Methods
Supported lipid bilayers
Supported lipid bilayers were formed using the vesicle deposition method. Briefly, lipid mixtures (multicomponent mixtures containing DPPC, DOPC, and ergosterol with or without a fluorescent probe) in chloroform were dried under nitrogen and desiccated under vacuum for 30 min. Multilamellar vesicles were then created by resuspending the dry lipids with PBS-20 vol % ethanol buffer heated to 65°C to achieve a lipid concentration of 0.5–1 mg/mL. Vesicle solutions were then sonicated using a tip sonicator (Branson sonifier 250, Branson Ultrasonics, Danbury, CT) at medium power for 30 s, then at low power for 30 s, to create small unilamellar vesicles. A 200- to 400-μL aliquot of the small unilamellar vesicle solution was immediately deposited on freshly cleaved mica and allowed to incubate for 10 min. After incubation, the samples were submerged in PBS-20 vol % ethanol buffer at 65°C and rinsed within the solution with a pipette to remove any unfused vesicles. All solutions were maintained in tightly sealed containers during sample preparation, including heating, to prevent evaporation of the ethanol in solution. Samples were allowed to cool at room temperature over a period of 1.5–2 h.
Atomic force and fluorescence microscopy
Tapping-mode AFM (TM-AFM) imaging was carried out using a Veeco Dimension 3100 AFM equipped with a Closed Loop Hybrid XYZ scanner head (Veeco Metrology, Santa Barbara, CA) at 23°C. MSNL cantilevers (silicon nitride levers with sharp silicon crystal tips of radius <2 nm) with spring constants 0.1–1.0 N/m were also purchased from Veeco. Samples imaged with TM-AFM contained no fluorescent probes. Fluorescence imaging of samples containing either 0.5 mol % NBD-PC or 0.5 mol % TR-DHPE was carried out with a Nikon Eclipse 400 fluorescence microscope (Nikon, Melville, NY) equipped with fluorescence filter cubes that match the emission spectra of NBD-PC and TR-DHPE and a 60× water immersion lens. Images were captured with a high-resolution Orca digital camera (Hamamatsu, Japan). Samples for fluorescence imaging were maintained at 22°C ± 1°C using a custom-made temperature-controlled sample holder to prevent changes in the phase behavior caused by heating from the illumination.
Results and Discussion
Identification of Lo, Lα, and LβI phases—comparison of TM-AFM and fluorescence data
A ternary lipid membrane composed of DPPC, DOPC, and ergosterol can form up to three phases: a DOPC-rich Lα phase, a DPPC-rich Lo phase, and a DPPC-rich gel Lβ′phase. In the presence of ethanol, both the Lo and Lβ′ phases can become interdigitated (Fig. 2), forming the LβI phase at a sterol-dependent concentration (21,23). To reduce the possible number of lipid phases to three, Lo, Lα and LβI (Fig. 2, High Ethanol), and therefore reduce the complexity of the system, all supported bilayers presented in this work were prepared in PBS-20 vol % ethanol buffer using the vesicle-fusion method at high temperature (65°C), allowed to cool over a period of 1.5–2 h, and imaged at room temperature (22°C ± 1°C) also in PBS-20 vol % ethanol buffer. We have previously used this methodology to study DOPC/1,2-distearoyl-sn-glycero-3-phosphocholine (DSPC)/cholesterol systems, and were able to reproduce area fractions, upper critical point, and two-phase to three-phase transition compared to giant unilamellar vesicles (GUVs) (40). Samples were maintained in closed containers throughout preparation and before imaging to prevent evaporation of ethanol. However, the covers of the containers were removed for TM-AFM and fluorescence imaging, and therefore, ethanol concentration may have changed during imaging, although sample morphology was not observed to change over the imaging period. At 20 vol % ethanol in PBS buffer, any membrane regions in the Lβ′ phase are expected to be completely interdigitated, in agreement with the behavior of lipid vesicles, as we showed in our previous work (21,23).
A combination of height and tapping-phase AFM imaging was used to characterize the morphology, relative heights, and general viscoelastic behavior of each of the three phases. For this initial work, a narrow compositional range was selected where it was likely that the three phases, Lo, Lα, and LβI, would coexist. TM-AFM height images generated sufficient contrast to observe three different phases, as shown in Fig. 3. Equilibration and micron-scale domain formation of solid phases may sometimes require long incubation and/or cooling times (see Blanchette et al. (41) and references therein). However, the observed large-scale phase separation (100–200 μm) indicates that our cooling rate (∼20°C/h) was adequate to observe a near-equilibrium distribution of the three phases. In addition, the lipid bilayer, in 20 vol % ethanol, delaminated from the substrate over long periods of time (>12 h, data not shown), limiting the cooling times to a few hours. Lipid bilayers in 20 vol % ethanol have drastically lowered bending moduli (27), accounting for delamination as part of relatively rapid shape remodeling toward an equilibrium distribution of membrane shapes.
Figure 3.

TM-AFM (A–D) and fluorescence (E and F) images of supported DPPC/DOPC/ergosterol (4:1 DPPC/DOPC, 20 mol % ergosterol) bilayers deposited in PBS-20 vol % ethanol buffer, imaged at room temperature. (A and C) Height data (lighter color indicates increased height), with the Lo phase having the tallest features, followed by the LβI and Lα phases. (B and D) Tapping-phase data corresponding to the height images in A and C, respectively. (E) Fluorescence image of sample with 0.5 mol % NBD-PC. (F) Fluorescence image of sample with 0.5 mol % TR-DHPE.
The phase with the thickest lamellae formed circular domains (5–20 μm in size), as demonstrated in Fig. 3, A and C, which shows a sample with 4:1 DPPC/DOPC, 20 mol % ergosterol. This phase was identified as the Lo phase of DPPC, because the Lo phase has been observed to have a higher bilayer thickness compared to both the Lα and LβI phases (∼0.65–1.0 nm larger than the Lα phase (42,43) and 1.9 nm larger than the LβI phase (23) as measured by AFM). Two TM-AFM scans are presented in Fig. 3 to show the large variability of the height data in different scans, as well as to provide a more complete picture of sample morphology. Because of the higher viscosity of the 20 vol % ethanol environment, cantilever oscillation was heavily dampened, requiring the use of shorter, stiffer cantilevers (0.1–1.0 N/m) with 2–10 times higher spring constants than used previously (23). High stiffness of the cantilevers, which results in high imaging force, in addition to some remaining cantilever noise resulted in large variability of the observed height of the lower two phases. Furthermore, high imaging force may have reduced the apparent height of the soft Lα phase. To the best of our knowledge there are no lamellar thickness measurements of DOPC at 20 vol % ethanol (or similar concentrations) with techniques other than AFM, which further limits the use of height data to identify the Lα and LβI phases, as it is not clear what the relative thickness difference is between these two phases. For all these reasons, height data could not be used to directly distinguish the Lα from the LβI phase. One of the two thinner Lα and LβI phases formed radial fingerlike domains that could extend for hundreds of micrometers, as demonstrated in Fig. 3, A and C.
In an attempt to differentiate the Lα and LβI phases, we turned to tapping-phase data collected simultaneously with the height data. Tapping-phase data obtained from TM-AFM measures an angular phase shift in the tip oscillation as an indication of surface viscoelastic properties. Tapping-phase imaging (Fig. 3, B and D) indicated that the radial fingerlike domains had a markedly different tapping phase compared to the other two lipid phases. Previous observation (32) showed that interdigitated domains interact much more strongly with the oscillating AFM tip than do noninterdigitated areas, and therefore, it is likely that these areas corresponded to LβI domains. The third interdomain phase, which appears to have the lowest height in Fig. 3, A and C, is expected to be the Lα phase.
Large-scale (100–200 μm) phase separation makes the characterization of the composition-dependent phase behavior of this supported bilayer system well suited for fluorescence microscopy, a more high-throughput technique in comparison to TM-AFM. In addition, fluorescent probe partitioning can give further verification as to the identity of each of the three phases. Although it would be tempting to switch to GUVs for the production of a phase diagram using fluorescence microscopy, similar to what was done in the work of Veatch et al. (44,45), we have shown in previous work that GUVs collapse into multilayer stacks when interdigitated phase forms (21). An attempt to form GUVs in the three-phase (Lo, Lα, and LβI) region here also was not successful (data not shown). To examine the probe partitioning behavior we employed two commonly used fluorescent probes, NBD-PC and TR-DHPE at 0.5 mol %, in three-phase (Lo, Lα, and LβI) supported lipid bilayers. Both of these probes have been shown to preferentially partition into the Lα phase (46,47) when Lo or Lβ′phases are also present. However, their partitioning behavior in the presence of LβI phase was, to our knowledge, hitherto unknown. As demonstrated in Fig. 3 E, fluorescence imaging of NBD-PC (4:1 DPPC/DOPC, 20 mol % ergosterol) shows that the probe only partitioned into one of the three lipid phases and both the radial fingerlike and circular domains showed minimal fluorescence intensity. This result provides further evidence that the radial fingerlike domains are indeed interdigitated regions, as it is known that the LβI phase has a gel-like structure (29,31) and that therefore, the NBD-PC molecule will preferentially avoid this phase.
Fluorescence imaging using the probe TR-DHPE showed three distinct phases, with the brightest fluorescence intensity displayed by the radial fingerlike LβI phase, as shown in Fig. 3 F. Although TR-DHPE typically partitions into liquid-disordered phases, partitioning of this probe into the LβI phase is not completely unexpected, as we hypothesize that the large area expansion caused by interdigitation (31,37), illustrated in Fig. 2, can accommodate the large hydrophobic headgroup of the probe. Initial fluorescence intensity of both Lα and LβI phases was very similar, although the TR-DHPE probe bleached significantly faster in the Lα phase (data not shown) and also appeared to frequently accumulate at the edges of the LβI domains. Due to this clear difference in the fluorescence intensity of the three lipid phases, we used TR-DHPE fluorescence imaging to develop the phase diagram presented in the following section. The morphology and size of domains (Fig. 3, A–F), in addition to measured area fractions from multiple images (Table 1), show agreement within error (∼±0.04) between 4:1 DPPC/DOPC, 20 mol % ergosterol samples that contain a fluorescent probe (either NBD-PC or TR-DHPE), as imaged by fluorescence microscopy, and those that do not, as imaged by TM-AFM.
Table 1.
Area fractions of TM-AFM and fluorescence images for DPPC/DOPC/ergosterol samples
| Af Lα | Af Lo | Af LβI | |
|---|---|---|---|
| TM-AFM∗ | 0.39 ± 0.05 | 0.21 ± 0.03 | 0.40 ± 0.07 |
| TR-DHPE† | 0.39 ± 0.04 | 0.15 ± 0.02 | 0.46 ± 0.05 |
| NBD-PC† | 0.39 ± 0.03 | 0.61 ± 0.03‡ | |
DPPC/DOPC/ergosterol ratio was 4:1 DPPC/DOPC, 20 mol % ergosterol, in PBS-20 vol % ethanol buffer.
Average of four images. Samples contained no fluorescent probe.
Average of 10 images, 0.5 mol % fluorescent probe
Af for Lo + LβI.
Although there are clear advantages for both TM-AFM and fluorescence microscopy, both techniques have limitations and may have affected the observed phase behavior of the supported bilayers. In the case of TM-AFM in 20 vol % ethanol, the need to use shorter, stiffer cantilevers may pose multiple problems due to the high imaging force, for example, reduction in the apparent bilayer thickness (particularly for the soft Lα phase) and partial reversal of interdigitation (high imaging force has been reported to revert interdigitation (37)). In addition, the long imaging times (20–30 min/scan) made samples susceptible to evaporation of ethanol, which may have caused changes in the phase behavior over time. Although no visible changes of sample morphology were observed during continuous scanning, the TM-AFM data presented here need to be considered with some caution. The fast imaging and larger scan areas in fluorescence microscopy (2.5 times larger than in TM-AFM) minimize evaporation effects and provide better statistics due to the large lengthscale of phase separation in samples displaying LβI domains. However, these advantages come at the cost of possible changes in the phase behavior from the presence of the fluorescent probe. Recent experimental (48,49) and computational (50) reports indicate that small amounts (0.05–5 mol %) of fluorescent probe can affect the mechanical properties and miscibility boundaries in lipid bilayers. Fluorescent probes may also affect the phase behavior of the system due to light-induced lipid peroxides, which may induce domain formation particularly at phase boundaries (51,52). We expect that this may perturb the phase boundaries (coexistence regions may appear larger) discussed in the following section, yet it should not change the general behavior of the system. Independent of the perturbations caused by each technique, the good agreement in sample morphology and area fractions supports the use of fluorescence microscopy to study the phase behavior of the system, and the large-scale phase separation ensures that this lower-resolution technique is adequate for observing the phase-separation boundaries.
Phase boundaries of ternary DPPC/DOPC/ergosterol membranes in 20 vol % ethanol
A membrane composed of DPPC, DOPC, and ergosterol in the presence of 20 vol % ethanol can exhibit up to three lipid phases, Lα, Lo, and LβI, depending on composition. To systematically develop a pseudo-ternary-phase diagram, we performed fluorescence microscopy on a broad spectrum of supported lipid bilayer compositions ranging from 1:4 to 1:0 DPPC/DOPC lipid ratios and from 0 to 55 mol % ergosterol containing 0.5 mol % TR-DHPE in PBS-20 vol % ethanol buffer. Lo domains were identified by their circular morphology and their minimal fluorescence intensity, and interdigitated LβI domains were identified by the radial fingerlike domain morphology, in addition to having the highest fluorescence intensity. Area fractions (Af) of each phase measured from these images are presented in Table 2. Using the area fraction data, phase boundaries were defined by the appearance/disappearance of a phase and, in the case of the upper and lower Lo + LβI coexistence boundaries, by estimating the mole fractions, as discussed in the following paragraphs. In the phase diagram as presented in Fig. 4, each composition that was imaged is displayed as a pie chart showing the measured area fraction of each phase. As discussed in the previous section, the presence of a fluorescent probe may perturb the presented phase boundaries, yet the general behavior of the system should not be affected.
Table 2.
Area fractions of DPPC/DOPC/ergosterol samples in PBS-20 vol % ethanol buffer with 0.5 mol % TR-DHPE
| DPPC/DOPC | Erg (mol %) | Af Lα | Af Lo | Af LβI |
|---|---|---|---|---|
| 1:4 | 0 | 1.00 | — | — |
| 1:4 | 10 | 1.00 | — | — |
| 1:4 | 30 | 1.00 | — | — |
| 2:3 | 0 | 0.75 ± 0.08 | — | 0.25 ± 0.08 |
| 2:3 | 10 | 0.90 ± 0.02 | 0.05 ± 0.01 | 0.05 ± 0.02 |
| 2:3 | 20 | 0.95 ± 0.01 | 0.05 ± 0.01 | — |
| 2:3 | 30 | 0.93 ± 0.01 | 0.07 ± 0.01 | — |
| 3:2 | 0 | 0.42 ± 0.10 | — | 0.58 ± 0.10 |
| 3:2 | 10 | 0.53 ± 0.13 | 0.04 ± 0.03 | 0.43 ± 0.15 |
| 3:2 | 20 | 0.57 ± 0.12 | 0.12 ± 0.04 | 0.31 ± 0.16 |
| 3:2 | 30 | 0.73 ± 0.04 | 0.26 ± 0.05 | 0.01 ± 0.02 |
| 3:2 | 45 | 0.68 ± 0.02 | 0.32 ± 0.02 | — |
| 3:2 | 55 | 0.73 ± 0.02 | 0.27 ± 0.02 | — |
| 4:1 | 10 | 0.29 ± 0.08 | 0.03 ± 0.02 | 0.68 ± 0.09 |
| 4:1 | 20 | 0.39 ± 0.04 | 0.15 ± 0.02 | 0.46 ± 0.05 |
| 4:1 | 30 | 0.38 ± 0.06 | 0.27 ± 0.03 | 0.35 ± 0.08 |
| 9:1 | 0 | 0.25 ± 0.15 | — | 0.75 ± 0.15 |
| 9:1 | 10 | 0.16 ± 0.03 | 0.07 ± 0.01 | 0.77 ± 0.04 |
| 9:1 | 20 | 0.22 ± 0.03 | 0.16 ± 0.02 | 0.62 ± 0.05 |
| 9:1 | 30 | 0.19 ± 0.03 | 0.39 ± 0.04 | 0.42 ± 0.04 |
| 9:1 | 45 | 0.23 ± 0.04 | 0.77 ± 0.04 | — |
| 1:0 | 10 | — | 0.10 ± 0.01 | 0.90 ± 0.01 |
| 1:0 | 20 | — | 0.23 ± 0.03 | 0.77 ± 0.03 |
| 1:0 | 30 | — | 0.42 ± 0.02 | 0.58 ± 0.02 |
Area fractions averaged from 10–15 images obtained from two to four independent samples. Error estimates are the standard deviation from the mean.
Figure 4.
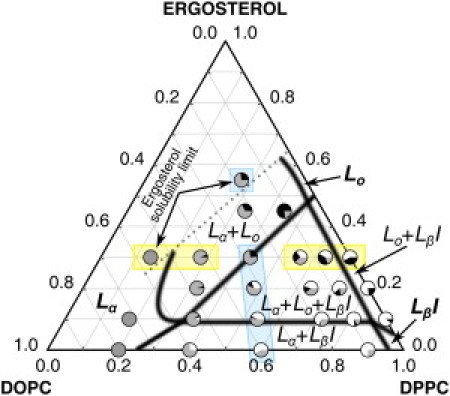
Phase diagram of DPPC/DOPC/ergosterol bilayers in PBS-20 vol % ethanol buffer, 22°C. Shaded areas in each circle indicate the area fraction for each phase. Black, gray, and white represent the liquid ordered (Lo), liquid disordered (Lα), and interdigitated (LβI) phases, respectively. This diagram shares common features with known DOPC/DPPC/cholesterol phase diagrams (53,54) in the absence of ethanol near room temperature: two regions of gel-fluid coexistence (Lα + LβI and Lo + LβI) that extend to the axes, a three-phase triangle (Lα + Lo + LβI), and a region of fluid-fluid (Lα + Lo) coexistence. The dotted line to the left of the Lα + Lo coexistence region indicates an approximate boundary where ergosterol has reached a solubility limit. Images for vertical points highlighted in blue are shown in Fig. 5, A–E, and images for horizontal points highlighted in yellow are shown in Fig. 5, F–J.
With the LβI phase completely replacing the Lβ′ phase, the DOPC/DPPC/ergosterol phase diagram in the presence of high ethanol (Fig. 4) shares features with known ethanol-free DOPC/DPPC/cholesterol phase diagrams (53,54). The phase diagram presents two regions of gel-fluid coexistence (Lα + LβI and Lo + LβI) that extend to the axes, a three-phase triangle (Lα + Lo + LβI), and a region of fluid-fluid (Lα + Lo) coexistence. At the bottom axis, corresponding to 0 mol % ergosterol, the Lα + LβI coexistence region is bounded between 25 and 95 mol % DPPC approximately. The morphology of this region was characterized by bright fingerlike domains of LβI phase and a darker Lα phase, as shown in Fig. 5 A (3:2 DPPC/DOPC, 0 mol % ergosterol). The lower boundary of the three-phase triangle is located slightly below 10 mol % ergosterol. This location was chosen because at 10 mol % ergosterol, a small fraction of Lo domains (0.03–0.07 Af Lo), characterized by being the darkest phase, as shown in Fig. 5 B, coexisted with LβI and Lα phase from 2:3 to 9:1 DPPC/DOPC.
Figure 5.

Fluorescence images of supported bilayers deposited in PBS-20 vol % ethanol buffer and various DPPC/DOPC/ergosterol (0.5 mol % TR-DHPE) ratios, imaged at 22°C. (A–E) DPPC/DOPC ratio is fixed at 3:2 and ergosterol is increased from 0 to 55 mol %. (F–J) Ergosterol concentration is fixed at 30 mol % and DPPC/DOPC ratio is varied from 1:0 to 1:4. (E and J) Formation of ergosterol monohydrate crystals (white dashed outline) due to an ergosterol solubility limit.
A rather large three-phase triangle (Lα + Lo + LβI) exists with this system because of large gel-fluid coexistence regions on both axes. The left boundary of the three-phase triangle was identified by the disappearance of the bright interdigitated phase, as demonstrated in the transition from Fig. 5 C to Fig. 5 D (3:2 DPPC/DOPC, 20 mol % ergosterol and 30 mol % ergosterol, respectively). Our data indicate that a large fluid-fluid (Lα + Lo) coexistence region exists above this boundary, indicated by the presence of coexisting dark (Lo) and lighter (Lα) regions, as shown in Fig. 5 D, even at 45 mol % ergosterol (Table 2). Increasing the ergosterol content to 55 mol % had little effect on the observed area fractions and sample morphology compared to the same DPPC fraction at 45 mol % ergosterol, except for the appearance of ergosterol monohydrate crystals (Fig. 5 E) due to limited solubility.
At the right axis, corresponding to 0 mol % DOPC, the Lo + LβI coexistence region is placed approximately within 5 and 50 mol % ergosterol (±5–10%). To obtain these boundaries, the lever rule was applied to estimated mole fractions of the two phases for three imaged compositions on the right axis. Although the area/molecule of the interdigitated phase is not well known, this value can be estimated from the lamellar thickness reduction assuming conservation of volume of the lipid bilayer. In the case of DPPC, the reduction in the lamellar thickness is 30–40% (16,23,31,33), which results in the area/molecule of the LβI phase being 1.4–1.7 times that of the Lβ′ phase. Relative mole fractions can then be estimated from the DPPC and DPPC/ergosterol area fractions by using this ratio. The morphology of the Lo + LβI coexistence region was characterized by bright fingerlike LβI-phase domains coexisting with dark Lo regions, as shown in Fig. 5 F. The upper boundary of the Lo + LβI coexistence region at 50 mol % ergosterol is in good agreement with a change in mechanical properties at 20 vol % ethanol and 40 mol % ergosterol of GUVs (21). In our previous work, we correctly identified the transition as a loss of the LβI phase, but because we lacked structural data at the time, we incorrectly labeled this transition as a three-phase to two-phase transition (21). The right boundary of the three-phase (Lα + Lo + LβI) coexistence triangle is placed close to the right axis, indicating a narrow Lo + LβI coexistence region. This was done because a relatively large area fraction of Lα phase (0.16–0.25 Af) consistently exists at 9:1 DPPC/DOPC within the three-phase region, as demonstrated in Fig. 5 G (9:1 DPPC/DOPC, 30 mol % ergosterol). Decreasing DPPC and increasing DOPC content introduced more Lα area fraction and further decreased interdigitated areas of the three-phase region, as shown in the transition from Fig. 5 G to Fig. 5 H (4:1 DPPC/DOPC, 30 mol % ergosterol).
The left boundary of the Lα + Lo coexistence region between 10 and 30 mol % ergosterol is placed to the left of 2:3 DPPC/DOPC where a large area fraction (0.9 to 0.95 Af) of Lα phase in comparison to Lo is present, as demonstrated in Fig. 5 I. At low DPPC (1:4 DPPC/DOPC (Fig. 5 J)), a uniform Lα phase was observed, independent of ergosterol concentration, although ergosterol solubility was limited, as indicated by the formation of ergosterol monohydrate crystals at 30 mol %. The dotted line on the left of the Lα + Lo coexistence region delineates the boundary where the ergosterol solubility limit is observed in two compositions.
Preventing ethanol-induced interdigitation—cooperation of unsaturated lipid and ergosterol
The sequence of images presented in Fig. 5, in addition to the phase diagram in Fig. 4, clearly shows that there are three ways to minimize and eliminate the LβI interdigitated phase: increasing ergosterol content (Fig. 5, A–E), increasing the content of unsaturated lipid (e.g., DOPC, Fig. 5, F–J), or increasing both. This result has important implications for understanding membrane-related mechanisms for ethanol tolerance in yeasts. As discussed in the introduction, ethanol induces thinning of the membrane regardless of the lipid phase. However, the thickness reduction due to interdigitation occurs drastically above an ethanol threshold and is very large (a 30–40% reduction in lamellar thickness compared to Lβ′ or Lo phases (16,23,31,33)). On the other hand, ethanol-induced thickness reduction due to lowering of the interfacial tension in the Lα phase takes place progressively, and even at 20 vol %, the thickness reduction is estimated to be 20% (27). Thickness of the plasma membrane has been shown to directly affect membrane-protein function, and the highest protein activity takes place at an optimal membrane thickness (55–59). Sensitivity of membrane proteins to membrane thickness is thought to be caused by the large energy penalty generated by the hydrophobic mismatch when the thickness is above or below an optimum value (60–62). In this light, it is clear that yeast cells must compensate for the ethanol-induced reduction of membrane thickness to sustain viability. Our results support the hypothesis that yeast cells increase the content of unsaturated lipids and ergosterol to prevent ethanol-induced reduction of thickness and interdigitation of the plasma membrane. More recent studies indicate that the unsaturated lipid content plays the more important role here (63–65). Unsaturated lipid fatty acid chains are present up to 60 mol %, and the longer unsaturated chains tend to increase in content during ethanol fermentation in more alcohol-tolerant yeasts (66). Ergosterol levels are often much lower, near 10 mol %, although many studies have shown that increases in ergosterol confer enhanced ethanol tolerance in yeasts (67–69). Through such changes in composition, yeast cells are able to maintain an optimal membrane thickness and preserve the activity of membrane proteins as ethanol concentration increases; this idea puts forward a unifying concept for the seemingly opposite effects that unsaturated lipids and ergosterol have on membrane mechanical properties and ordering.
Conclusions
Combining AFM and fluorescence microscopy, we are able to better understand the important role that unsaturated lipids and ergosterol may play in protecting the yeast plasma membrane from ethanol-induced interdigitation. TM-AFM data in addition to fluorescence imaging of DPPC/DOPC/ergosterol bilayers in PBS-20 vol % ethanol buffer allowed identification of the three observed lipid phases (Lo, Lα, and LβI). Tapping-phase images provided by TM-AFM played an important role in distinguishing the LβI domains, as the large variability in the height data made height images unsuitable for this purpose. TM-AFM also provided control images of the morphology of the bilayers in the absence a fluorescent probe. Fluorescence images showed interesting behavior of the two commonly used fluorescent probes. As expected, NBD-PC only partitioned in the liquid disordered Lα phase, with the other two phases showing minimal and indistinguishable fluorescence intensity. On the other hand, fluorescent images of bilayers containing TR-DHPE showed highest fluorescent intensity in the radial fingerlike LβI domains, which we hypothesize is due to the large area expansion caused by interdigitation. The unexpected observation of partitioning of the fluorescent probe TR-DHPE into the gel-like LβI phase, which made it possible to differentiate all three lipid phases by fluorescence intensity, allowed us to use fluorescence imaging to statistically analyze large-scale phase separation (100–200 μm) over a range of compositions. Area fractions obtained from the fluorescence imaging permitted identification of phase boundaries and the construction of the phase diagram. This phase diagram shows our most important result: increasing ergosterol and/or unsaturated lipid content reduces interdigitation. The importance of this result stems from the fact that these two membrane components tend to have opposite effects on the mechanical properties and ordering of model membranes. Our results support the hypothesis that ergosterol and unsaturated lipids may act cooperatively to prevent interdigitation and maintain an optimal membrane thickness, which therefore can protect membrane-protein function in the presence of ethanol.
Acknowledgments
The authors thank Professor David Block and Clark Henderson for helpful discussions.
This work was supported by U.S. Department of Agriculture grant 2007-02140. J.M.V. acknowledges support from National Institutes of Health Initiative for Maximizing Student Diversity grant R25 GM056765.
References
- 1.Bisson L.F. Stuck and sluggish fermentations. Am. J. Enol. Vitic. 1999;50:107–119. [Google Scholar]
- 2.Ma M., Liu Z.L. Mechanisms of ethanol tolerance in Saccharomyces cerevisiae. Appl. Microbiol. Biotechnol. 2010;87:829–845. doi: 10.1007/s00253-010-2594-3. [DOI] [PubMed] [Google Scholar]
- 3.Jones R.P. Biological principles for the effects of ethanol. Enzyme Microb. Technol. 1989;11:130–153. [Google Scholar]
- 4.You K.M., Rosenfield C.L., Knipple D.C. Ethanol tolerance in the yeast Saccharomyces cerevisiae is dependent on cellular oleic acid content. Appl. Environ. Microbiol. 2003;69:1499–1503. doi: 10.1128/AEM.69.3.1499-1503.2003. [DOI] [PMC free article] [PubMed] [Google Scholar]
- 5.Arroyo-López F.N., Salvadó Z., Querol A. Susceptibility and resistance to ethanol in Saccharomyces strains isolated from wild and fermentative environments. Yeast. 2010;27:1005–1015. doi: 10.1002/yea.1809. [DOI] [PubMed] [Google Scholar]
- 6.Sankaram M.B., Thompson T.E. Cholesterol-induced fluid-phase immiscibility in membranes. Proc. Natl. Acad. Sci. USA. 1991;88:8686–8690. doi: 10.1073/pnas.88.19.8686. [DOI] [PMC free article] [PubMed] [Google Scholar]
- 7.Marsh D. Cholesterol-induced fluid membrane domains: a compendium of lipid-raft ternary phase diagrams. Biochim. Biophys. Acta. 2009;1788:2114–2123. doi: 10.1016/j.bbamem.2009.08.004. [DOI] [PubMed] [Google Scholar]
- 8.Bloch K.E. Sterol structure and membrane function. CRC Crit. Rev. Biochem. 1983;14:47–92. doi: 10.3109/10409238309102790. [DOI] [PubMed] [Google Scholar]
- 9.Rubenstein J.L., Smith B.A., McConnell H.M. Lateral diffusion in binary mixtures of cholesterol and phosphatidylcholines. Proc. Natl. Acad. Sci. USA. 1979;76:15–18. doi: 10.1073/pnas.76.1.15. [DOI] [PMC free article] [PubMed] [Google Scholar]
- 10.Bacia K., Schwille P., Kurzchalia T. Sterol structure determines the separation of phases and the curvature of the liquid-ordered phase in model membranes. Proc. Natl. Acad. Sci. USA. 2005;102:3272–3277. doi: 10.1073/pnas.0408215102. [DOI] [PMC free article] [PubMed] [Google Scholar]
- 11.Hung W.-C., Lee M.-T., Huang H.W. The condensing effect of cholesterol in lipid bilayers. Biophys. J. 2007;92:3960–3967. doi: 10.1529/biophysj.106.099234. [DOI] [PMC free article] [PubMed] [Google Scholar]
- 12.Méléard P., Gerbeaud C., Bothorel P. Bending elasticities of model membranes: influences of temperature and sterol content. Biophys. J. 1997;72:2616–2629. doi: 10.1016/S0006-3495(97)78905-7. [DOI] [PMC free article] [PubMed] [Google Scholar]
- 13.Needham D., McIntosh T.J., Evans E. Thermomechanical and transition properties of dimyristoylphosphatidylcholine/cholesterol bilayers. Biochemistry. 1988;27:4668–4673. doi: 10.1021/bi00413a013. [DOI] [PubMed] [Google Scholar]
- 14.Needham D., Nunn R.S. Elastic deformation and failure of lipid bilayer membranes containing cholesterol. Biophys. J. 1990;58:997–1009. doi: 10.1016/S0006-3495(90)82444-9. [DOI] [PMC free article] [PubMed] [Google Scholar]
- 15.Chen Z., Rand R.P. The influence of cholesterol on phospholipid membrane curvature and bending elasticity. Biophys. J. 1997;73:267–276. doi: 10.1016/S0006-3495(97)78067-6. [DOI] [PMC free article] [PubMed] [Google Scholar]
- 16.Adachi T., Takahashi H., Hatta I. Interdigitated structure of phospholipid-alcohol systems studied by x-ray diffraction. Biophys. J. 1995;68:1850–1855. doi: 10.1016/S0006-3495(95)80361-9. [DOI] [PMC free article] [PubMed] [Google Scholar]
- 17.Barry J.A., Gawrisch K. Direct NMR evidence for ethanol binding to the lipid-water interface of phospholipid bilayers. Biochemistry. 1994;33:8082–8088. doi: 10.1021/bi00192a013. [DOI] [PubMed] [Google Scholar]
- 18.Kranenburg M., Vlaar M., Smit B. Simulating induced interdigitation in membranes. Biophys. J. 2004;87:1596–1605. doi: 10.1529/biophysj.104.045005. [DOI] [PMC free article] [PubMed] [Google Scholar]
- 19.Feller S.E., Brown C.A., Gawrisch K. Nuclear Overhauser enhancement spectroscopy cross-relaxation rates and ethanol distribution across membranes. Biophys. J. 2002;82:1396–1404. doi: 10.1016/S0006-3495(02)75494-5. [DOI] [PMC free article] [PubMed] [Google Scholar]
- 20.Tran R., Ho S., Dea P. Effects of ethanol on lipid bilayers with and without cholesterol: the distearoylphosphatidylcholine system. Biophys. Chem. 2004;110:39–47. doi: 10.1016/j.bpc.2004.01.005. [DOI] [PubMed] [Google Scholar]
- 21.Tierney K.J., Block D.E., Longo M.L. Elasticity and phase behavior of DPPC membrane modulated by cholesterol, ergosterol, and ethanol. Biophys. J. 2005;89:2481–2493. doi: 10.1529/biophysj.104.057943. [DOI] [PMC free article] [PubMed] [Google Scholar]
- 22.Komatsu H., Rowe E.S. Effect of cholesterol on the ethanol-induced interdigitated gel phase in phosphatidylcholine: use of fluorophore pyrene-labeled phosphatidylcholine. Biochemistry. 1991;30:2463–2470. doi: 10.1021/bi00223a024. [DOI] [PubMed] [Google Scholar]
- 23.Vanegas J.M., Faller R., Longo M.L. Influence of ethanol on lipid/sterol membranes: phase diagram construction from AFM imaging. Langmuir. 2010;26:10415–10418. doi: 10.1021/la1012268. [DOI] [PubMed] [Google Scholar]
- 24.Marquês J.T., Viana A.S., De Almeida R.F.M. Ethanol effects on binary and ternary supported lipid bilayers with gel/fluid domains and lipid rafts. Biochim. Biophys. Acta. 2011;1808:405–414. doi: 10.1016/j.bbamem.2010.10.006. [DOI] [PubMed] [Google Scholar]
- 25.Dickey A.N., Yim W.S., Faller R. Using ergosterol to mitigate the deleterious effects of ethanol on bilayer structure. J. Phys. Chem. B. 2009;113:2388–2397. doi: 10.1021/jp803092z. [DOI] [PMC free article] [PubMed] [Google Scholar]
- 26.Ly H.V., Block D.E., Longo M.L. Interfacial tension effect of ethanol on lipid bilayer rigidity, stability, and area/molecule: a micropipet aspiration approach. Langmuir. 2002;18:8988–8995. [Google Scholar]
- 27.Ly H.V., Longo M.L. The influence of short-chain alcohols on interfacial tension, mechanical properties, area/molecule, and permeability of fluid lipid bilayers. Biophys. J. 2004;87:1013–1033. doi: 10.1529/biophysj.103.034280. [DOI] [PMC free article] [PubMed] [Google Scholar]
- 28.Löbbecke L., Cevc G. Effects of short-chain alcohols on the phase behavior and interdigitation of phosphatidylcholine bilayer membranes. Biochim. Biophys. Acta. 1995;1237:59–69. doi: 10.1016/0005-2736(95)00076-f. [DOI] [PubMed] [Google Scholar]
- 29.Nambi P., Rowe E.S., McIntosh T.J. Studies of the ethanol-induced interdigitated gel phase in phosphatidylcholines using the fluorophore 1,6-diphenyl-1,3,5-hexatriene. Biochemistry. 1988;27:9175–9182. doi: 10.1021/bi00426a015. [DOI] [PubMed] [Google Scholar]
- 30.Rowe E.S., Campion J.M. Alcohol induction of interdigitation in distearoylphosphatidylcholine: fluorescence studies of alcohol chain length requirements. Biophys. J. 1994;67:1888–1895. doi: 10.1016/S0006-3495(94)80671-X. [DOI] [PMC free article] [PubMed] [Google Scholar]
- 31.Simon S.A., McIntosh T.J. Interdigitated hydrocarbon chain packing causes the biphasic transition behavior in lipid/alcohol suspensions. Biochim. Biophys. Acta. 1984;773:169–172. doi: 10.1016/0005-2736(84)90562-5. [DOI] [PubMed] [Google Scholar]
- 32.Leonenko Z.V., Finot E., Cramb D.T. AFM study of interaction forces in supported planar DPPC bilayers in the presence of general anesthetic halothane. Biochim. Biophys. Acta. 2006;1758:487–492. doi: 10.1016/j.bbamem.2006.02.033. [DOI] [PubMed] [Google Scholar]
- 33.Mou J., Yang J., Shao Z. Alcohol induces interdigitated domains in unilamellar phosphatidylcholine bilayers. Biochemistry. 1994;33:9981–9985. doi: 10.1021/bi00199a022. [DOI] [PubMed] [Google Scholar]
- 34.Slater J.L., Huang C.H. Interdigitated bilayer membranes. Prog. Lipid Res. 1988;27:325–359. doi: 10.1016/0163-7827(88)90010-0. [DOI] [PubMed] [Google Scholar]
- 35.van der Rest M.E., Kamminga A.H., Konings W.N. The plasma membrane of Saccharomyces cerevisiae: structure, function, and biogenesis. Microbiol. Rev. 1995;59:304–322. doi: 10.1128/mr.59.2.304-322.1995. [DOI] [PMC free article] [PubMed] [Google Scholar]
- 36.Leonenko Z.V., Cramb D.T. Revisiting lipid general anesthetic interactions (I): Thinned domain formation in supported planar bilayers induced by halothane and ethanol. Can. J. Chem. 2004;82:1128–1138. [Google Scholar]
- 37.McClain R.L., Breen J.J. The image-based observation of the LBI-to-LB′ phase transition in solid-supported lipid bilayers. Langmuir. 2001;17:5121–5124. [Google Scholar]
- 38.Shamrakov L.G., Cramb D.T. Induced structural changes of a supported planar bilayer after exposure to halothane: a real-time atomic force microscopy study. Can. J. Chem. 2005;83:1190–1194. [Google Scholar]
- 39.Carnini A., Phillips H.A., Cramb D.T. Revisiting lipid general anesthetic interactions (II): Halothane location and changes in lipid bilayer microenvironment monitored by fluorescence. Can. J. Chem. 2004;82:1139–1149. [Google Scholar]
- 40.Goksu E.I., Longo M.L. Ternary lipid bilayers containing cholesterol in a high curvature silica xerogel environment. Langmuir. 2010;26:8614–8624. doi: 10.1021/la9046885. [DOI] [PubMed] [Google Scholar]
- 41.Blanchette C.D., Lin W.-C., Longo M.L. Galactosylceramide domain microstructure: impact of cholesterol and nucleation/growth conditions. Biophys. J. 2006;90:4466–4478. doi: 10.1529/biophysj.105.072744. [DOI] [PMC free article] [PubMed] [Google Scholar]
- 42.Jensen M.H., Morris E.J., Simonsen A.C. Domain shapes, coarsening, and random patterns in ternary membranes. Langmuir. 2007;23:8135–8141. doi: 10.1021/la700647v. [DOI] [PubMed] [Google Scholar]
- 43.Garvik O., Benediktson P., Wüstner D. The fluorescent cholesterol analog dehydroergosterol induces liquid-ordered domains in model membranes. Chem. Phys. Lipids. 2009;159:114–118. doi: 10.1016/j.chemphyslip.2009.03.002. [DOI] [PubMed] [Google Scholar]
- 44.Veatch S.L., Keller S.L. Separation of liquid phases in giant vesicles of ternary mixtures of phospholipids and cholesterol. Biophys. J. 2003;85:3074–3083. doi: 10.1016/S0006-3495(03)74726-2. [DOI] [PMC free article] [PubMed] [Google Scholar]
- 45.Veatch S.L., Keller S.L. Seeing spots: complex phase behavior in simple membranes. Biochim. Biophys. Acta. 2005;1746:172–185. doi: 10.1016/j.bbamcr.2005.06.010. [DOI] [PubMed] [Google Scholar]
- 46.Baumgart T., Hunt G., Feigenson G.W. Fluorescence probe partitioning between Lo/Ld phases in lipid membranes. Biochim. Biophys. Acta. 2007;1768:2182–2194. doi: 10.1016/j.bbamem.2007.05.012. [DOI] [PMC free article] [PubMed] [Google Scholar]
- 47.Juhasz J., Davis J.H., Sharom F.J. Fluorescent probe partitioning in giant unilamellar vesicles of “lipid raft” mixtures. Biochem. J. 2010;430:415–423. doi: 10.1042/BJ20100516. [DOI] [PubMed] [Google Scholar]
- 48.Veatch S.L., Leung S.S.W., Thewalt J.L. Fluorescent probes alter miscibility phase boundaries in ternary vesicles. J. Phys. Chem. B. 2007;111:502–504. doi: 10.1021/jp067636i. [DOI] [PubMed] [Google Scholar]
- 49.Bouvrais H., Pott T., Méléard P. Impact of membrane-anchored fluorescent probes on the mechanical properties of lipid bilayers. Biochim. Biophys. Acta. 2010;1798:1333–1337. doi: 10.1016/j.bbamem.2010.03.026. [DOI] [PubMed] [Google Scholar]
- 50.Skaug M.J., Longo M.L., Faller R. The impact of Texas red on lipid bilayer properties. J. Phys. Chem. B. 2011;115:8500–8505. doi: 10.1021/jp203738m. [DOI] [PubMed] [Google Scholar]
- 51.Ayuyan A.G., Cohen F.S. Lipid peroxides promote large rafts: effects of excitation of probes in fluorescence microscopy and electrochemical reactions during vesicle formation. Biophys. J. 2006;91:2172–2183. doi: 10.1529/biophysj.106.087387. [DOI] [PMC free article] [PubMed] [Google Scholar]
- 52.Zhao J., Wu J., Feigenson G. Phase studies of model biomembranes: macroscopic coexistence of Lα + Lβ, with light-induced coexistence of Lα + Lo phases. Biochim. Biophys. Acta. 2007;1768:2777–2786. doi: 10.1016/j.bbamem.2007.07.009. [DOI] [PMC free article] [PubMed] [Google Scholar]
- 53.Veatch S.L., Soubias O., Gawrisch K. Critical fluctuations in domain-forming lipid mixtures. Proc. Natl. Acad. Sci. USA. 2007;104:17650–17655. doi: 10.1073/pnas.0703513104. [DOI] [PMC free article] [PubMed] [Google Scholar]
- 54.Davis J.H., Clair J.J., Juhasz J. Phase equilibria in DOPC/DPPC-d62/cholesterol mixtures. Biophys. J. 2009;96:521–539. doi: 10.1016/j.bpj.2008.09.042. [DOI] [PMC free article] [PubMed] [Google Scholar]
- 55.Yuan C., O'Connell R.J., Treistman S.N. Bilayer thickness modulates the conductance of the BK channel in model membranes. Biophys. J. 2004;86:3620–3633. doi: 10.1529/biophysj.103.029678. [DOI] [PMC free article] [PubMed] [Google Scholar]
- 56.Montecucco C., Smith G.A., Bisson R. Bilayer thickness and enzymatic activity in the mitochondrial cytochrome c oxidase and ATPase complex. FEBS Lett. 1982;144:145–148. doi: 10.1016/0014-5793(82)80588-7. [DOI] [PubMed] [Google Scholar]
- 57.Johannsson A., Keightley C.A., Metcalfe J.C. The effect of bilayer thickness and n-alkanes on the activity of the (Ca2+ + Mg2+)-dependent ATPase of sarcoplasmic reticulum. J. Biol. Chem. 1981;256:1643–1650. [PubMed] [Google Scholar]
- 58.Dumas F., Tocanne J.F., Lebrun M.C. Consequences of hydrophobic mismatch between lipids and melibiose permease on melibiose transport. Biochemistry. 2000;39:4846–4854. doi: 10.1021/bi992634s. [DOI] [PubMed] [Google Scholar]
- 59.Cornelius F. Modulation of Na,K-ATPase and Na-ATPase activity by phospholipids and cholesterol. I. Steady-state kinetics. Biochemistry. 2001;40:8842–8851. doi: 10.1021/bi010541g. [DOI] [PubMed] [Google Scholar]
- 60.Killian J.A. Hydrophobic mismatch between proteins and lipids in membranes. Biochim. Biophys. Acta. 1998;1376:401–415. doi: 10.1016/s0304-4157(98)00017-3. [DOI] [PubMed] [Google Scholar]
- 61.Marsh D. Energetics of hydrophobic matching in lipid-protein interactions. Biophys. J. 2008;94:3996–4013. doi: 10.1529/biophysj.107.121475. [DOI] [PMC free article] [PubMed] [Google Scholar]
- 62.Perozo E., Kloda A., Martinac B. Physical principles underlying the transduction of bilayer deformation forces during mechanosensitive channel gating. Nat. Struct. Biol. 2002;9:696–703. doi: 10.1038/nsb827. [DOI] [PubMed] [Google Scholar]
- 63.Mannazzu I., Angelozzi D., Bardi L. Behaviour of Saccharomyces cerevisiae wine strains during adaptation to unfavourable conditions of fermentation on synthetic medium: cell lipid composition, membrane integrity, viability and fermentative activity. Int. J. Food Microbiol. 2008;121:84–91. doi: 10.1016/j.ijfoodmicro.2007.11.003. [DOI] [PubMed] [Google Scholar]
- 64.Zara G., Bardi L., Budroni M. Correlation between cell lipid content, gene expression and fermentative behaviour of two Saccharomyces cerevisiae wine strains. J. Appl. Microbiol. 2008;104:906–914. doi: 10.1111/j.1365-2672.2007.03608.x. [DOI] [PubMed] [Google Scholar]
- 65.Guan X.L., Wenk M.R. Mass spectrometry-based profiling of phospholipids and sphingolipids in extracts from Saccharomyces cerevisiae. Yeast. 2006;23:465–477. doi: 10.1002/yea.1362. [DOI] [PubMed] [Google Scholar]
- 66.Henderson C.M., Lozada-Contreras M., Block D.E. Analysis of major phospholipid species and ergosterol in fermenting industrial yeast strains using atmospheric pressure ionization ion-trap mass spectrometry. J. Agric. Food Chem. 2011 doi: 10.1021/jf203203h. In press. [DOI] [PubMed] [Google Scholar]
- 67.Arneborg N., Høy C.E., Jørgensen O.B. The effect of ethanol and specific growth rate on the lipid content and composition of Saccharomyces cerevisiae grown anaerobically in a chemostat. Yeast. 1995;11:953–959. doi: 10.1002/yea.320111006. [DOI] [PubMed] [Google Scholar]
- 68.Castillo Agudo L. Lipid content of Saccharomyces cerevisiae strains with different degrees of ethanol tolerance. Appl. Microbiol. Biotechnol. 1992;37:647–651. [Google Scholar]
- 69.Aguilera F., Peinado R.A., Mauricio J.C. Relationship between ethanol tolerance, H+-ATPase activity and the lipid composition of the plasma membrane in different wine yeast strains. Int. J. Food Microbiol. 2006;110:34–42. doi: 10.1016/j.ijfoodmicro.2006.02.002. [DOI] [PubMed] [Google Scholar]