

Abstract
The early Drosophila embryo is patterned by graded distributions of maternal transcription factors. Recent studies revealed that pattern formation by these graded signals depends on uniformly expressed transcriptional activators, such as Zelda. Removal of Zelda influences both the timing and the spatial expression domains for most of the genes controlled by maternal gradients. We demonstrate that some of these patterning defects, which range from temporal delay to loss of expression, can be rationalized with the use of a mathematical model based on cooperative binding of graded and uniform factors. This model makes a number of predictions, which we confirm experimentally by analyzing the expression of short gastrulation (sog), a gene that is controlled by a combination of the Dorsal morphogen gradient and Zelda. The proposed model suggests a general mechanism for the formation of nested gene expression domains, which is a hallmark of tissue patterning by morphogen gradients. According to this mechanism, the differential effects of a morphogen on its target genes can depend on their differential sensitivity to uniform factors.
Introduction
Early stages of Drosophila development rely on graded distributions of transcription factors in the precellular embryo. The anterior-to-posterior gradient of Bicoid (Bcd), a transcriptional activator, specifies the anterior body segments (1). The ventral-to-dorsal nuclear localization gradient of Dorsal (Dl), which can both activate and repress gene expression, organizes the spatial arrangement of the mesoderm, neural ectoderm, and dorsal ectoderm tissues (2). Graded distribution of a transcriptional repressor Capicua (Cic), with minima at both anterior and posterior poles, patterns the nonsegmented terminal regions of the embryo (3,4). Established by three independent maternal systems, the Bcd, Dl, and Cic gradients provide inputs to the cis-regulatory modules of genes involved in multiple aspects of early embryogenesis.
Gene regulation by Bcd, Dl, and Cic depends on interactions between the morphogens themselves and between morphogens and their transcriptional targets. For instance, the anterior expression of tailless (tll) depends on its direct activation by Bcd and derepression by Cic (5). Combinatorial effects of this type are also present in transcriptional cascades, when a gene is regulated by a morphogen both directly and through a more proximal target (6). For example, genes involved in patterning the presumptive ectoderm region, such as short gastrulation (sog), are controlled by the Dl gradient both directly and through snail (sna), which is induced by Dl.
Recent studies revealed that the effects of maternal morphogens are dramatically affected by uniformly expressed transcriptional activators, such as Zelda (Zld) (7) and Stat92E (8). In particular, removal of Zld affects most of the canonical targets of the Bcd, Dl, and Cic gradients (9). Patterning defects induced by loss of Zld range from delayed expression and alteration of gene expression domains to significant loss of expression. The main purpose of this work is to present a model that can be used as a first step in the quantitative analysis of these effects.
Materials and Methods
Fly strains
OreR flies were used as the wild-type (WT) strain for all experiments, and zld− embryos were obtained from germ-line clones derived from females of genotype zld294 FRT19A/ovoD as previously described (8).
Immunostaining and fluorescence in situ hybridization
Mouse anti-Dl (1:100 monoclonal antibody from Developmental Studies Hybridoma Bank), and rat anti-Zld (1:200) (7,9) were used as the primary antibodies. DAPI (4′,6-diamidino-2-phenylindole, 1:10,000; Vector Laboratories) was used to stain the nuclei, and Alexa Fluor conjugates (1:500; Invitrogen) were used as secondary antibodies. To visualize the sog transcript, fluorescence in situ hybridization (FISH) was used as described previously (10). Embryos were hybridized with digoxigenin (DIG)-labeled antisense probe to sog introns overnight at 60°C. Sheep anti-DIG (1:125; Roche) was used as the primary antibody, and Alexa Fluors (1:500) were used as secondary antibodies.
Microscopy and quantification
Imaging was performed with a Zeiss LSM 510 confocal microscope with a Zeiss 40×numerical aperture 1.2 C-Apo water-immersion objective. High-resolution images (512 × 512 pixels, 12 bit depth) were obtained. All images were collected at the focal plane ∼70 μm from either the anterior or posterior pole. Embryos were imaged in 90% glycerol solution. The mean profile and the corresponding 99% confidence intervals for sog expression were estimated as described previously (10). The statistical significance of a decrease in Zld with time was obtained by linear regression of the Zld level with the mid-point of time for the corresponding nuclear cycle.
Results and Discussion
Equilibrium binding model
Zld binds to the cis-regulatory modules of essentially all known transcriptional targets of maternal morphogens (9). Furthermore, Zld-binding sites are often found close to the binding sites of spatially distributed regulators, such as Bcd and Dl. On the basis of these observations, we hypothesize that the patterning effects of Zld can be explained by cooperative interactions between Zld and a morphogen, such as Bcd or Dl. To illustrate this point, we analyze the activity of a hypothetical regulatory region of a gene controlled by two transcription factors, A and B. The concentrations of these factors are denoted by and . Let us think of as the concentration of a morphogen, such as Dl, and as the concentration of a uniform activator, such as Zld. The regulatory region can be found in four different states: one state with both sites empty, two states with a single site occupied, and one state with both sites bound by their corresponding transcription factors (Fig. 1 A).
Figure 1.
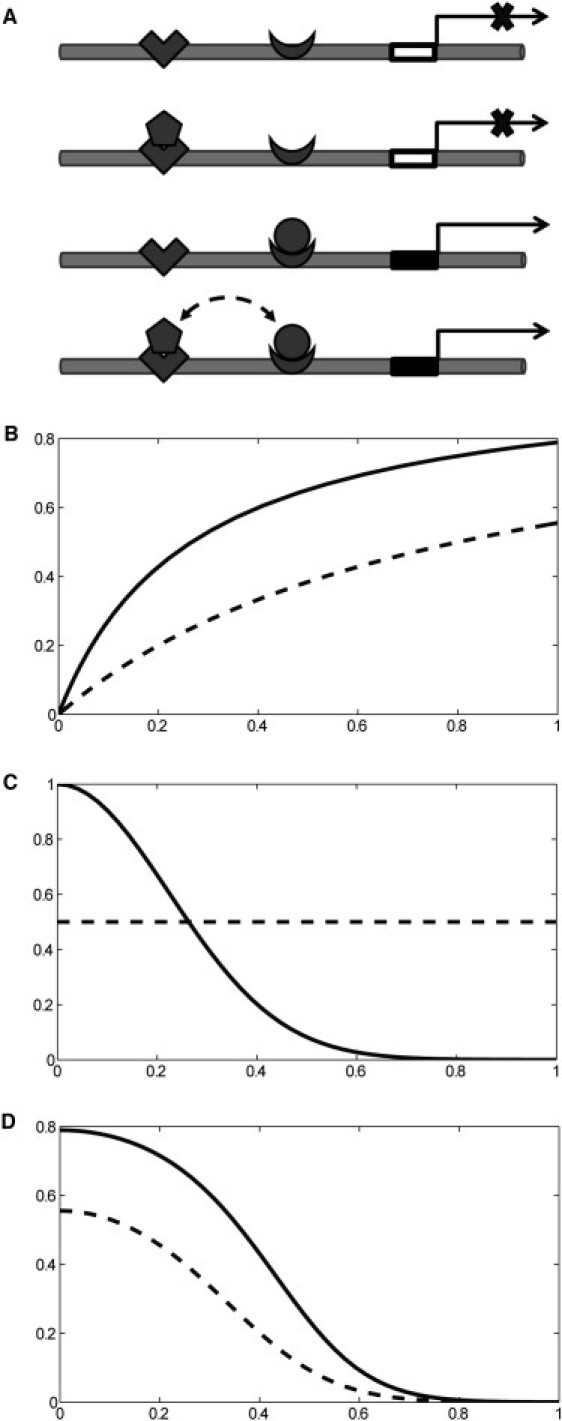
Site occupancy model for gene regulation by the graded factor, A (circle), and the uniform factor, B (pentagon). (B) Activity of the regulatory region as a function of the level of the graded factor in the presence and absence of the uniform factor (solid and dashed lines, respectively). (C) Spatial distributions of the concentrations of graded and uniform factors, CA and CB, respectively; x denotes the distance from the point that corresponds to the maximum of CA. (D) Spatial pattern of the activity of the regulatory region in the presence and absence of the uniform factor (solid and dashed lines, respectively).
For most of the genes, removal of Zld delays or diminishes expression, whereas removal of graded activators, such as Bcd and Dl, leads to a complete loss of expression (7,9). Based on this, we assume that binding of a morphogen is necessary for transcriptional activation, and that the uniform factor increases the morphogen binding or activity. Thus, within the framework of our model, transcription is supported by two states: one in which A is bound on its own, and one in which it is bound together with B (Fig. 1 A).
When the binding reactions are in equilibrium, the probability of finding the regulatory region in either one of these states is given by the following formula (11,12):
KA and KB are the corresponding equilibrium binding constants, which characterize the binding affinities of A and B to their respective sites, when taken in isolation. ω is a measure of cooperativity, which reflects the ability of factor B to change the binding affinity of A to its site. Note that expression for can be written as:
where
Thus, the effect of a uniform factor amounts to changing the equilibrium binding constant of the graded factor. Clearly, when , , and the probability of expression reduces to . This corresponds to the case of no cooperativity. On the other hand, when , and the equilibrium binding constant is lower than . In this case, factor B can be viewed as a coactivator that facilitates binding of factor A. In this case, the output of the regulatory region at any given level of is reduced by removal of the uniform factor or its binding site . Either one of these perturbations reduces throughout the patterned tissue (Fig. 1, B–D).
Experimental tests of the model
As a first step toward testing this model, we analyzed the expression of sog, a gene that is controlled by both Zld, which is uniform, and nuclear Dl, which is graded (Fig. 2 A). The graded distribution of nuclear Dl establishes the expression patterns of multiple genes involved in subdividing the embryo into three germ layers: mesoderm, neural ectoderm, and dorsal ectoderm (Fig. 2 B) (2,6). The future mesoderm is marked by ventrally expressed genes, such as sna. The future neuroectoderm is specified by genes expressed in two symmetric lateral stripes, such as the pattern of sog. Finally, the dorsal ectoderm is defined by dorsally expressed genes, such as decapentaplegic (dpp). Of importance, most of the genes expressed in these three domains are affected by removal of Zld and have Zld-binding sites in their regulatory regions (9,13).
Figure 2.
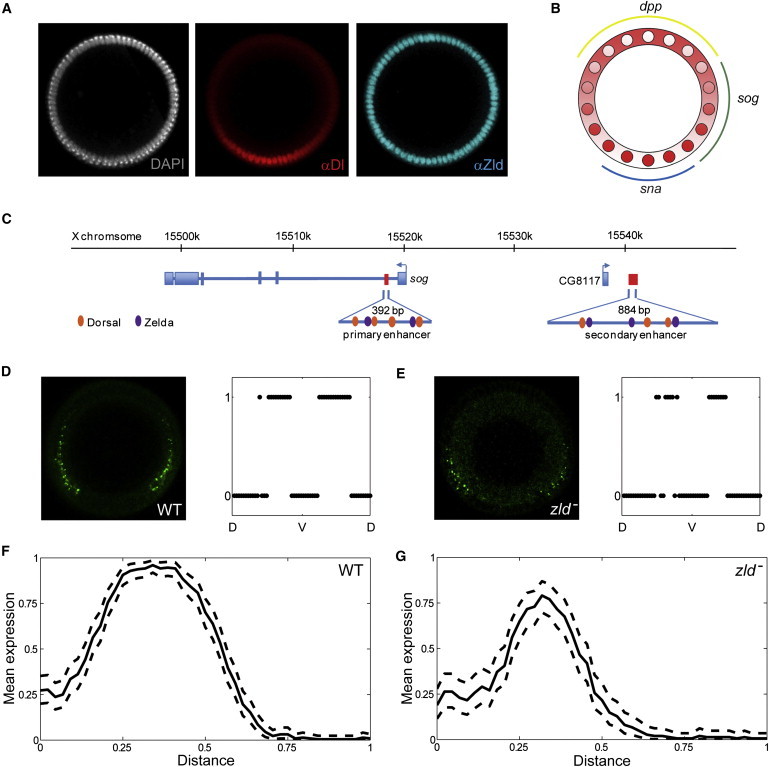
Regulation of sog by Dl and Zld. (A) DV patterning system, showing a spatially uniform arrangement of nuclei (white), graded distribution of nuclear Dl (red), and spatially uniform distribution of Zld (cyan) in the syncytial blastoderm stage of Drosophila embryogenesis. (B) The Dl gradient subdivides the embryo into three domains that give rise to the future muscle, nerve, and skin tissues. These domains are marked by the expression of sna (blue), sog (green), and dpp (yellow). (C) Schematic representation of the sog region. Exons (blue rectangles), introns (blue lines), and enhancers (red rectangles) are shown. Cognate binding sites for Dl and Zld are depicted as ovals in orange and purple, respectively. Note that the secondary shadow enhancer lies downstream of the neighboring gene, CG8117 (35). (D) sog intronic expression in cross-sectional view (left) and the corresponding expression profile along the DV axis (right) for a representative WT embryo during nuclear cycle 14. (E) sog intronic expression in cross-sectional view (left) and the corresponding expression profile along DV axis (right) for a representative zld− embryo during nuclear cycle 14. (F) WT expression profile of sog in nuclear cycle 14. The solid curve represents the mean profile; dashed curves show the 99% confidence intervals of the mean. Along the horizontal axis, x denotes the normalized distance along the DV axis, and 0/1 correspond to the ventralmost/dorsalmost positions, respectively. (G) sog expression in zld− embryos during nuclear cycle 14. Throughout the neuroectoderm region, the sog expression level is significantly lower than that in WT.
The lateral expression stripes of sog are controlled by two enhancers, both of which contain multiple interspersed binding sites for Dl and Zld (Fig. 2 C). This is a common feature of many genes that are controlled by the graded distribution of nuclear Dl (9,13–15). The ventral border of the sog pattern is sharp and determined by the repressive effect of Sna (2), which is itself a target of Dl and Zld. The dorsal border, on the other hand, is graded and is believed to reflect limiting levels of Dl. In testing our model, we focused on the dorsal part of the sog pattern.
In the absence of Zld, the broad lateral pattern of sog is reduced to a much narrower domain, within which <40% of cells exhibit detectable transcripts (8). Previous studies of this effect were based on lateral views of the sog expression domain in a handful of embryos (7,9). To explore the effect of Zld quantitatively and throughout the DV axis, we analyzed sog expression in a large number of embryos, using a microfluidic device that enables large-scale imaging of embryos in cross-sectional views (16).
We used in situ hybridization assays with probes directed against intronic sog sequences (Fig. 2, D and E). Intronic transcripts are more unstable than the corresponding cytoplasmic mRNA. As a consequence, in situ hybridization with intronic probes provides information about transcription in a much shorter time interval than that assessed by hybridization with probes against the coding region (10). Thus, the expression of introns is a proxy for the rate of transcription and can be used to test our model of gene regulation by graded and uniform signals.
We quantified the sog pattern in WT and zld− backgrounds using our previously developed image processing algorithm, which identifies intronic staining in the nuclei of embryos costained with the sog probe and Dl antibodies (10). The maximum of the nuclear Dl gradient defines the ventralmost position along the DV axis. The main output of image processing is a vector with binary components (1/0), which correspond to the presence (1) or absence (0) of sog intronic signal at different positions along the DV axis (Fig. 2, D and E, right panels). By combining such vectors from multiple embryos, we estimated the probability of sog expression along the DV axis (Fig. 2, F and G).
Consistent with the model, we found that the probability of sog expression in the zld− background is significantly lower than the probability of sog expression in WT embryos throughout the entire neuroectoderm region. A lower probability of sog expression implies that the pattern of sog would be more narrow and patchy than that in WT, which is consistent with and explains previous observations (9). An additional test of our model is provided by an analysis of sog expression at different time points. Levels of nuclear Dl increase during the last five nuclear division cycles in the syncytial blastoderm (17,18). In our model, removal of Zld leaves Dl as the only regulator of sog in the presumptive neuroectoderm region. If the increase in the levels of nuclear Dl is functionally significant, it should lead to an increase of the probability of sog expression in the absence of Zld. By comparing the spatial patterns of the probability of sog expression in zld− in two consecutive nuclear cycles, we found that this is indeed the case (Fig. 3 A).
Figure 3.
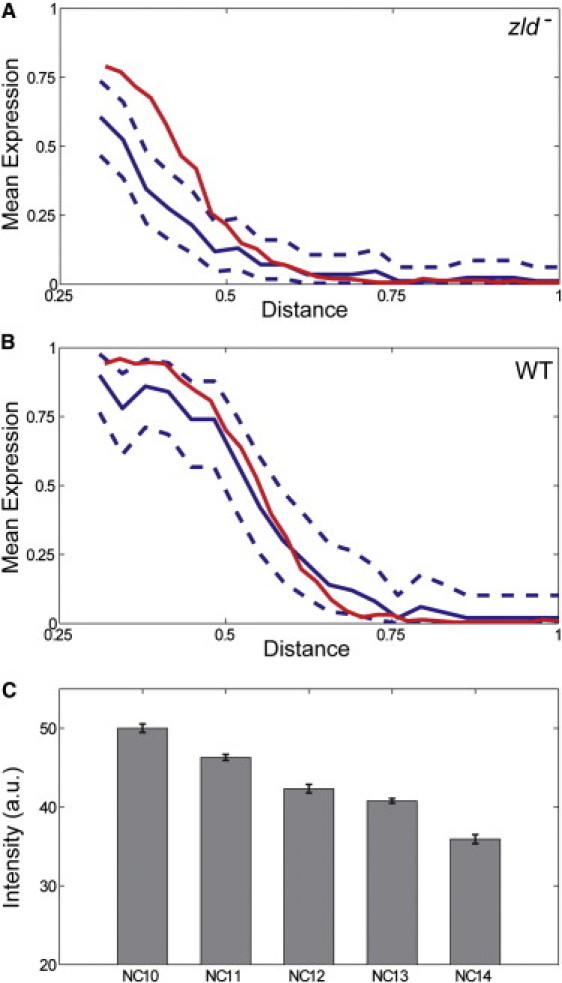
Dynamics of sog expression. (A) Quantitative comparison of the mean intensities of the sog FISH signal in zld− embryos during nuclear cycles 13 (solid blue) to the mean signal in cycle 14 (solid red). Dashed blue curves correspond to the 99% confidence interval for mean expression level in cycle 13. For clarity, sog expression in the presumptive mesoderm (0 < x < 0.25) has been omitted. (B) Quantitative comparison of the mean intensities of the sog FISH signal in the nuclear cycles 13 (solid blue) and 14 (solid red) of WT embryos. Dashed curves correspond to the 99% confidence interval for mean sog expression profile in nuclear cycle 13. The mean values are not significantly different throughout the neuroectoderm region. (C) Dynamics of the nuclear levels of Zld over five nuclear cycles. The levels of Zld decrease as a function of developmental time (p < 0.001).
On the other hand, there was essentially no change in sog expression in the WT background (Fig. 3 B). Within the framework of our model, this stability can be explained only if an increase in the level of nuclear Dl is accompanied by a decrease in the level of Zld. In agreement with this scenario, we found that the levels of Zld show a statistically significant decrease over several consecutive nuclear division cycles (Fig. 3 C). Based on this, we conclude that sog expression reflects a combination of increasing levels of Dl and decreasing level of Zld. Finally, we note that sog introns are first detectable during nuclear cycle 11 in WT embryos (9). On the other hand, they do not appear until nuclear cycle 13 in zld− embryos (9). This delay can be explained by the fact that the low level of Dl at nuclear cycle 11 requires Zld to activate sog gene transcription. In the absence of Zld, the lower level of Dl at nuclear cycle 11 is not sufficient, and sog is activated only at later times when the levels of Dl are higher.
Conclusion
The presented model provides a straightforward explanation for the effects of Zld on the spatiotemporal pattern of sog expression. Admittedly, this model is a simplification of sog regulation, which depends on two different enhancers, each of which has multiple Dl- and Zld-binding sites. At the same time, this model explains the decrease in the rate of sog transcription, the time delay in the initiation of sog expression, and the sporadic nature of sog expression in the absence of Zld. How Zld influences binding of Dl and other morphogens to their cognate DNA sequences is currently unknown. Cooperative effects in transcription are not restricted to direct protein-protein contacts, as in the canonical regulated recruitment models (19), and may be more complex (e.g., they can be mediated by displacement of nucleosomes (20)).
A similar model can be used to explore the effects of Zld on pattern formation by other graded signals, such as Bcd, which patterns the AP axis of the embryo. Furthermore, Zld can affect pattern formation by secondary graded signals that are induced by maternal gradients. For example, a graded pattern of Dpp signaling is established by an elaborate transcriptional and signaling cascade downstream of the Dl gradient (21–25). Of interest, a number of Dpp target genes have Zld-binding sites in their regulatory regions, and the expression domains of these genes potentially can be interpreted with the use of a model similar to the one presented in this study (9). Likewise, a number of transcriptional targets of sna, which is itself induced by Dl, have Zld-binding sites (9). Thus, our model can be used to understand both direct and indirect effects of maternal morphogen gradients.
The proposed model provides a mechanism for the formation of nested gene expression domains, which is a hallmark of tissue patterning by morphogen gradients (26). This feature has been attributed to a differential enhancer response to a graded factor (27–33), or to the combinatorial effects of graded signals (5,34). In our model, enhancers with the exact same binding strengths for the graded factor but different binding sites for the uniform factor can be differentially activated by a morphogen (Fig. 4). According to this model, removal of a uniform factor can make a number of different gene expression borders collapse to the same location, an effect that indeed has been observed in response to removal of Zld (9). On the basis of these findings, we propose that differential sensitivity to uniformly expressed factors can contribute to the formation of nested gene expression domains in the Drosophila embryo and other systems patterned by morphogens.
Figure 4.

Proposed model for the formation of nested gene expression patterns. (A) The activity of a gene regulatory region controlled by graded and uniform factors (A and B, respectively) can be affected by the binding strength of the uniform factor (KB) and/or the cooperativity parameters (ω). The three curves can be viewed as response functions of three hypothetical target genes. All three curves were calculated for the same value of KA, the binding strength of the uniform factor. (B) Changes in the values of KB and ω give rise to the corresponding changes of expression domains. In the absence of a uniform factor, all three genes will be expressed in the same domain. All three curves were calculated for the same value of KA.
Acknowledgments
We thank Christine Bonini for expert help with the experiments, and Alistair Boettiger for helpful discussions.
This work was supported by the National Science Foundation (award 1136913, EFRI-MIKS: Multiscale Analysis of Morphogen Gradients) and the National Institutes of Health (award GM63024 to C.A.R.).
Contributor Information
Christine A. Rushlow, Email: chris.rushlow@nyu.edu.
Stanislav Y. Shvartsman, Email: stas@princeton.edu.
References
- 1.Porcher A., Dostatni N. The bicoid morphogen system. Curr. Biol. 2010;20:R249–R254. doi: 10.1016/j.cub.2010.01.026. [DOI] [PubMed] [Google Scholar]
- 2.Hong J.W., Hendrix D.A., Levine M.S. How the Dorsal gradient works: insights from postgenome technologies. Proc. Natl. Acad. Sci. USA. 2008;105:20072–20076. doi: 10.1073/pnas.0806476105. [DOI] [PMC free article] [PubMed] [Google Scholar]
- 3.Ajuria L., Nieva C., Jiménez G. Capicua DNA-binding sites are general response elements for RTK signaling in Drosophila. Development. 2011;138:915–924. doi: 10.1242/dev.057729. [DOI] [PMC free article] [PubMed] [Google Scholar]
- 4.Jiménez G., Guichet A., Casanova J. Relief of gene repression by torso RTK signaling: role of capicua in Drosophila terminal and dorsoventral patterning. Genes Dev. 2000;14:224–231. [PMC free article] [PubMed] [Google Scholar]
- 5.Löhr U., Chung H.-R., Jäckle H. Antagonistic action of Bicoid and the repressor Capicua determines the spatial limits of Drosophila head gene expression domains. Proc. Natl. Acad. Sci. USA. 2009;106:21695–21700. doi: 10.1073/pnas.0910225106. [DOI] [PMC free article] [PubMed] [Google Scholar]
- 6.Chopra V.S., Levine M. Combinatorial patterning mechanisms in the Drosophila embryo. Brief. Funct. Genomics Proteomics. 2009;8:243–249. doi: 10.1093/bfgp/elp026. [DOI] [PubMed] [Google Scholar]
- 7.Liang H.L., Nien C.Y., Rushlow C. The zinc-finger protein Zelda is a key activator of the early zygotic genome in Drosophila. Nature. 2008;456:400–403. doi: 10.1038/nature07388. [DOI] [PMC free article] [PubMed] [Google Scholar]
- 8.Tsurumi A., Xia F., Li W.X. STAT is an essential activator of the zygotic genome in the early Drosophila embryo. PLoS Genet. 2011;7:e1002086. doi: 10.1371/journal.pgen.1002086. [DOI] [PMC free article] [PubMed] [Google Scholar]
- 9.Nien C.Y., Liang H.L., Rushlow C. Temporal coordination of gene networks by Zelda in the early Drosophila embryo. PLoS Genet. 2011;7:e1002339. doi: 10.1371/journal.pgen.1002339. [DOI] [PMC free article] [PubMed] [Google Scholar]
- 10.Kanodia J.S., Kim Y., Shvartsman S.Y. A computational statistics approach for estimating the spatial range of morphogen gradients. Development. 2011;138:4867–4874. doi: 10.1242/dev.071571. [DOI] [PMC free article] [PubMed] [Google Scholar]
- 11.Bintu L., Buchler N.E., Phillips R. Transcriptional regulation by the numbers: applications. Curr. Opin. Genet. Dev. 2005;15:125–135. doi: 10.1016/j.gde.2005.02.006. [DOI] [PMC free article] [PubMed] [Google Scholar]
- 12.Bintu L., Buchler N.E., Phillips R. Transcriptional regulation by the numbers: models. Curr. Opin. Genet. Dev. 2005;15:116–124. doi: 10.1016/j.gde.2005.02.007. [DOI] [PMC free article] [PubMed] [Google Scholar]
- 13.Harrison M.M., Li X.Y., Eisen M.B. Zelda binding in the early Drosophila melanogaster embryo marks regions subsequently activated at the maternal-to-zygotic transition. PLoS Genet. 2011;7:e1002266. doi: 10.1371/journal.pgen.1002266. [DOI] [PMC free article] [PubMed] [Google Scholar]
- 14.Markstein M., Zinzen R., Levine M. A regulatory code for neurogenic gene expression in the Drosophila embryo. Development. 2004;131:2387–2394. doi: 10.1242/dev.01124. [DOI] [PubMed] [Google Scholar]
- 15.Liberman L.M., Stathopoulos A. Design flexibility in cis-regulatory control of gene expression: synthetic and comparative evidence. Dev. Biol. 2009;327:578–589. doi: 10.1016/j.ydbio.2008.12.020. [DOI] [PMC free article] [PubMed] [Google Scholar]
- 16.Chung K., Kim Y., Lu H. A microfluidic array for large-scale ordering and orientation of embryos. Nat. Methods. 2011;8:171–176. doi: 10.1038/nmeth.1548. [DOI] [PMC free article] [PubMed] [Google Scholar]
- 17.Kanodia J.S., Rikhy R., Shvartsman S.Y. Dynamics of the Dorsal morphogen gradient. Proc. Natl. Acad. Sci. USA. 2009;106:21707–21712. doi: 10.1073/pnas.0912395106. [DOI] [PMC free article] [PubMed] [Google Scholar]
- 18.Liberman L.M., Reeves G.T., Stathopoulos A. Quantitative imaging of the Dorsal nuclear gradient reveals limitations to threshold-dependent patterning in Drosophila. Proc. Natl. Acad. Sci. USA. 2009;106:22317–22322. doi: 10.1073/pnas.0906227106. [DOI] [PMC free article] [PubMed] [Google Scholar]
- 19.Ptashne M., Gann A. Spring Harbor Laboratory Press; Cold Spring Harbor, NY: 2001. Genes & Signals. [Google Scholar]
- 20.Mirny L.A. Nucleosome-mediated cooperativity between transcription factors. Proc. Natl. Acad. Sci. USA. 2010;107:22534–22539. doi: 10.1073/pnas.0913805107. [DOI] [PMC free article] [PubMed] [Google Scholar]
- 21.Lin M.C., Park J., Rushlow C. Threshold response of C15 to the Dpp gradient in Drosophila is established by the cumulative effect of Smad and Zen activators and negative cues. Development. 2006;133:4805–4813. doi: 10.1242/dev.02689. [DOI] [PubMed] [Google Scholar]
- 22.Xu M., Kirov N., Rushlow C. Peak levels of BMP in the Drosophila embryo control target genes by a feed-forward mechanism. Development. 2005;132:1637–1647. doi: 10.1242/dev.01722. [DOI] [PubMed] [Google Scholar]
- 23.Mizutani C.M., Meyer N., Bier E. Threshold-dependent BMP-mediated repression: a model for a conserved mechanism that patterns the neuroectoderm. PLoS Biol. 2006;4:e313. doi: 10.1371/journal.pbio.0040313. [DOI] [PMC free article] [PubMed] [Google Scholar]
- 24.Mizutani C.M., Nie Q., Lander A.D. Formation of the BMP activity gradient in the Drosophila embryo. Dev. Cell. 2005;8:915–924. doi: 10.1016/j.devcel.2005.04.009. [DOI] [PMC free article] [PubMed] [Google Scholar]
- 25.O'Connor M.B., Umulis D., Blair S.S. Shaping BMP morphogen gradients in the Drosophila embryo and pupal wing. Development. 2006;133:183–193. doi: 10.1242/dev.02214. [DOI] [PMC free article] [PubMed] [Google Scholar]
- 26.Ashe H.L., Briscoe J. The interpretation of morphogen gradients. Development. 2006;133:385–394. doi: 10.1242/dev.02238. [DOI] [PubMed] [Google Scholar]
- 27.Struhl G., Struhl K., Macdonald P.M. The gradient morphogen bicoid is a concentration-dependent transcriptional activator. Cell. 1989;57:1259–1273. doi: 10.1016/0092-8674(89)90062-7. [DOI] [PubMed] [Google Scholar]
- 28.Driever W., Nüsslein-Volhard C. The bicoid protein determines position in the Drosophila embryo in a concentration-dependent manner. Cell. 1988;54:95–104. doi: 10.1016/0092-8674(88)90183-3. [DOI] [PubMed] [Google Scholar]
- 29.Driever W., Thoma G., Nüsslein-Volhard C. Determination of spatial domains of zygotic gene expression in the Drosophila embryo by the affinity of binding sites for the bicoid morphogen. Nature. 1989;340:363–367. doi: 10.1038/340363a0. [DOI] [PubMed] [Google Scholar]
- 30.Jiang J., Kosman D., Levine M. The dorsal morphogen gradient regulates the mesoderm determinant twist in early Drosophila embryos. Genes Dev. 1991;5:1881–1891. doi: 10.1101/gad.5.10.1881. [DOI] [PubMed] [Google Scholar]
- 31.Jiang J., Levine M. Binding affinities and cooperative interactions with bHLH activators delimit threshold responses to the dorsal gradient morphogen. Cell. 1993;72:741–752. doi: 10.1016/0092-8674(93)90402-c. [DOI] [PubMed] [Google Scholar]
- 32.Papatsenko D., Levine M. Quantitative analysis of binding motifs mediating diverse spatial readouts of the Dorsal gradient in the Drosophila embryo. Proc. Natl. Acad. Sci. USA. 2005;102:4966–4971. doi: 10.1073/pnas.0409414102. [DOI] [PMC free article] [PubMed] [Google Scholar]
- 33.Ochoa-Espinosa A., Yucel G., Small S. The role of binding site cluster strength in Bicoid-dependent patterning in Drosophila. Proc. Natl. Acad. Sci. USA. 2005;102:4960–4965. doi: 10.1073/pnas.0500373102. [DOI] [PMC free article] [PubMed] [Google Scholar]
- 34.Zinzen R.P., Senger K., Papatsenko D. Computational models for neurogenic gene expression in the Drosophila embryo. Curr. Biol. 2006;16:1358–1365. doi: 10.1016/j.cub.2006.05.044. [DOI] [PubMed] [Google Scholar]
- 35.Zeitlinger J., Zinzen R.P., Levine M. Whole-genome ChIP-chip analysis of Dorsal, Twist, and Snail suggests integration of diverse patterning processes in the Drosophila embryo. Genes Dev. 2007;21:385–390. doi: 10.1101/gad.1509607. [DOI] [PMC free article] [PubMed] [Google Scholar]