

Abstract
There is now considerable evidence of the importance of mechanical cues in neuronal development and regeneration. Motivated by the difference in the mechanical properties of the tissue environment between the peripheral (PNS) and central (CNS) nervous systems, we compare substrate-stiffness-dependent outgrowth and traction forces from PNS (dorsal root ganglion (DRG)) and CNS (hippocampal) neurons. We show that neurites from DRG neurons display maximal outgrowth on substrates with a Young's modulus of ∼1000 Pa, whereas hippocampal neurite outgrowth is independent of substrate stiffness. Using traction force microscopy, we also find a substantial difference in growth cone traction force generation, with DRG growth cones exerting severalfold larger forces compared with hippocampal growth cones. The traction forces generated by DRG and hippocampal growth cones both increase with increasing stiffness, and DRG growth cones growing on substrates with a Young's modulus of 1000 Pa strengthen considerably after 18–30 h. Finally, we find that retrograde actin flow is almost three times faster in hippocampal growth cones than in DRG. Moreover, the density of paxillin puncta is significantly lower in hippocampal growth cones, suggesting that stronger substrate coupling of the DRG cytoskeleton is responsible for the remarkable difference in traction force generation. These findings reveal a differential adaptation of cytoskeletal dynamics to substrate stiffness in growth cones of different neuronal types, and highlight the potential importance of the mechanical properties of the cellular environment for neuronal navigation during embryonic development and nerve regeneration.
Introduction
Knowledge about the mechanisms that control axonal outgrowth, guidance, and maturation is essential for understanding the development of the nervous system, and enabling the systematic design of interventions to promote recovery after nerve injury. It is well established that the growth a highly motile sensory structure at the tip of an axon, samples and integrates information about the local biochemical environment, and modulates outgrowth and guidance (1–5). However, the growth cone also experiences environments with different mechanical properties established by the cytoarchitecture of the nervous system and adjacent tissues (6). Furthermore, mechanical forces play an important role in axonal elongation and maturation, and neuronal growth cones actively generate forces (reviewed in Suter and Miller (7)). The implications of external mechanical cues and internal mechanical force generation for axonal development and regeneration are not well understood.
Many properties of cells are altered in response to the mechanics of their environment (8,9). Stem cell differentiation can be induced solely through substrate stiffness, with soft substrates facilitating neuronal differentiation (10). Neurons are unusual among mechanosensitive cells in that, in general, they seem to prefer soft to stiff substrates (6,9). In central nervous system (CNS) neuronal cultures, neurite outgrowth and branching are increased on soft substrates, whereas glial cell growth is suppressed (11–13). This is often attributed to the fact that CNS tissue, which has a significant number of glial cells, is one of the softest tissues in the body (9,14,15). However, PNS neurons navigate through a very different and diverse mechanical environment dominated by different tissue cells and extracellular matrices (ECMs) (6,9), suggesting that their biomechanics may differ from those of CNS neurons.
Cells sense the substrate stiffness by exerting traction forces, and consequently the range of stiffnesses to which a cell can respond is determined by its ability to generate and modulate mechanical force (9). Neuronal growth cones exert traction forces that lead to tension in the neurite (15–17) and have been attributed to contractile forces associated with the filopodia (18–20). Mechanical tension can specify axonal fate in hippocampal neurons (21) and is actively regulated in axons of Drosophila neurons in vivo (22). However, the distribution and spatiotemporal dynamics of the traction stresses in neuronal growth cones, and their role in tension generation, have not been identified. In addition, the specific relationship among neurite outgrowth, growth cone traction force generation, and mechanosensitive response is not well understood, and possible differences in mechanosensitivity between different neuronal populations have not been explored.
Motivated by these observations, we investigated neurite outgrowth, traction force generation, and cytoskeletal substrate coupling on soft elastic substrates for dorsal root ganglion (DRG) neurons (as representative PNS neurons) and hippocampal neurons (CNS neurons) to understand how the mechanics of the microenvironment affect growth cone motility and neurite outgrowth in different neuronal populations. We find that the biomechanics of DRG neurons are dramatically different from those of hippocampal neurons. DRG neurons display relatively large, steady traction forces and maximal outgrowth and force generation on substrates of intermediate stiffness, whereas hippocampal neurons display weak, intermittent traction forces and a limited dependence of outgrowth and forces on substrate stiffness. DRG growth cones show significantly slower rates of retrograde actin flow and a higher density of paxillin puncta compared with hippocampal neurons, suggesting that the difference in force generation is due to stronger adhesions and therefore stronger substrate coupling in DRG growth cones. The largest traction forces are observed in DRG growth cones that have been growing on substrates of intermediate stiffness for >18 h, indicating that DRG neurons may adapt to substrates of optimal stiffness.
Materials and Methods
Cell culture
DRGs were removed from the lumbar region of P0-P1 rat pups, trimmed, washed in Dulbecco's modified Eagle's medium (DMEM), and enzymatically digested for 20 min in 3 ml 0.25% trypsin/10 μg/ml DNase/Ca2+ and Mg2+-free Hanks balanced salt solution (HBSS). Explants were then dissociated by trituration with a fire-polished Pasteur pipette. The reaction was stopped by addition of an equal volume of fetal bovine serum (FBS), followed by addition of DMEM to a final volume of 15 ml. Cells were then pelleted, resuspended in 5 ml DMEM, and passed through a 100 μm cell strainer. The cell strainer was rinsed twice with 5 ml DMEM and the cell solution was pooled, pelleted, washed twice in DMEM, and finally resuspended in Neurobasal media (Life Technologies, Grand Island, NY). Hippocampi were removed from E18 rats, washed three times in HBSS, and then enzymatically digested in 0.1% trypsin HBSS for 15 min. FBS was added to stop the digest, followed by three washes with HBSS and resuspension in 5 ml HBSS. The hippocampi were dissociated by trituration with a 5 ml serological pipette, followed by further trituration with flame-polished Pasteur pipettes. For culture, hippocampal neurons were maintained in Neurobasal medium with 2% B27, 5% horse serum, 100 units/ml penicillin, 100 mg/ml streptomycin, 0.25 μg/ml Fungizone, and 10 mM HEPES. DRGs were cultured in the same medium with the addition of 2 nM nerve growth factor. All cell culture materials were obtained from Gibco (Grand Island, NY). Cells were plated at relatively low densities of 1×10⁴ cells/dish for DRG and 5×10⁴ cells/dish for hippocampal neurons, and incubated at 37°C and 5% CO2 atmosphere. Glia cell numbers were kept very low by careful trimming during the dissection process and low plating density. In addition, single neurons/growth cones were selected for observations to avoid interference from glia cells or other neurons. Cell viability on the microscope stage was ensured by means of a live cell chamber equipped with an objective heater (Tokai Hit, Shizuoka-Ken, Japan) that controlled temperature and pH.
Immunocytochemistry and transfection
Cells were washed with 37°C PBS, fixed with 4% PFA PBS for 10 min, permeabilized in 0.1% Triton X-100 PBS for 5 min, and then washed with PBS four times for 15 min. The cells were stained with Alexa Fluor488 phalloidin (Invitrogen, Carlsbad, CA) at 2 units in 300 μl per 20 mm well for 1 h, followed by three washes of PBS for 15 min. Anti-paxillin antibody (clone 349; BD Biosciences, San Diego, CA) was used at 1:50 in PBS for 2 h, followed by four washes of PBS for 15 min each. Goat anti-mouse Alexa Fluor568 secondary antibody (Invitrogen) was used at 1:1000 in PBS for 1 h, followed by four washes for 15 min with PBS. To visualize the actin dynamics, neurons were transformed with the CellLight Actin-GFP BacMam 2.0 system (Invitrogen) according to the supplier's instructions.
Polyacrylamide hydrogel substrates
Polyacrylamide (PAA) hydrogels were prepared according to published procedures (23,24) with some modifications. Briefly, 20 mm glass-bottomed dishes (MatTek, Ashland, MA) were wiped with 0.1 N NaOH and silanized with 3-aminopropyl-trimethoxysilane (Sigma-Aldrich, St. Louis, MO). The dishes were washed extensively and the glass surface was treated for 30 min with 0.5% glutaraldehyde followed by a final wash. Then 18-mm coverglasses were coated with Sigmacote (Sigma-Aldrich) to make nonadhesive top coverslips. Acrylamide and bis-acrylamide (Bio-Rad Laboratories, Richmond, CA) were mixed in PBS solution to a final volume of 1 ml at appropriate concentrations to achieve the desired gel stiffness (see Table S1 in the Supporting Material). For traction force measurements, FluoSphere bead solution (0.2 μm, 660 nm; Invitrogen) was added at 5% volume. The final solution was degassed for 15 min and put on ice for 5 min. Polymerization was initiated by addition of 10 μl freshly prepared ammonium persulfate (10% w/v solution; Sigma-Aldrich) and 3 μl of N,N,N,N-tetramethylethylenediamine (TEMED; AcrosOrganics, Morris Plains, NJ). Immediately after initiation, 5 μl PAA solution was pipetted onto the MatTek dish coverglass and the nonadhesive top coverslip was quickly placed onto the gel droplet and gently pressed down. The dish was inverted to facilitate settling of fluorescent beads at the upper gel surface. After 30 min the gel was immersed in water for 10 min, and then the top coverslips were gently removed under water. The gels were allowed to swell in dH2O for 1–2 h before the surface coating treatment. The gels were coated with 2 μg/cm2 (5 μl of 1 mg/ml CellTak (BD Biosciences) in 200 μl dH2O) in a 20 min incubation at room temperature followed by 2 μg/cm2 (5 μl of 1 mg/ml laminin in 200 μl PBS) laminin incubation for 2 h at 37°C. Before seeding with cells, the gels were incubated in cell culture media for a minimum of 2 h at 37°C. Previous studies showed no significant difference in laminin adsorption onto gels of different stiffness (12,13). Stiffness was characterized during polymerization by rheology measurements performed on a stress-controlled bulk rheometer (Anton Paar KG, Graz, Austria) with 1 Hz oscillatory shear at 1% strain for 30 min. The Young's modulus used in the traction stress calculation was determined from the measured storage modulus G′ as E = 2G′(1+ν) using a Poisson ratio ν of 0.45 (25).
Neurite tracing and image analysis
Images for assessment of neurite length and analysis of the actin dynamics were taken on a Leica TCS SP5 confocal laser scanning microscope. For neurite length assessment, at least 20 cells for each gel condition and experiment were imaged with a 20× water immersion objective as three-dimensional (3D) stacks. Neurites were traced using the Filament Tracer package of Imaris (Bitplane AG, Zurich, Switzerland). The total neurite length is calculated as the sum of all neurite lengths. Because the neurite length varied from trial to trial, we analyzed the data by a two-way analysis of variance (ANOVA, stiffness versus trial) using Sigmaplot 11 (Systat Software, Chicago, IL), followed by post-hoc comparisons using Duncan's method. For display in Fig. 1 B the neurite lengths in each trial were normalized to average neurite length at 1000 Pa and combined. Actin dynamics were imaged at 1–5 s time resolution for typically 5–10 min with a 63× water immersion objective. We created kymographs along three lines for each growth cone and performed three flow measurements for each kymograph using a custom MATLAB routine (The MathWorks, Natick, MA). Paxillin and phalloidin staining was imaged with a 60× water immersion objective on a TE2000-U inverted microscope (Nikon Instruments, Melville, NY) equipped with a Yokogawa (CSU10; Solomere Technology, Salt Lake City, UT) spinning disk confocal head and an electron-multiplying CCD camera (Andor Technologies, Belfast, Northern Ireland) as a 3D image stack. We quantified the paxillin density ratio between the growth cone and neurite using a custom MATLAB routine.
Figure 1.
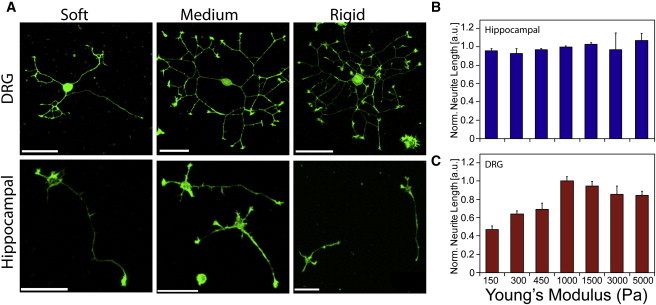
(A) DRG and hippocampal neurons grown on soft (300 Pa), intermediate (1000 Pa), and rigid (5000 Pa) substrates, fixed and stained for actin filaments at 8 h (DRG) or 24 h (hippocampal). (B and C) Neurite outgrowth of hippocampal (B) and DRG (C) neurons on laminin-coated PAA substrates of different stiffness. Total neurite length is normalized to the mean value at 1000 Pa to allow for comparison between independent experiments. Values represent the mean of at least three independent experiments. Error bars indicate the SE.
Traction force microscopy
PAA hydrogels were prepared as described above. Fluorescence images of beads and bright-field transmission images of cells were recorded as 3D stack time series for 1–2 h with 1–5 min time resolution on a Leica TCS SP5, confocal laser scanning microscope (Leica, Deerfield, IL) equipped with a 63× water immersion objective at z steps of 0.3–0.5 μm. Image slices were median-filtered to reduce noise, followed by a maximum projection of the 3D stack. The resulting 2D images were drift-corrected by detecting the shift of each image with respect to the first image. The shift was calculated in each corner region (1/5 × 1/5 of the image) from the peak of the cross correlation, and the median of the four values was used for the drift correction. The reference image was calculated from the median of the intensity time course at each pixel. Bead displacements between images and the reference image were detected on a 0.75 μm 2D grid using cross correlation. The corresponding deformation field was obtained by 2D Gaussian interpolation. We calculated the traction stress field from the deformation field by implementing a Fourier transform-based algorithm using the Boussinesq Green's function as presented by Sabass and colleagues (25). Peak stress is defined as the maximum stress in an image. The average stress over the entire growth cone in an image is calculated as the mean of the stress in a region exceeding a threshold value of 30% of a preset maximum value on the order of the peak stress. The overall maximum and mean of the peak and average stresses are calculated for each time series taking into account only time points that show stresses above the threshold value. The net force is calculated as the vector sum of all stresses within the same region used to calculate the average stress. The stress noise level is defined as the median of the maximum stress in each corner region of an image. In all cases, the noise level is significantly lower than the peak stress values: the lowest values of the signal/noise ratio are 3.85 ± 1.13 Pa (± SD) for DRGs (3–10 h) on 1675 Pa and 3.12 ± 1.04 Pa (± SD) for DRGs (20–30 h) on 1675 Pa substrates, and 1.90 ± 0.48 Pa (± SD) for hippocampal growth cones on 615 Pa substrates. The position of the growth cone is determined by manually estimating the center of the growth cone stress field in each image. The distance traveled is measured from the growth cone position in the initial image, and the speed is the absolute difference between successive positions divided by the time between images. All analyses were performed with the use of a custom MATLAB routine. Force and stiffness data were analyzed using a one-way ANOVA using Sigmaplot 11 (Systat Software), followed by post-hoc comparisons using the Holm-Sidak method.
Results
Neurite outgrowth dependence on substrate rigidity
To elucidate the effect of substrate mechanical properties on neurite outgrowth, we measured neurite lengths of DRG and hippocampal neurons growing on soft elastic substrates over a physiologically relevant stiffness range (6,9). Cells were plated on polyacrylamide hydrogels coated with laminin to support adhesion and outgrowth, and ranging in stiffness from a Young's modulus of 150–5000 Pa. Cells were fixed at 8 h (DRG) and 24 h (hippocampal) after plating. These times were chosen to be long enough to ensure substantial outgrowth but also short enough to prevent neurites from forming a network. Neurite length was measured after the actin filaments were visualized using Alexa Fluor488 phalloidin. The typical morphology and neurite outgrowth of DRG and hippocampal neurons are shown in Fig. 1 A. DRG neurons show robust outgrowth on substrates of ∼≥1000 Pa, but on softer substrates the neurites are noticeably shorter. By contrast, hippocampal cultures on substrates of different stiffnesses are visually very similar. Quantification of outgrowth confirms this observation: the length of hippocampal neurites is independent of substrate stiffness (Fig. 1 B). In contrast, DRG neurite length is significantly affected by substrate stiffness (p < 0.001, two-way ANOVA). DRG outgrowth is maximal at an intermediate stiffness of ∼1000 Pa. The least growth is observed on soft gels of ∼150–450 Pa, and the growth on gels of 150–450 Pa and 5000 Pa is significantly different from that on gels of 1000 Pa (Duncan's multiple range test; Fig. 1 C). Thus, DRG neurite extension appears to be optimized for intermediate substrate stiffness and is reduced on soft or stiff substrates. In addition, we investigated the role of branching in the substrate-dependent outgrowth. We find that the branching frequency (number of branch points per length) is approximately constant over the measured stiffness range, with only a slight increase on softer substrates for both hippocampal and DRG neurons (see Fig. S1). To investigate how the stiffness dependence of the DRG neurite outgrowth evolves, we examined the outgrowth versus time within the first 24 h after plating on soft, intermediate, and stiff substrates using time-lapse microscopy (see Movie S1). We find a linear increase in total neurite length on intermediate and stiff substrates, but more complicated behavior with pausing or retraction on soft gels, indicating that less-persistent outgrowth for neurons on soft gels leads to the observed reduction in neurite length (Fig. 1 C and Fig. S2).
Traction force generation
To compare traction forces between PNS and CNS neurons, and to assess the effect of substrate stiffness on the generation of traction forces, we plated DRG and hippocampal neurons onto laminin-coated, elastically deformable polyacrylamide hydrogels with fluorescent tracer beads embedded at the surface. We measured the traction stresses generated by the motile growth cones using standard traction force microscopy techniques (24,26,27). We examined the traction force generation of DRG neurons within the first 3–10 h and at 20–30 h after plating. These time points were chosen to capture growth cones on properly formed extending neurites during the initial outgrowth and at a more mature stage. Hippocampal neurons were observed at 18–30 h after plating (to ensure sufficient outgrowth) and selected for stage 3 morphology characterized by a single prominent, long neurite (13,28). Images were taken every 1–5 min over a time period of 1–2 h. Solitary, actively forward-moving growth cones were selected for analysis, excluding growth cones that exhibited retraction, bifurcation, or fasciculation. Fig. 2, A and B, and the corresponding Movie S2 and Movie S3, show representative traction stress fields generated by DRG and hippocampal growth cones, respectively. DRG stress fields typically span the entire growth cone, whereas the highest traction stresses are located around the peripheral region and often coincide with filopodial position. DRG peak traction stresses vary considerably with time, whereas the average stress over the entire growth cone stress field shows remarkably little variation (Fig. 2 C, Fig. S3, Fig. S4, and Movie S2), suggesting that the level of traction generation activity in the growth cone is tightly regulated. In contrast, hippocampal growth cones are highly dynamic, displaying short periods of high stress and long phases of low stress in which they do not generate traction stresses larger than the measurement noise. Both peak and average stresses show similar variability and appear to be highly correlated (Fig. 2 D, Fig. S5, and Movie S3). DRG growth cones typically show steady forward movement, with some variation in peak stress and net force exerted by the growth cone (Fig. 2 E, Fig. S3, and Fig. S4). Hippocampal growth cone movement is characterized by intermittent growth phases, with no obvious correlation between outgrowth and either peak stress or net force (Fig. 2 F and Fig. S5).
Figure 2.
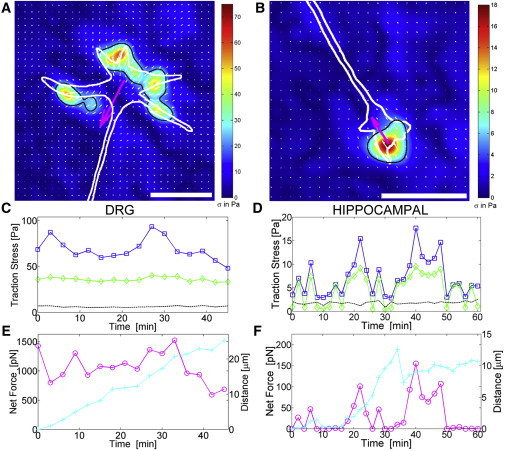
Traction stress fields for (A) DRG growth cones on 1000 Pa at 6 h, and (B) hippocampal growth cones on 300 Pa at 22 h. Arrows (white) give the direction and magnitude of traction stress. The white outline indicates the growth cone shape, and the black outline indicates the region used for mean stress field and net force calculation. The heat map represents the magnitude of traction stress σ in Pa (pN/μm2). The large arrow (magenta) shows the direction of the net traction force. Scale bars are 10 μm. (C and D) Time course of peak (□) and average (⋄) traction stress and noise level (dashed black) for the DRG and hippocampal growth cones shown in A and B, and Movie S2 and Movie S3. (E and F) Corresponding time course of net traction force (○) and distance moved from the initial position (+).
Substrate stiffness-dependence of traction force generation
The ability to detect and adapt to substrate stiffness is likely to be beneficial when a cell attempts to navigate mechanically diverse environments. Accordingly, models for substrate coupling and mechanosensitivity mechanisms predict that substrate rigidity modulates lamellipodium dynamics and traction forces (9,13,20,29,30). We find that traction force generation significantly depends on substrate stiffness for DRG and hippocampal neurons on substrates with Young's moduli between 200 and 1700 Pa (p < 0.001, one-way ANOVA). As shown in Fig. 3 A, average traction stress from DRG growth cones 3–10 h after plating increases from 23.2 ± 0.8 Pa, n = 16, ± standard error (SE)) on 500 Pa substrates to 39.0 ± 1.4 Pa (n = 33, ±SE) on 1100 Pa substrates (p <0.001), followed by a decline to 30.9 ± 1.3 Pa (n = 8, ±SE) at 1675 Pa (p < 0.001). By contrast, growth cones from more mature neurons, 20–30 h after plating, are overall stronger and show a larger increase in traction stress with stiffness from 26.1 ± 1.1 Pa (n = 13, ±SE) at 500 Pa up to a peak of 44.3 ± 2.3 Pa (n = 24, ±SE) at 1000 Pa (p < 0.001), followed by a decline back to 28.6 ± 2.0 Pa (n = 8, ±SE) at 1675 Pa (p < 0.001). For substrate stiffness > 1700 Pa, the deformations are too small to be accurately measured. Because of their weak traction forces, hippocampal growth cones produce measurable deformations only on softer gels. However, hippocampal neurons also show increasing traction force generation with increasing substrate stiffness (Fig. 3 A). The average stress from hippocampal growth cones increases from 5.2 ± 0.3 Pa (n = 20, ±SE) at 200 Pa to 9.2 ± 0.5 Pa (n = 18, ±SE) at 430 Pa (p < 0.001). The maximum peak stresses measured for DRG and hippocampal growth cones follow the same trend as the average stresses (Fig. S6). Fig. 3, B and C, show a direct comparison of the maximum and mean peak stresses and the corresponding net forces generated by DRG and hippocampal growth cones. These results show that, by all measures, DRG growth cones generate significantly higher traction stresses compared with hippocampal growth cones. Of interest, we see an increase in the net force, indicating a rise in neurite tension at 20–30 h that corresponds to an overall increase in traction forces after 1 day (Fig. 3 C and Fig. S6). At this stage, DRG neurons typically have formed an interconnected network that undergoes substantial rearrangement and appears to generate significant internal tension (Movie S1).
Figure 3.
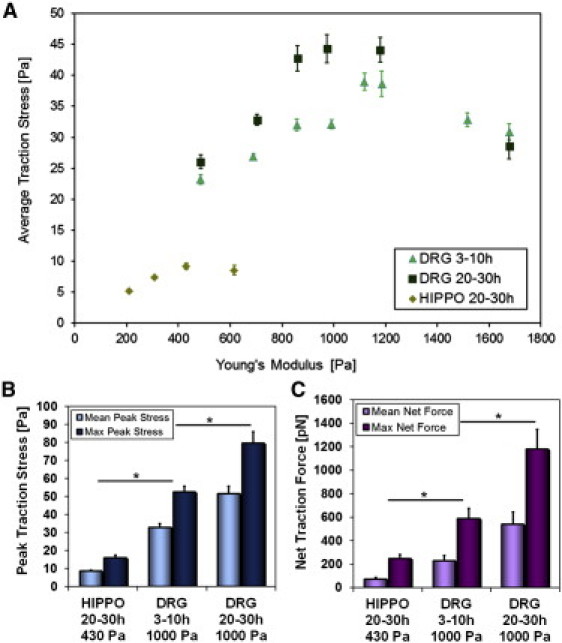
(A) Maximum average traction stress for DRG at 3–10 h (▴) and 20–30 h (■) and for hippocampal growth cones at 20–30 h (♦) as a function of substrate stiffness. (B) DRG growth cones generate maximum (dark blue) and mean (light blue) peak traction stresses of σpeak,Max = 53.0 ± 3.3 Pa and <σpeak>t = 31.2 ± 2.0 Pa (n = 27, 3–10 h) and σpeak,Max = 79.6 ± 6.4 Pa and <σpeak>t = 51.6 ± 4.1 Pa (n = 24, 20–30 h) on 1000 Pa. Hippocampal growth cones generate σpeak,Max = 15.9 ± 1.5 Pa and <σpeak>t = 8.6 ± 0.6 Pa (n = 18, 20–30 h) on 430 Pa. (C) Corresponding maximum (dark purple) and mean (light purple) net traction forces for DRG (FNet,Max = 678 ± 99 pN, <FNet>t = 284 ± 58 pN, 3–10 h; FNet,Max = 1179 ± 169 pN, <FNet>t = 537 ± 107 pN, 20–30 h) and hippocampal (FNet,Max = 247 ± 34 pN, <FNet>t = 71 ± 15 pN, 20–30 h) growth cones. All values in A–C are given as the mean ± SE (n ≥ 15, except DRG 1675 Pa at 3–10 h and DRG 500, 860, 1675 Pa at 20–30 h: n ≥ 8, hippocampal 615 Pa, n = 6). Significance indicates p < 0.01 (Student's t-test).
Cytoskeletal dynamics and substrate coupling
Growth cone signaling pathways modulate the cytoskeletal dynamics that ultimately determine morphological changes and growth cone movement (31). Growth cone traction stresses arise from coupling between the substrate and the actin cytoskeleton through adhesion complexes, and this coupling can produce an inverse relationship between the rate of retrograde actin flow and the traction stress (20,29,30). Thus, we investigated whether the difference in traction stresses between DRG and hippocampal growth cones is associated with a difference in rates of retrograde actin flow. DRG and hippocampal neurons were transfected with GFP-actin to visualize the dynamics of the actin cytoskeleton and plated on laminin-coated glass substrates. Images were taken every 1–5 s over a period of typically 5–10 min, and retrograde actin flow velocities were quantified via a kymograph analysis. We find that the actin retrograde flow is significantly slower in DRG growth cones than in hippocampal growth cones (Fig. 4 A and Movie S4). The measured actin retrograde flow velocities are vRF = 3.4 ± 0.3 μm/min (n = 14, ±SE) for DRG and vRF = 9.5 ± 0.3 μm/min (n = 19, ±SE) for hippocampal growth cones (p < 0.001, Student's t-test).
Figure 4.
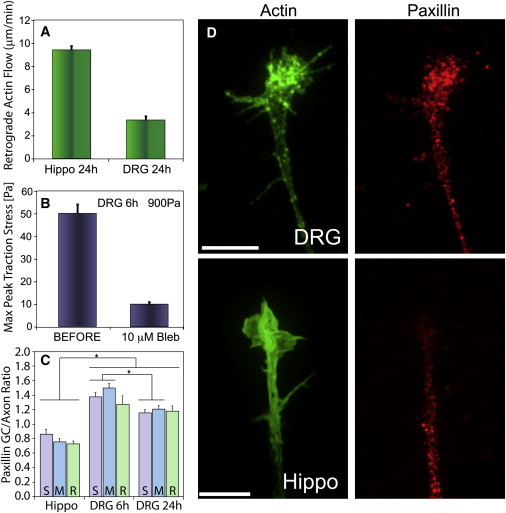
(A) Retrograde actin flow velocities of hippocampal and DRG neuronal growth cones on laminin-coated glass substrates. The mean actin retrograde flow velocity is vRF = 9.5 ± 0.3 μm/min (n = 19) for hippocampal and vRF = 3.4 ± 0.3 μm/min (n = 14) for DRG growth cones. (B) Addition of 10 μM blebbistatin, a nonmuscle myosin II inhibitor, reduces peak traction stress from σpeak,Max = 50.2 ± 3.9 Pa to essentially noise levels at σpeak,Max = 10.1 ± 0.9 Pa (n = 12). (C) Ratio of paxillin mean intensity in growth cone versus neurite for hippocampal (R = 0.86 ± 0.06, 300 Pa, n = 25) and DRG (R = 1.50 ± 0.06 at 6 h, 1000 Pa, n = 24; R = 1.21 ± 0.12 at 24 h, 1000 Pa, n = 20) on soft (S), intermediate (M), and rigid (R) gels. Values in A–C are mean ± SE. Significance indicates p < 0.01 (Student's t-test). (D) Actin and paxillin distribution in DRG and hippocampal growth cones. Focal puncta are concentrated in the growth cone periphery and along filopodia in DRGs. The puncta density is reduced in hippocampal growth cones compared with the neurite. Scale bars are 10 μm.
Nonmuscle myosin II is an actin-binding molecular motor that has been implicated in mechanosensing and traction force generation in many motile cells (9). Its activity is required for successful growth cone navigation (18), and it is a main driving force in retrograde flow generation (32). We investigated the role of myosin II in traction force generation in neuronal growth cones by using blebbistatin, a specific inhibitor of nonmuscle myosin II. For DRG growth cones on intermediate stiffness gels, application of 10 μM blebbistatin completely abolishes traction force generation within a few minutes (Fig. 4 B). This is accompanied by a collapse in growth cone lamellipodia and most filopodia, but neurites continue to extend (Movie S5).
To assess possible differences in substrate coupling, we fixed DRG and hippocampal neurons on soft, intermediate, and stiff gels, and stained for actin filaments and paxillin, a protein associated with adhesion complexes (33,34). We quantified the paxillin staining density by assessing the ratio of the mean fluorescence intensity within the growth cone as compared with the neurite. We find that the paxillin density in DRG growth cones is significantly increased relative to that in the neurite, whereas hippocampal growth cones show a substantial reduction relative to their neurites (Fig. 4, C and D, p < 0.01, Student's t-test).
Discussion
During nervous system development and regeneration, neuronal growth cones navigate through tissue with a wide range of mechanical properties that differ depending on the developmental stage and neuronal population. At the earliest stages of development, hippocampal neurons extend on radial glial cells, which are among the softest cells in the body (E∼500 Pa) (6,14). In the PNS, neurons encounter tissues with a wide range of stiffnesses (9). The effects of these different stiffnesses on neurite outgrowth and pathfinding, as well as possible differences among different neuronal populations, are still largely unknown. Our findings indicate that growth cones from DRG (PNS) neurons generate significantly larger forces than do hippocampal (CNS) neurons and display a remarkable degree of mechanosensitivity, with both outgrowth and traction force generation showing a strong dependence on substrate stiffness. Moreover, substrate coupling appears to be differentially modulated in the two populations, with DRG growth cones showing slower retrograde flow rates and higher levels of paxillin staining. Thus, different populations of neurons appear to have developed force-generation and rigidity-response mechanisms tailored to their respective environments.
In several previous studies, researchers investigated the effect of the stiffness of the environment on neurite outgrowth. Mouse spinal cord primary neurons displayed more branches on soft (E ∼150–700 Pa) substrates after a week in culture (11). DRGs were shown to grow longer neurites in soft 3D agarose gels (35) and toward the softer region in a stiffness gradient in 3D fibrillar collagen matrices (36). However, in contrast to our results, the neurons in these studies were cultured either significantly longer (for 7 days up to several weeks) before neurite length assessment with only a few widely separated substrate stiffnesses, or in more-complex 3D structures. By comparing different neuronal populations using identical protocols, we were able to clearly demonstrate significant differences in stiffness-dependent neurite outgrowth between representative CNS and PNS neurons. The range of substrate stiffnesses we investigated is also consistent with the stiffness of brain tissue and, most likely, that of Schwann cells (PNS glial cells). A recent study showed that adult rat cerebellar slices have a low elasticity, with a range of 100–500 Pa, with white matter having lower stiffness than gray matter (15). In contrast to previous findings on hippocampal neurons grown on a much broader stiffness range of gels for 48 h (13), we observe no dependence of hippocampal neurite outgrowth on substrate stiffness within the first 24 h after plating. This apparent difference may be due to changes in the biomechanics of neuronal growth during maturation or differences in the substrate protein coating. Of interest, cortical neuron outgrowth was also shown to be insensitive to substrate stiffness in the same range presented here (37). CNS neurons grow remarkably well on extremely soft substrates. In addition, the lack of measurable stiffness sensitivity for hippocampal neurite outgrowth may indicate that mechanosensitivity is of little utility in the very soft environment of the developing brain. Our results confirm that PNS neurons, unlike most other cell types, do not prefer very stiff substrates (9), but they also reveal a relatively narrow maximum in outgrowth and traction force versus stiffness, suggesting a high degree of mechanosensitivity and substrate preference that may play an important role in the mechanically diverse environment of the PNS. Of note, DRG neurons have been shown to be one of nature's most sensitive detectors of molecular gradients (38). The long distances traversed by PNS neurons, coupled with the high cost of navigational errors, presumably create a strong evolutionary pressure for multiple mechanisms for pathfinding.
In general, to move forward, cells have to exert a force on the substrate to generate traction. However, neuronal growth cones generate significantly lower traction forces than other cell types, such as fibroblasts and keratocytes (9). The observed traction stress magnitudes reported here are consistent with literature values on pulling forces of entire growth cones and the corresponding neurite tension of chick sensory neurons probed with a micropipette assay (17). In addition, they agree with low-resolution substrate deformation measurements of contractile forces of individual filopodia from growth cones of mouse superior cervical ganglion (SCG) neurons based on widely separated tracer beads (18). There are a number of possible reasons why DRG neurons have evolved to be significantly stronger than hippocampal (CNS) neurons. Increased traction forces would be necessary for effective mechanosensing on the diverse range of substrate stiffness encountered in the PNS. In addition, especially in the PNS, DRG neurons may need strong substrate adhesion to withstand external mechanical forces imparted by the surrounding environment. Finally, it has been shown that externally applied tension on the order of 1–2 nN can significantly increase outgrowth speeds and lengths of DRG neurites (39), and the internally generated net forces and corresponding neurite tension that we measure are large enough that DRG growth cones may actively pull on their neurites to enhance the outgrowth speed by mechanical stretching of the neurite. In contrast, hippocampal neurons grow and form an intricate network surrounded by one of the softest tissues found in the body. The observation of forward movement in the absence of traction stresses suggests that force generation and the corresponding neurite tension may not be important as a regulator of growth rate for hippocampal neurites. Considering the role mechanical tension plays in determining the axonal fate in hippocampal neurons (21), it is conceivable that a major role of traction generation in these neurons, especially during initial outgrowth, is to keep a balance of tension in a tug-of-war among the different neurites of a cell. Consistent with this hypothesis, the hippocampal growth cone traction stress field is typically highly localized, uniformly directed toward the axon, and aligned with the net force.
Although much remains unknown about the biophysical mechanisms that are responsible for growth cone traction force generation, the primary pathway appears to be coupling of the ECM to retrograde actin flow through substrate adhesion (9). The retrograde flow velocities we report are in good agreement with literature values for other neuronal cell types (20,32,40,41). The frictional clutch hypothesis predicts an inverse relationship between retrograde actin flow and traction force, with weak adhesions allowing relatively free actin flow (a disengaged clutch) and strong adhesions causing significant reductions in retrograde flow rates (20,29,30). This hypothesis is consistent with our observation that the larger traction forces generated by DRG growth cones compared with hippocampal cones are associated with substantially lower rates of retrograde flow. Of interest, the computational model of Chan and Odde (20) predicts a slight increase in traction stress with substrate stiffness from a soft to an intermediate range, as observed in our data, followed by a significant decrease in traction stress from intermediate to stiff.
In addition, by observing the entire traction stress field at high spatial and temporal resolution, we show that growth cone traction stresses (and, by inference, substrate coupling) are transient and rapidly evolving, quite unlike the strong, stable, and mature focal adhesions in other cell types (9). The observed differences in paxillin distribution suggest the involvement of pathways that regulate focal adhesion complex dynamics. Based on the reported force generation from individual myosin II heads (1.3–5 pN) and predicted loads for individual adhesion units (100–165 pN) comprised of 3–5 integrins (9), we can estimate that relatively few myosin II motors and perhaps only one (hippocampal) or a few (DRG) focal adhesions are needed to provide the observed traction stresses. This is consistent with observations of GFP-paxillin in live Xenopus growth cones showing small numbers of localized spots that typically last for 1–3 min (42). The adaptation to substrates of intermediate stiffness in DRG neurites we observed over the first day in culture could be due to increased expression, redistribution, or posttranslation modification of proteins associated with focal adhesions or modification of actomyosin contractility. These changes may arise from differential regulation of the relevant proteins controlled by mechanosensitive signaling pathways, or as an indirect consequence of the enhanced neurite outgrowth, for example, through a more extensive interconnected network of neurites.
The relationship between traction force and neurite outgrowth is not simple. We found that blebbistatin, an inhibitor of myosin II ATPase activity, eliminated force generation, but neurites continued to advance. This is consistent with previously reports about the role of myosin II in force generation (18) and the rate of cell movement (43), and the reduction in traction stress exerted on the substrate upon inhibition of actomyosin contractility. Myosin II promotes cell adhesion and force generation by controlling the assembly and disassembly of focal adhesions (44), and modulates the interaction of microtubules and retrograde actin flow (45). Blebbistatin would affect both of these processes. Reducing focal adhesions would reduce the attachment of the growth cone to the substrate, but reducing retrograde actin flow would allow unfettered microtubule extension. Similar neurite elongation driven by microtubule assembly has been demonstrated in Neuro 2A cells (46) and chick retina and spinal cord neurons (47). In addition, continued elongation of the axon under inhibitory conditions, such as disruption of the actin network (48) or elimination of microtubules (49), has been repeatedly observed. However, growth cones must actively probe the substrate by exerting a force to successfully detect and navigate by mechanical cues (9). Moreover, axonal guidance is strongly disrupted when myosin II activity is inhibited (50,51), suggesting that traction force is necessary for growth cones to successfully navigate in response to chemical guidance cues as well.
Taken together, our results suggest that the strong and rather constant coupling of internal force generation to the ECM through substrate adhesions in DRGs generates relatively high traction stress and neurite tension, leading to steady growth cone advancement. This combination enables DRG neurons to cover large distances, respond to the stiffness of their environment, and withstand external forces imparted by the surrounding tissue. In contrast, the weak and intermittent substrate coupling in hippocampal growth cones results in fast retrograde actin flow with low and intermittent traction force transmission. The finding that hippocampal growth cone advancement appears to be independent of traction suggests that CNS neurons are less reliant on forces to modulate outgrowth and guidance, although traction forces may play an important role in neurite tension generation and consequently in axonal maturation. These findings highlight the importance and complexity of the interaction between neurons and their mechanical environment. A deeper understanding of the mechanisms underlying these interactions will shed light on pathfinding during development and guide strategies to promote regeneration after injury.
Acknowledgments
We thank Clare Waterman, Daniel Blair, Josef Käs, Kristian Franze, Timo Betz, and the team at Tryst for helpful discussions, and Nancy Geller for statistical advice.
This work was supported by National Institute of Neurological Disorders and Stroke grant 1R01NS064250-01 (J.S.U.) and the National Heart, Lung, and Blood Institute Intramural Research Program (H.M.G.).
Supporting Material
References
- 1.Tessier-Lavigne M., Goodman C.S. The molecular biology of axon guidance. Science. 1996;274:1123–1133. doi: 10.1126/science.274.5290.1123. [DOI] [PubMed] [Google Scholar]
- 2.Chilton J.K. Molecular mechanisms of axon guidance. Dev. Biol. 2006;292:13–24. doi: 10.1016/j.ydbio.2005.12.048. [DOI] [PubMed] [Google Scholar]
- 3.Farrar N.R., Spencer G.E. Pursuing a ‘turning point’ in growth cone research. Dev. Biol. 2008;318:102–111. doi: 10.1016/j.ydbio.2008.03.012. [DOI] [PubMed] [Google Scholar]
- 4.Geraldo S., Gordon-Weeks P.R. Cytoskeletal dynamics in growth-cone steering. J. Cell Sci. 2009;122:3595–3604. doi: 10.1242/jcs.042309. [DOI] [PMC free article] [PubMed] [Google Scholar]
- 5.Lowery L.A., Van Vactor D. The trip of the tip: understanding the growth cone machinery. Nat. Rev. Mol. Cell Biol. 2009;10:332–343. doi: 10.1038/nrm2679. [DOI] [PMC free article] [PubMed] [Google Scholar]
- 6.Franze K., Guck J. The biophysics of neuronal growth. Rep. Prog. Phys. 2010;73:094601. [Google Scholar]
- 7.Suter D.M., Miller K.E. The emerging role of forces in axonal elongation. Prog. Neurobiol. 2011;94:91–101. doi: 10.1016/j.pneurobio.2011.04.002. [DOI] [PMC free article] [PubMed] [Google Scholar]
- 8.Discher D.E., Janmey P., Wang Y.L. Tissue cells feel and respond to the stiffness of their substrate. Science. 2005;310:1139–1143. doi: 10.1126/science.1116995. [DOI] [PubMed] [Google Scholar]
- 9.Moore S.W., Roca-Cusachs P., Sheetz M.P. Stretchy proteins on stretchy substrates: the important elements of integrin-mediated rigidity sensing. Dev. Cell. 2010;19:194–206. doi: 10.1016/j.devcel.2010.07.018. [DOI] [PMC free article] [PubMed] [Google Scholar]
- 10.Engler A.J., Sen S., Discher D.E. Matrix elasticity directs stem cell lineage specification. Cell. 2006;126:677–689. doi: 10.1016/j.cell.2006.06.044. [DOI] [PubMed] [Google Scholar]
- 11.Flanagan L.A., Ju Y.E., Janmey P.A. Neurite branching on deformable substrates. Neuroreport. 2002;13:2411–2415. doi: 10.1097/01.wnr.0000048003.96487.97. [DOI] [PMC free article] [PubMed] [Google Scholar]
- 12.Georges P.C., Miller W.J., Janmey P.A. Matrices with compliance comparable to that of brain tissue select neuronal over glial growth in mixed cortical cultures. Biophys. J. 2006;90:3012–3018. doi: 10.1529/biophysj.105.073114. [DOI] [PMC free article] [PubMed] [Google Scholar]
- 13.Kostic A., Sap J., Sheetz M.P. RPTPα is required for rigidity-dependent inhibition of extension and differentiation of hippocampal neurons. J. Cell Sci. 2007;120:3895–3904. doi: 10.1242/jcs.009852. [DOI] [PubMed] [Google Scholar]
- 14.Lu Y.B., Franze K., Reichenbach A. Viscoelastic properties of individual glial cells and neurons in the CNS. Proc. Natl. Acad. Sci. USA. 2006;103:17759–17764. doi: 10.1073/pnas.0606150103. [DOI] [PMC free article] [PubMed] [Google Scholar]
- 15.Christ A.F., Franze K., Guck J. Mechanical difference between white and gray matter in the rat cerebellum measured by scanning force microscopy. J. Biomech. 2010;43:2986–2992. doi: 10.1016/j.jbiomech.2010.07.002. [DOI] [PubMed] [Google Scholar]
- 16.Bray D. Mechanical tension produced by nerve cells in tissue culture. J. Cell Sci. 1979;37:391–410. doi: 10.1242/jcs.37.1.391. [DOI] [PubMed] [Google Scholar]
- 17.Lamoureux P., Buxbaum R.E., Heidemann S.R. Direct evidence that growth cones pull. Nature. 1989;340:159–162. doi: 10.1038/340159a0. [DOI] [PubMed] [Google Scholar]
- 18.Bridgman P.C., Dave S., Adelstein R.S. Myosin IIB is required for growth cone motility. J. Neurosci. 2001;21:6159–6169. doi: 10.1523/JNEUROSCI.21-16-06159.2001. [DOI] [PMC free article] [PubMed] [Google Scholar]
- 19.Heidemann S.R., Lamoureux P., Buxbaum R.E. Growth cone behavior and production of traction force. J. Cell Biol. 1990;111:1949–1957. doi: 10.1083/jcb.111.5.1949. [DOI] [PMC free article] [PubMed] [Google Scholar]
- 20.Chan C.E., Odde D.J. Traction dynamics of filopodia on compliant substrates. Science. 2008;322:1687–1691. doi: 10.1126/science.1163595. [DOI] [PubMed] [Google Scholar]
- 21.Lamoureux P., Ruthel G., Heidemann S.R. Mechanical tension can specify axonal fate in hippocampal neurons. J. Cell Biol. 2002;159:499–508. doi: 10.1083/jcb.200207174. [DOI] [PMC free article] [PubMed] [Google Scholar]
- 22.Rajagopalan J., Tofangchi A., A Saif M.T. Drosophila neurons actively regulate axonal tension in vivo. Biophys. J. 2010;99:3208–3215. doi: 10.1016/j.bpj.2010.09.029. [DOI] [PMC free article] [PubMed] [Google Scholar]
- 23.Pelham R.J., Jr., Wang Y. Cell locomotion and focal adhesions are regulated by substrate flexibility. Proc. Natl. Acad. Sci. USA. 1997;94:13661–13665. doi: 10.1073/pnas.94.25.13661. [DOI] [PMC free article] [PubMed] [Google Scholar]
- 24.Sabass B., Gardel M.L., Schwarz U.S. High resolution traction force microscopy based on experimental and computational advances. Biophys. J. 2008;94:207–220. doi: 10.1529/biophysj.107.113670. [DOI] [PMC free article] [PubMed] [Google Scholar]
- 25.Frey M.T., Engler A., Wang Y.L. Microscopic methods for measuring the elasticity of gel substrates for cell culture: microspheres, microindenters, and atomic force microscopy. Methods Cell Biol. 2007;83:47–65. doi: 10.1016/S0091-679X(07)83003-2. [DOI] [PubMed] [Google Scholar]
- 26.Dembo M., Wang Y.L. Stresses at the cell-to-substrate interface during locomotion of fibroblasts. Biophys. J. 1999;76:2307–2316. doi: 10.1016/S0006-3495(99)77386-8. [DOI] [PMC free article] [PubMed] [Google Scholar]
- 27.Butler J.P., Tolić-Nørrelykke I.M., Fredberg J.J. Traction fields, moments, and strain energy that cells exert on their surroundings. Am. J. Physiol. Cell Physiol. 2002;282:C595–C605. doi: 10.1152/ajpcell.00270.2001. [DOI] [PubMed] [Google Scholar]
- 28.Dotti C.G., Sullivan C.A., Banker G.A. The establishment of polarity by hippocampal neurons in culture. J. Neurosci. 1988;8:1454–1468. doi: 10.1523/JNEUROSCI.08-04-01454.1988. [DOI] [PMC free article] [PubMed] [Google Scholar]
- 29.Mitchison T., Kirschner M. Cytoskeletal dynamics and nerve growth. Neuron. 1988;1:761–772. doi: 10.1016/0896-6273(88)90124-9. [DOI] [PubMed] [Google Scholar]
- 30.Jay D.G. The clutch hypothesis revisited: ascribing the roles of actin-associated proteins in filopodial protrusion in the nerve growth cone. J. Neurobiol. 2000;44:114–125. doi: 10.1002/1097-4695(200008)44:2<114::aid-neu3>3.0.co;2-8. [DOI] [PubMed] [Google Scholar]
- 31.Dent E.W., Gupton S.L., Gertler F.B. The growth cone cytoskeleton in axon outgrowth and guidance. Cold Spring Harb. Perspect. Biol. 2011;3:3. doi: 10.1101/cshperspect.a001800. [DOI] [PMC free article] [PubMed] [Google Scholar]
- 32.Medeiros N.A., Burnette D.T., Forscher P. Myosin II functions in actin-bundle turnover in neuronal growth cones. Nat. Cell Biol. 2006;8:215–226. doi: 10.1038/ncb1367. [DOI] [PubMed] [Google Scholar]
- 33.Kurklinsky S., Chen J., McNiven M.A. Growth cone morphology and spreading are regulated by a dynamin-cortactin complex at point contacts in hippocampal neurons. J. Neurochem. 2011;117:48–60. doi: 10.1111/j.1471-4159.2011.07169.x. [DOI] [PMC free article] [PubMed] [Google Scholar]
- 34.Renaudin A., Lehmann M., McKerracher L. Organization of point contacts in neuronal growth cones. J. Neurosci. Res. 1999;55:458–471. doi: 10.1002/(SICI)1097-4547(19990215)55:4<458::AID-JNR6>3.0.CO;2-D. [DOI] [PubMed] [Google Scholar]
- 35.Balgude A.P., Yu X., Bellamkonda R.V. Agarose gel stiffness determines rate of DRG neurite extension in 3D cultures. Biomaterials. 2001;22:1077–1084. doi: 10.1016/s0142-9612(00)00350-1. [DOI] [PubMed] [Google Scholar]
- 36.Sundararaghavan H.G., Monteiro G.A., Shreiber D.I. Neurite growth in 3D collagen gels with gradients of mechanical properties. Biotechnol. Bioeng. 2009;102:632–643. doi: 10.1002/bit.22074. [DOI] [PubMed] [Google Scholar]
- 37.Norman L.L., Aranda-Espinoza H. Cortical neuron outgrowth is insensitive to substrate stiffness. Cell. Mol. Bioeng. 2010;3:398–414. [Google Scholar]
- 38.Rosoff W.J., Urbach J.S., Goodhill G.J. A new chemotaxis assay shows the extreme sensitivity of axons to molecular gradients. Nat. Neurosci. 2004;7:678–682. doi: 10.1038/nn1259. [DOI] [PubMed] [Google Scholar]
- 39.O'Toole M., Lamoureux P., Miller K.E. A physical model of axonal elongation: force, viscosity, and adhesions govern the mode of outgrowth. Biophys. J. 2008;94:2610–2620. doi: 10.1529/biophysj.107.117424. [DOI] [PMC free article] [PubMed] [Google Scholar]
- 40.Geraldo S., Khanzada U.K., Gordon-Weeks P.R. Targeting of the F-actin-binding protein drebrin by the microtubule plus-tip protein EB3 is required for neuritogenesis. Nat. Cell Biol. 2008;10:1181–1189. doi: 10.1038/ncb1778. [DOI] [PubMed] [Google Scholar]
- 41.Betz T., Koch D., Käs J.A. Stochastic actin polymerization and steady retrograde flow determine growth cone advancement. Biophys. J. 2009;96:5130–5138. doi: 10.1016/j.bpj.2009.03.045. [DOI] [PMC free article] [PubMed] [Google Scholar]
- 42.Woo S., Gomez T.M. Rac1 and RhoA promote neurite outgrowth through formation and stabilization of growth cone point contacts. J. Neurosci. 2006;26:1418–1428. doi: 10.1523/JNEUROSCI.4209-05.2006. [DOI] [PMC free article] [PubMed] [Google Scholar]
- 43.Pasapera A.M., Schneider I.C., Waterman C.M. Myosin II activity regulates vinculin recruitment to focal adhesions through FAK-mediated paxillin phosphorylation. J. Cell Biol. 2010;188:877–890. doi: 10.1083/jcb.200906012. [DOI] [PMC free article] [PubMed] [Google Scholar]
- 44.Geiger B., Spatz J.P., Bershadsky A.D. Environmental sensing through focal adhesions. Nat. Rev. Mol. Cell Biol. 2009;10:21–33. doi: 10.1038/nrm2593. [DOI] [PubMed] [Google Scholar]
- 45.Schaefer A.W., Schoonderwoert V.T., Forscher P. Coordination of actin filament and microtubule dynamics during neurite outgrowth. Dev. Cell. 2008;15:146–162. doi: 10.1016/j.devcel.2008.05.003. [DOI] [PMC free article] [PubMed] [Google Scholar]
- 46.Spero D.A., Roisen F.J. Neuro-2a neuroblastoma cells form neurites in the presence of taxol and cytochalasin D. Brain Res. 1985;355:155–159. doi: 10.1016/0165-3806(85)90016-1. [DOI] [PubMed] [Google Scholar]
- 47.Rösner H., Möller W., Blum M. Attenuation of actinomyosinII contractile activity in growth cones accelerates filopodia-guided and microtubule-based neurite elongation. Brain Res. 2007;1176:1–10. doi: 10.1016/j.brainres.2007.07.081. [DOI] [PubMed] [Google Scholar]
- 48.Letourneau P.C., Shattuck T.A., Ressler A.H. “Pull” and “push” in neurite elongation: observations on the effects of different concentrations of cytochalasin B and taxol. Cell Motil. Cytoskeleton. 1987;8:193–209. doi: 10.1002/cm.970080302. [DOI] [PubMed] [Google Scholar]
- 49.Lamoureux P., Steel V.L., Heidemann S.R. Extracellular matrix allows PC12 neurite elongation in the absence of microtubules. J. Cell Biol. 1990;110:71–79. doi: 10.1083/jcb.110.1.71. [DOI] [PMC free article] [PubMed] [Google Scholar]
- 50.Brown J.A., Wysolmerski R.B., Bridgman P.C. Dorsal root ganglion neurons react to semaphorin 3A application through a biphasic response that requires multiple myosin II isoforms. Mol. Biol. Cell. 2009;20:1167–1179. doi: 10.1091/mbc.E08-01-0065. [DOI] [PMC free article] [PubMed] [Google Scholar]
- 51.Hur E.M., Yang I.H., Zhou F.Q. Engineering neuronal growth cones to promote axon regeneration over inhibitory molecules. Proc. Natl. Acad. Sci. USA. 2011;108:5057–5062. doi: 10.1073/pnas.1011258108. [DOI] [PMC free article] [PubMed] [Google Scholar]
Associated Data
This section collects any data citations, data availability statements, or supplementary materials included in this article.