

Abstract
EPAC is a cAMP-dependent guanine nucleotide exchange factor that serves as a prototypical molecular switch for the regulation of essential cellular processes. Although EPAC activation by cAMP has been extensively investigated, the mechanism of EPAC autoinhibition is still not fully understood. The steric clash between the side chains of two conserved residues, L273 and F300 in EPAC1, has been previously shown to oppose the inactive-to-active conformational transition in the absence of cAMP. However, it has also been hypothesized that autoinhibition is assisted by entropic losses caused by quenching of dynamics that occurs if the inactive-to-active transition takes place in the absence of cAMP. Here, we test this hypothesis through the comparative NMR analysis of several EPAC1 mutants that target different allosteric sites of the cAMP-binding domain (CBD). Using what to our knowledge is a novel projection analysis of NMR chemical shifts to probe the effect of the mutations on the autoinhibition equilibrium of the CBD, we find that whenever the apo/active state is stabilized relative to the apo/inactive state, dynamics are consistently quenched in a conserved loop (β2-β3) and helix (α5) of the CBD. Overall, our results point to the presence of conserved and nondegenerate determinants of CBD autoinhibition that extends beyond the originally proposed L273/F300 residue pair, suggesting that complete activation necessitates the simultaneous suppression of multiple autoinhibitory mechanisms, which in turn confers added specificity for the cAMP allosteric effector.
Introduction
The exchange protein directly activated by cAMP (EPAC) is a guanine nucleotide exchange factor for the small GTPases, Rap1 and Rap2 (1–5), and is a key regulator of several physiological responses with implications in chronic degenerative inflammatory diseases (6). EPAC consists of an N-terminal regulatory region (RR) and a C-terminal catalytic region (CR). The RR of EPAC1 contains a single cAMP binding domain (CBD), whereas the CR includes a CDC25-homology domain (CDC25-HD), which binds the Rap substrate (Fig. 1 a) (1–5).
Figure 1.
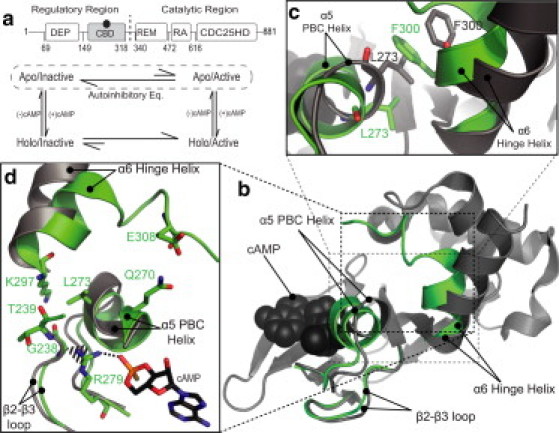
(a) Domain organization of EPAC1 and thermodynamic cycle for the coupled cAMP binding and activation equilibria. The catalytic region consists of the CDC25-homology domain (CDC25-HD), the Ras exchange motif (REM), and the Ras association (RA) domain. The regulatory region contains the disheveled Egl-10 pleckstrin (DEP) domain and the cyclic-nucleotide binding domain (CBD). (Gray) The CBD under study; (black circle) the cAMP molecule. (Vertical black dashed line) Separation between the RR and CR. (Encircling dashed line) Autoinhibitory equilibrium between the apo/inactive and apo/active states. (b) (Gray ribbon diagram) The apo CBD structure, with the regions subject to major cAMP-dependent changes (superimposed in green) with the corresponding labels. (Black spheres) cAMP. (c) Expanded view of the L273/F300 pair in the apo (gray) and holo (green) structures. (d) Contacts mediated by the β2-β3 loop and the PBC. The PBD ID codes for the apo (gray) and holo (green) structures are 2BYV and 3CF6, respectively.
The EPAC CBD is an archetype of other eukaryotic regulatory CBDs, such as those of Protein Kinase A (7–15) and of the hyperpolarization-activated cyclic nucleotide-modulated channels (16). The eukaryotic CBDs share a common architecture with a β-subdomain of jellyroll β-sheets and a noncontiguous α-subdomain. The latter includes an N-terminal helical bundle (NTHB), a C-terminal helix (α6), also known as the hinge helix, as well as a short helix (α5) located between β6 and β7 in the phosphate binding cassette (PBC), where cAMP docks (Fig. 1, b and d) (8,11,12).
The orientation of α6 with respect to the PBC is controlled by cAMP. In the absence of cAMP (i.e., apo-state), the hinge helix is oriented away from the PBC (Fig. 1, b–d), but upon cAMP binding the hinge helix rotates toward the PBC (Fig. 1, b–d). In the case of EPAC, the hinge helix rotation is also coupled to a partial unfolding of the last two turns of the α6 helix (Fig. 1, b–d) (3,17,18). These cAMP-dependent changes in the α-subdomain are critical for the control of autoinhibitory interactions (3,5,7–14,17–20). Autoinhibition pertains to the mechanisms that prevent the premature inactive-to-active transition in the absence of the allosteric effector (i.e., autoinhibitory equilibria, Fig. 1 a) (4,21). The maintenance of an autoinhibited state is essential for eliciting cAMP dependence and preventing constitutive activation, which can otherwise have drastic effects on downstream signaling (4,6,21).
The cAMP-dependent hinge rotation has been previously rationalized by the so-called hydrophobic hinge hypothesis, which posits that a highly conserved contact between L273 in the PBC and F300 in α6 would lead to a steric clash if the hinge reorientation toward the β-subdomain occurred in the absence of cAMP (3–5). Such steric hindrance has been suggested to be a key determinant of autoinhibition and is alleviated by the repositioning of L273 caused by cAMP binding (Fig. 1, b and c). Furthermore, it has been hypothesized that an additional determinant of autoinhibition arises from entropic losses in the PBC α5 and in an adjacent loop (β2-β3) caused by a reduction of dynamics and tighter L273/F300 packing in the apo/active versus apo/inactive states of the CBD (Fig. 1 a) (21). However, this hypothesis has not been tested, as currently no experimental data are available for the apo/active intermediate due to its transient nature.
Here, we test the hypothesis that the PBC α5 and β2-β3 loop dynamics are quenched in the apo/active conformation relative to the apo/inactive state by investigating three single point mutations that stabilize the transient apo/active state by targeting the allosteric hot spots of the EPAC1 CBD (i.e., G238A in the β2-β3 loop, Q270A in the α5 helix, and E308A in the α6 hinge helix; Fig. 1 d). The effect of each mutation on the active/inactive equilibrium of the CBD was evaluated by NMR in the apo state, because the autoinhibited state occurs in the absence of cAMP. Specifically, we used NMR to not only probe at atomic resolution the changes in dynamics caused by the mutation, but also to gauge how the mutation affects the position of the apo/inactive versus apo/active equilibrium.
For this purpose, we propose a method based on 1H and 15N NMR chemical shifts, which are ideally suited to sense changes in the position of the apo/inactive versus apo/active equilibrium of EPAC in the fast exchange regime, minimizing biases due to nearest-neighbor effects of the mutants. This approach relies on the projection analysis (PA) of ppm values and was validated using the L273W mutation, which has been shown to stabilize the apo/inactive state (5). We also complemented the NMR analyses with molecular dynamics (MD) simulations, and our combined NMR and MD results indicate that whenever a mutant causes a stabilization of the apo/active state, a quench in dynamics is consistently observed for the α5 and β2-β3 loop regions. This result is in agreement with the hypothesis that the autoinhibited state is stabilized not only by the steric hindrance between L273 and F300, but also by the α5/β2-β3 entropic losses occurring when the inactive-to-active transition ensues in the absence of cAMP. Overall, the combined analysis of the EPAC1 mutants presented here reveals, to our knowledge, a novel model of EPAC autoinhibition, in which the stabilization of the inactive versus active structures in the absence of cAMP relies on a complex network of interactions that extends well beyond the previously proposed L273/F300 contact.
Materials and Methods
Purification of Wt and mutant EPAC1 constructs
Purification procedures used for both the wild-type (Wt) and mutant EPAC1 (GenBank No. AAC83381.1) constructs were as previously explained (20). Briefly, cells of Escherichia coli strain BL-21 harboring plasmids encoding EPAC1 constructs were grown in isotopically enriched media with 15NH4Cl and 13C-labeled glucose. Cells were lysed as before and protein was purified using the following chromatographic columns (GE Healthcare, Waukesha, WI): Glutathione Sepharose 4B, HighTrap Q HP, and Superdex 75 16/60. Singly labeled 15N-acetylglycine (Sigma Aldrich, St. Louis, MO) (0.5 mM) was added to the final concentrated protein sample (0.5 mM) as a ppm-referencing compound.
NMR measurements
All spectra were acquired at 306 K with an Avance 700-MHz spectrometer (Bruker Daltonics, Billerica, MA) equipped with a 5 mm TCI CryoProbe (Bruker BioSpin, Billerica, MA). Gradient- and sensitivity-enhanced [15N-1H] heteronuclear single quantum coherence (HSQC) spectra with 256 (t1) and 1024 (t2) complex points and spectral widths of 31.82 parts-per-million (ppm) and 14.06 ppm for the 15N and 1H dimensions, respectively, were recorded with eight scans and a recycle delay of 1 s. Carrier frequencies of the proton and nitrogen channels were centered on water and the backbone amide region, respectively. All spectra were processed with NMRPipe (22) employing linear prediction in the 15N dimension, and a resolution-enhancing 60° shifted squared sine bell window function for both dimensions. All 15N-1H HSQC crosspeaks were analyzed with the software SPARKY using Gaussian line-fitting (23). Assignments were obtained using triple-resonance experiments, as previously explained (17,18).
The measured 13Cα, 13Cβ, 13CO, 1H, and 15N chemical shifts were utilized to derive order parameters by employing the RCI algorithm with correct referencing (24) that reports on dynamic processes on a broad range of timescales (25). Indeed, the trends captured by the RCI-based S2 values are in agreement with previously measured 15N relaxation data for the apo-Wt and cAMP-bound Wt states (17). In addition, the RCI-based order parameters have the advantage of being measurable also for the critical PBC region, which, in the apo-state, is subject to significant line-broadening, compromising the signal/noise ratio of traditional 15N relaxation experiments.
MD simulation protocol
All simulations were executed using the EPAC2 fragment composed of amino-acid residues 310–498 (corresponding to 175–363 in EPAC1h). Mouse EPAC2 (GenBank No. AAD09132.1) was used for all MD simulations, as this is the EPAC isoform for which experimental structures have been determined by x-ray crystallography in the absence and presence of the agonist Sp-cAMPS (3,4). It contains the functionally essential CBD, which is highly homologous to the EPAC1h CBD (∼81% sequence similarity and ∼69% sequence identity). Initial structures of the apo/inactive and holo/active states were obtained from x-ray crystal structures with PDB IDs 2BYV and 3CF6, respectively (3,4) by deleting all amino acids other than residues 310–498 (i.e., 175–363 in EPAC1h) and all water molecules from both structures. In addition, the bound Sp-cAMPS molecule was replaced with the endogenous cAMP and an extra surface-bound Sp-cAMPS molecule was deleted from the structure as it was found to be in a crystal packing contact. For clarity, the corresponding EPAC1h amino-acid numbering is used in the remaining part of the article, unless otherwise specified. For further details, see the Supporting Material.
Results
NMR chemical shift variations are sensitive reporters of the position of the inactive versus active fast-exchanging equilibrium of signaling proteins, such as EPAC (see Fig. S1 in the Supporting Material) (20). However, the commonly used compounded ppm changes, computed as √((0.2ΔδN)2+(ΔδH)2) (9,13,14,17–19), report only on the magnitude of the chemical shift variations caused by a mutation (Fig. 2, dashed circles) and not on the direction in which the given mutation affects the autoinhibitory equilibrium. For instance, Fig. 3 a shows the combined ppm changes of apo-L273W versus apo-Wt EPAC1149-318. It indicates that most of the regions subject to the largest ppm shifts caused by the L273W mutation in the apo state match quite well the sites displaying the most significant cAMP-dependent ppm changes for the Wt protein (Fig. 3 a, gray zones) (17,18,20). However, cAMP is an activator and the L273W mutant is inactive (5). Thus the compounded ppm changes provide an effective quantification of the size of the ppm changes, but they are not sufficient to establish whether a mutation shifts the apo equilibrium toward the inactive or the active state. To quantify both the size and the direction of the perturbation caused by a mutation on the autoinhibitory equilibrium, we introduce the projection analysis of NMR chemical shifts (Fig. 2). We will first illustrate the projection analysis method and then validate and apply it to the EPAC system.
Figure 2.
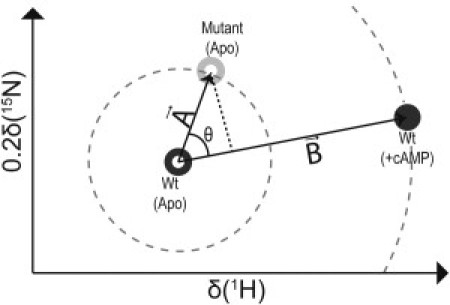
Schematic illustration of the projection analysis of NMR chemical shifts. (Open and solid circles) Apo and holo forms respectively, as labeled in the figure. (Dark- and light-shaded) Wt and mutant peaks, respectively. The compounded chemical shift between the apo-mutant and the apo-Wt was calculated as the magnitude of vector A (i.e., |A|). Similarly the compounded chemical shift between the cAMP-bound Wt and apo-Wt was computed as |B|. (The modules of vectors A and B define the radii of the dashed circles centered on the apo-Wt peak.)
Figure 3.
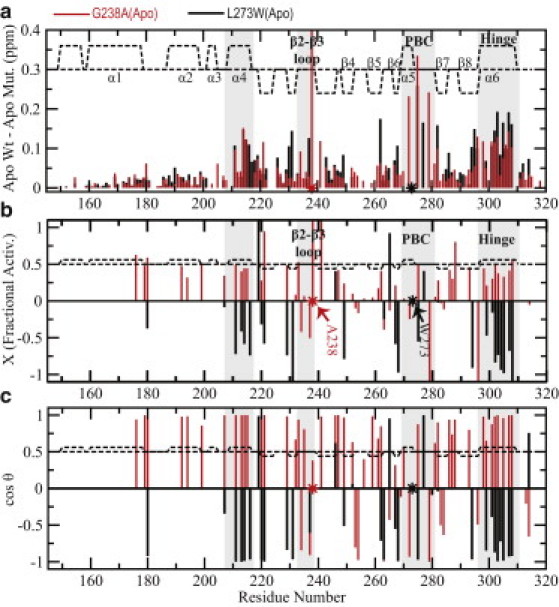
Effects of the L273W and G238A mutations on apo-Wt EPAC1149-318. (a) The compounded chemical shift profile of the apo-mutant relative to apo-Wt. (Dashed lines) The secondary structure of the apo form. (Asterisks) Sites of mutation. (Highlighted shaded zones) Sites subject to some of the most significant cAMP-dependent ppm changes for the apo-Wt protein. (b) Fractional shift toward activation achieved by the mutation in the absence of cAMP for residues with a compounded chemical shift between the apo-Wt and holo-Wt greater than a cut-off value of 0.05 ppm. (c) Projection angle, which is also an indicator of the direction of chemical shift movement along (positive values) or against (negative values) the activation path (i.e., the vector B in Fig. 2).
Projection analysis of NMR chemical shifts
The compounded chemical shift difference between the apo-Wt and the apo-mutant was calculated as the magnitude of vector A in Fig. 2 connecting the apo-Wt and apo-mutant peaks and defined in the plane of the 1H and scaled 15N ppm coordinates. The scaling factor of the 15N ppm values is 0.2 (20). Similarly, the compounded chemical-shift difference between the apo-Wt and the cAMP-bound (holo) Wt is computed as the magnitude of vector B in Fig. 2, which represents the activation vector joining the apo/inactive to the holo/active state. The projection of vector A onto B is a measure of the shift along the activation vector caused by a given mutation. To quantify the extent of activation (or inactivation) achieved by a mutation in the absence of cAMP, the fractional shift (X) is calculated as the ratio of the component of vector A along vector B and the magnitude of vector B (i.e., |B|):
| (1) |
where θ is the angle between vectors A and B, as shown in Fig. 2. Considering that
| (2) |
Eq. 1 is equivalent to
| (3) |
The fractional shift (X) is a scalar and is complemented by the cos(θ) value, which reports on the relative orientation of vectors A and B. Thus, the projection analysis of NMR chemical shifts results in two key residue-specific descriptors of the perturbation caused by the mutation, i.e., the fractional shift (X) and the cos(θ) (Fig. 2). Only those residues with |B| > 0.05 ppm were considered further in the projection analysis to filter out the fractional shifts (X) affected by large experimental errors. Specifically, because |B| is used to normalize the fractional shifts in Eq. 3, a small value of |B| (e.g., |B| ≤ 0.05 ppm) would result in an amplification of the experimental error affecting the measurement of X. In other words, the vector B used as a reference in the projection analysis must be reliable to result in meaningful fractional activation values. Decreasing the |B| cut-off threshold value would introduce more noise in the projection analysis, whereas increasing this threshold value would filter out potentially informative residues, as illustrated in Table S1 in the Supporting Material.
The fractional shift, X, is positive if the mutation shifts the autoinhibition equilibrium toward the active state and negative otherwise. The absolute value of X approaches 0 if the ppm variations caused by the mutation are negligible compared to those caused by cAMP binding and/or if vectors A and B are orthogonal (Fig. 2). When the mutation and cAMP result in ppm changes of comparable magnitude and direction, |X| ∼ 1 (Fig. 2). The |cos(θ)| values approach unity (i.e., |cos(θ)| ∼1) when the effect of the mutation is modeled exclusively based on the two-state active/inactive equilibrium, irrespective of the magnitude of the mutation-induced ppm changes. Whereas, |cos(θ)| < 1 for residues that are more significantly affected by the mutation through nearest-neighbor effects or other structural distortions caused by the mutation and not fully modeled by a shift in the two-state active/inactive equilibrium.
Consequently, the presence of more than two states in the fast exchange regime would compromise the linear chemical shift patterns (see Fig. S1) that are exploited by the projection analysis (PA) method. This lack of linearity would lead to |cos(θ)| values below unity. Thus, only residues with |cos(θ)| values approaching unity are suitable reporters of the position of the two-state autoinhibitory equilibrium through the fractional shift (X). The combined use of cos(θ) and X will be illustrated and validated by the application of the PA method to the well-characterized L273W inactive mutant.
The EPAC autoinhibitory equilibrium is sensitively probed through the projection analysis of NMR chemical shifts: the L273W mutant as a test case
As a first validation of the projection analysis of NMR chemical shifts, we applied it to the apo-L273W versus apo-Wt comparison (Fig. 3, b and c, black bars). The L273W mutation has been shown to promote inactivation (5,21) and therefore we expect a shift of the apo-EPAC conformational equilibrium toward the inactive state. This prediction is confirmed by the projection analysis in Fig. 3, b and c (black bars), as the fractional shift (X) is markedly negative for the residues with |cos(θ)| approaching unity (Fig. 3, b and c, and Fig. 4 a). Furthermore, the projection analysis of L273W bound to cAMP indicates that inactivation is preserved in the holo state (see Fig. S2), in full agreement with the inability of cAMP to activate the L273W mutant (5). Therefore, in contrast to compounded chemical shift profiles, the chemical shift projection analysis provides an effective tool to establish how a given mutation affects the inactive versus active equilibria of the EPAC CBD. In the following sections, the projection analysis is utilized to assess the effect of point mutations on the autoinhibitory apo-EPAC CBD equilibria.
Figure 4.
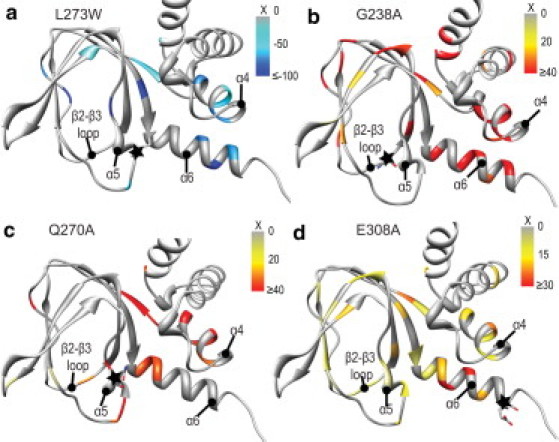
Structural map of the fractional chemical shift changes (X) induced by mutations in the apo state for residues with |cos(θ)| > 0.9, as identified from Figs. 3 and 7. (a) L273W, (b) G238A, (c) Q270A, and (d) E308A. There are a select few residues for which the fractional chemical shift change is negative (or positive in the case of apo-L273W) when |cos(θ)| > 0.9. However, these residues cluster in the vicinity of the mutation and are excluded as they are likely affected by nearest-neighbor effects and not captured by the two-state model, as explained in Results. (Star symbol, illustrated with sticks) The mutation site.
The projection analysis of the G238A mutant reveals that the highly conserved Gly238 of the β2-β3 loop contributes to autoinhibition
G238 of EPAC1 was chosen as a mutation site because this residue is more conserved across CBDs than L273/F300 (11,12) and is indirectly involved in bridging contacts between the PBC and the hinge helix (Fig. 1 d). To probe the contribution of G238 to autoinhibition, we have purified the G238A EPAC1149-318 mutant and have assigned and analyzed the NMR chemical shifts (see Fig. S1). The compounded chemical shifts for the apo G238A versus apo Wt EPAC1149-318 comparison are shown in Fig. 3 a. Based on Fig. 3 a, it is clear that the G238A mutation causes significant long-range chemical shift perturbations that extend to regions far removed from the site of the mutation (indicated by asterisk). Remarkably, G238A affects all key allosteric loci controlled by cAMP, i.e., the PBC, the hinge helix (α6), and the adjacent α4 helix in the NTHB (Fig. 3 a), similarly to L273W (Fig. 3 a, black bars). However, the projection analysis (Fig. 3, b and c) reveals a marked difference between the L273W and G238A mutants in the apo-state. Unlike apo-L273W, for apo-G238A, most of the residues with |cos(θ)| ∼1 (Fig. 3 c) are characterized by strikingly positive fractional shift (X) values (Fig. 4 b).
For instance, for the hinge helix (α6) as well as the adjacent α4 helix, the majority of fractional shifts are in the ∼0.4–0.5 range, clearly indicating that the G238A mutation causes a >40% shift of the conformational equilibria in the apo EPAC1h CBD toward the active state, i.e., in the apo-G238A mutant, the autoinhibition is partially, but significantly, removed. Therefore the highly conserved G238 of the β2-β3 loop is a key contributor to CBD autoinhibition, exerting an inhibitory control on the allosteric sites of the CBD, including the adjacent PBC and the distal C-terminal hinge helix region (Fig. 4 b). In contrast, the G238A mutation has relatively negligible effects on the holo/active state of the CBD (Fig. S2, b and c), suggesting that, at the level of the CBD, the G238A mutation results in more pronounced perturbations on the autoinhibitory equilibria than on activation (Fig. 1 a). A possible explanation for the effect of G238 on the autoinhibitory equilibria is through the CH-π interaction between the Cα of G238 and the guanidinium moiety of a highly conserved arginine in the PBC, i.e., R279 in EPAC1, which has been suggested to have coevolved with G238 (12). To probe the effect of the G238A mutation on the CH-π interaction between G238 and the R279 guanidinium (Fig. 1 d), we performed MD simulations on the EPAC CBD in three states: the Wt apo, the mutant apo-G238A and the Wt cAMP-bound forms.
MD simulations indicate that the apo/active mimicking mutation G238A leads to tighter G238/R279 CH-π interactions and quenched dynamics in the PBC/β2-β3 loop regions
The MD simulations were first validated by computing the residue-specific α-helix probabilities (Fig. 5). We have previously shown by NMR spectroscopy that the most significant changes in secondary structure upon cAMP-binding are an increase in the helicity of α5 in the PBC and a concurrent helical unwinding in the C-terminal region of α6 in the hinge region (17,18). These experimental observations are well reproduced by the simulated MD trajectories (Fig. 5 a). Furthermore, because the projection analysis of the NMR chemical shifts measured for apo G238A indicates that this mutation causes a stabilization of the active conformation, we expect that, if the MD simulations are reliable, they should exhibit a stabilization of α5 and a C-terminal destabilization of α6 when Gly238 is mutated to Ala in the apo form of EPAC. Fig. 5 a shows that, indeed, the MD trajectory computed for the apo G238A mutant displays the experimentally observed trend for the variation in the helical profile of α5 and α6, indicating that, despite the relatively brief 100-ns timescale of the simulations, the MD trajectories capture at least qualitatively the trends observed experimentally through the projection analysis of the chemical shifts of G238A. The qualitative agreement between the MD simulations and the NMR data suggest that the MD trajectories are a useful tool to probe how the G238A mutation affects the CH-π interactions between the conserved Gly and Arg residues of the β2-β3 loop and PBC, respectively.
Figure 5.
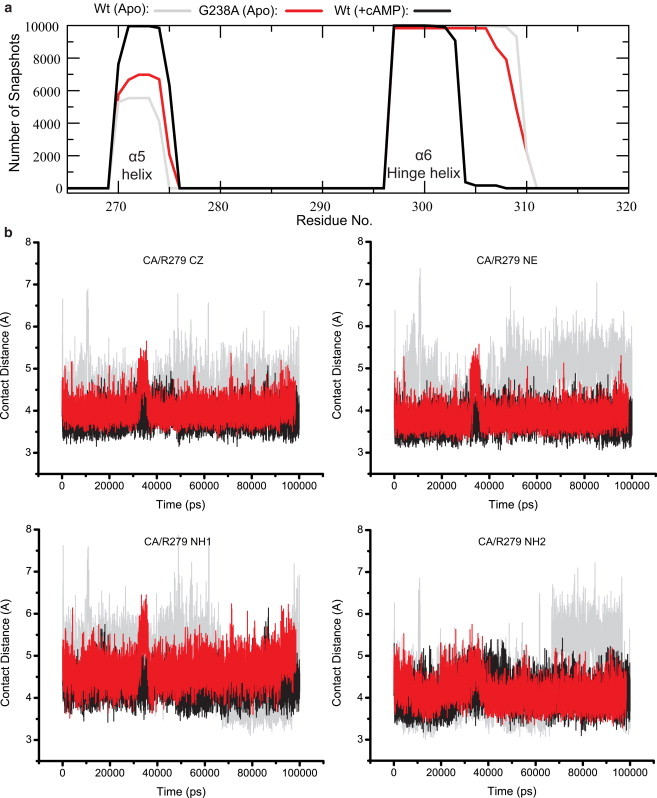
Effect of the G238A mutation as modeled by MD simulations. (a) Secondary structure analyses over the course of the MD trajectories for the apo-Wt, the holo-wt, and the apo-G238A constructs. The analysis is for the region spanning the α5 and α6 helices, which are known to be cAMP-dependent (17–20). (b) Time profile for the contact distances between the Cα of residue 238 and the heavy atoms of the R279 guanidinium group. The color scheme is indicated in panel a.
Fig. 5 b reports the MD-simulated time profiles for the distances that define the CH-π G238/R279 interaction. The G238/R279 distances for the Wt EPAC construct (Fig. 5 b, gray and black traces) indicate that cAMP binding results in a tightening of the CH-π interaction between these two residues (17,18). Fig. 5 b reports also the G238/R279 distances simulated for the apo G238A mutant. Interestingly, the G238A mutation results in a shortening of the 238/279 distances in the apo form that is remarkably similar to that seen upon cAMP binding in the Wt construct (Fig. 5 b). Thus, both the G238A mutation and cAMP-binding result in a tighter CH-π 238/279 interaction. We therefore expect that, similarly to cAMP binding, the G238A mutation should lead to a quenching of dynamics for the PBC and β2-β3 loop regions. This prediction is confirmed by the Procrustean rotation analysis of the MD trajectories (see Fig. S3), which indicates that the G238A substitution causes a net loss in the relative PBC/β2-β3 loop dynamics of the apo form. This MD result is in full agreement with the order parameters of G238A (Fig. 6, a and b; see Fig. S4), indicating that this apo-state mutation causes a quenching in the ps-ns dynamics of the PBC and β2-β3 regions.
Figure 6.
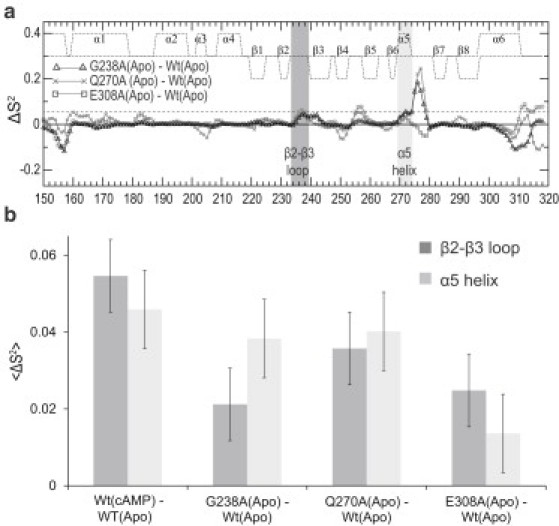
(a) Order parameter differences relative to apo-Wt. (Dashed horizontal line) Standard deviation in the S2 difference between cAMP-bound Wt (18,21) and apo-Wt. (b) Average differences in S2 for the regions subject to consistent dynamic quenching relative to apo-Wt when the apo-active state is stabilized in relation to the apo-inactive state.
Overall, the MD results suggest that G238 controls the autoinhibitory equilibrium of EPAC through its interaction with the guanidinium of R279, which in turn modulates the dynamics and conformational entropy of the PBC and β2-β3 loop regions. Based on this interpretation, G238A stabilizes the active conformation of the apo state by reducing the entropic loss that occurs in the apo-inactive to apo-active transition (Fig. 1 a). This conclusion highlights the importance of the conformational entropy in the PBC and β2-β3 loop for the autoinhibitory equilibrium of EPAC. However, it should be considered that the G238A mutation not only shifts the autoinhibitory equilibrium of EPAC, but also causes severe nearest-neighbor perturbations both at the site of the mutation and in the adjacent PBC, as indicated by the large magnitude of the compounded chemical shift changes (Fig. 3 a) and by the reduced cos(θ) values observed for these regions (Fig. 3 c). Consequently, we conclude that, although the G238A mutation is an excellent tool to evaluate the autoinhibitory role of the β2-β3 loop, the autoinhibitory contribution of entropic losses in the PBC and β2-β3 loop should be further confirmed through other apo/active state-stabilizing mutations that do not directly perturb the β2-β3 loop and are therefore less invasive in this region. The E308A and Q270A mutations are extremely useful in this respect (Fig. 1 d).
The E308A and Q270A EPAC1 mutants provide a noninvasive glimpse of the apo/active metastate
The projection analysis of the chemical shifts of E308A and Q270A EPAC1149-318 (Fig. 7, b and c) shows that both mutants shift the apo conformational equilibria toward the active state, because the majority of residues with |cos(θ)| ∼1 display positive fractional activation values in the ∼0.2–∼0.3 range (Fig. 7, b and c, and Fig. 4, c and d). In this respect, the E308A and Q270A mutants mimic the apo/active state, similarly to G238A, albeit to a smaller extent. However, unlike G238A, the E308A and Q270A mutants do not cause severe nearest-neighbor distortions in the PBC and β2-β3 loop, as indicated by |cos(θ)| values close to unity for most of the residues in these regions (Fig. 4, c and d). E308A and Q270A are therefore minimally invasive apo/active-stabilizing mutants in the EPAC1149-318 construct, and as such they are ideally suited to test the hypothesis that the PBC and β2-β3 loop dynamics are quenched upon transition from the apo/inactive to apo/active state, causing an entropic penalty that prevents premature activation in the absence of cAMP, i.e., that promotes autoinhibition.
Figure 7.
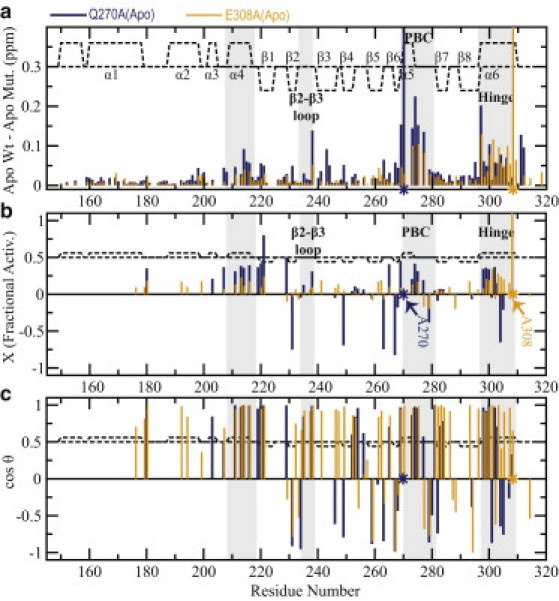
Effects of the E308A and Q270A mutations on apo-Wt EPAC1149-318. (a) The compounded chemical shift profile of the apo-mutant relative to apo-Wt. (b) Fractional shift toward activation achieved by the mutation in the absence of cAMP, as in Fig. 3b. (c) Projection angle as in Fig. 3c.
To quantify the losses in conformational entropy occurring in the apo/inactive to apo/active transition, we evaluated the order parameters, S2 (26), for apo-E308A and apo-Q270A (see Fig. S4) and compared them to the corresponding apo-Wt values (Fig. 6, a and b). A remarkable feature that emerges from Fig. 6 is that for both the β2-β3 loop and the PBC α5 helix, the order parameters measured for the apo-Wt are consistently lower than those observed for the apo-mutant samples with increased relative populations of the active conformation (i.e., G238A, E308A, and Q270A). As shown in Fig. 6 b, the average β2-β3 and α5 S2 enhancement relative to apo-Wt is consistently positive for both apo-mutants, similarly to G238A and to the Wt cAMP-bound (holo) state. We therefore conclude that the β2-β3 and PBC-α5 regions promote autoinhibition by contributing a conformational entropy loss in the inactive-to-active conformational transition.
Discussion
The autoinhibition determinants of EPAC extend beyond the L273/F300 pair of the hydrophobic hinge and include the β2-β3 loop and the α5 helix
The mechanism of autoinhibition in EPAC has been previously rationalized in terms of the hydrophobic hinge hypothesis (4,5), whereby the reorientation of the hinge helix toward the β-subdomain required for activation is prevented by a steric clash between the L273 in α5 and F300 in α6 (Fig. 1 c). Our NMR data support this mechanism, as the projection analysis of the chemical shifts of L273W shows that this bulky mutant shifts the apo conformational equilibrium toward the inactive state. However, the NMR investigation of the other mutations included in this study clearly reveals that the L273/F300 steric hindrance is not the only determinant of EPAC autoinhibition. Several other structural elements of the CBD of EPAC contribute to the control of the inactive-versus-active conformational equilibrium of the CBD in the absence of cAMP. Here we have identified two such elements, i.e., the α5 in the PBC and the β2-β3 loop. The β2-β3 loop has been previously shown to play a key role in the cAMP-dependent activation of EPAC (17,18,20,21), but its contribution to autoinhibition (i.e., to the selective stabilization of the apo/inactive versus apo/active state) was not anticipated before, to our knowledge. In the following sections we discuss the mechanism utilized by these structural moieties to control the position of the autoinhibitory equilibrium of EPAC.
Entropic control of autoinhibition by α5 and the β2-β3 loop
The comparative analysis of the G238A, Q270A, and E308A mutants indicates that whenever the apo/active state is stabilized relative to the apo/inactive state (Fig. 1 a), the dynamics of the β2-β3 and α5 regions is consistently reduced. This result fully supports the hypothesis that the β2-β3 loop and the α5 in the PBC help control the position of the apo/inactive versus apo/active equilibrium by imposing an unfavorable entropic loss as their ps-ns dynamics are quenched in the inactive-to-active conformational transition. A similar quenching of dynamics was previously reported for the β2-β3 loop and the α5 helix upon cAMP binding to Wt EPAC1 as measured by 15N relaxation measurements (17). However, in the absence of cAMP, this entropic penalty does not appear to be fully compensated by the enthalpic gain resulting from the tighter G238/R279 Cα-π and L273/F300 van der Waals contacts in the apo/active versus apo/inactive structures. This conclusion highlights how flexible regions in the apo form can be a critical molecular determinant of autoinhibition.
The investigated determinants of autoinhibition in EPAC CBD are nondegenerate and lead to enhanced specificity in the ligand-dependent activation
The main goal of this work was to identify key determinants of autoinhibition in the cAMP-binding domain (CBD) of EPAC, which serves also as a model system for other eukaryotic CBDs. The isolated CBD model used here (i.e., EPAC1149-318) is ideally suited for this purpose. In addition, we anticipate that, if the NMR data on the CBD are functionally relevant, a shift toward activation in the autoinhibitory equilibrium of the apo CBD should result in decreased AC50 and increased kmax values (27) as measured from bioassays (see Fig. S5). This prediction is confirmed not only in the extreme case of L273W as discussed above (5), but also in the case of Q270A and E308A, for which published AC50 and kmax values are available (see Table S2) (27), suggesting that, at least on a qualitative basis, the NMR data on the isolated CBD bear some functional significance. However, a quantitative correlation between the NMR and the bioassay data (i.e., AC50 and kmax values) is not warranted at this stage, because the construct used in our NMR studies is a fragment of the multidomain EPAC proteins typically required for functional assays. These longer constructs include additional autoinhibitory elements that involve other domains. For instance, the so-called ionic latch is a set of salt bridges between the regulatory and catalytic regions of EPAC, which selectively stabilizes the closed inactive topology of EPAC.
We therefore expect that the correlation between the NMR results on the isolated CBD and the bioassay data to be only qualitative (see Table S2). Despite these limitations, a striking feature of autoinhibition emerging from this NMR mutational study is that the suppression of a single autoinhibition determinant, among those investigated here, is insufficient to elicit a complete shift toward activation—i.e., no single mutation out of those tested is able to completely mimic the activation obtained at saturating cAMP concentrations.
This observation suggests that it is necessary to simultaneously suppress multiple autoinhibitory determinants to obtain a complete shift toward the active state. In this respect, the different structural elements of the CBD involved in autoinhibition (i.e., α5, β2-β3 loop, and α6) are nondegenerate and we propose that such lack of degeneracy in the autoinhibition mechanism of EPAC confers added specificity toward cAMP. Overall, the requirement that multiple autoinhibitory determinants must be simultaneously and collectively suppressed builds into the CBD a molecular switch with increased specificity toward the cAMP ligand.
Concluding Remarks
The mutations utilized in this study suggest that the previously proposed hydrophobic hinge hypothesis based on the L273/F300 steric clash is not sufficient alone to account for all the molecular determinants of EPAC autoinhibition. First, several other highly conserved motifs within the CBD contribute to autoinhibition, including the β2-β3 loop and the α5 helix. Second, these conserved structural elements fine-tune the autoinhibitory equilibrium of EPAC for optimal cAMP sensitivity not only through steric and van der Waals interactions, as previously proposed, but also through entropic losses arising from regions that are more dynamic in the apo/inactive state relative to the apo/active state. Third, the multiple autoinhibitory determinants identified here appear to be nondegenerate with respect to the complete activation of EPAC, suggesting that their collective suppression is required for full EPAC activity. Such nondegeneracy provides an effective means to enhance the specificity of the allosteric effectors that act on the EPAC molecular switch. Fourth, we anticipate that the concepts and methods illustrated here will be useful also for other systems. For instance, the presumed novel projection analysis (PA) proposed here will likely be useful in evaluating how mutations modulate the position of conformational equilibria for domains that function as allosteric sensors in the regulation of signaling pathways (28–30).
Acknowledgments
We thank M. Akimoto, J. Milojevic, and Dr. Holger Rehmann for helpful discussions. We also acknowledge the Shared Hierarchical Academic Research Computing Network for use of their high-performance computing resources as well as Dr. Stuart Rothstein's research group for use of the Procrustean rotation software.
We thank the Canadian Institute of Health Research and the National Sciences and Engineering Research Council for financial support. We are also indebted to the Heart and Stroke Foundation of Canada for a Maureen Andrew New Investigator award to G.M.
Supporting Material
References
- 1.de Rooij J., Zwartkruis F.J., Bos J.L. EPAC is a Rap1 guanine-nucleotide-exchange factor directly activated by cyclic AMP. Nature. 1998;396:474–477. doi: 10.1038/24884. [DOI] [PubMed] [Google Scholar]
- 2.Kawasaki H., Springett G.M., Graybiel A.M. A family of cAMP-binding proteins that directly activate Rap1. Science. 1998;282:2275–2279. doi: 10.1126/science.282.5397.2275. [DOI] [PubMed] [Google Scholar]
- 3.Rehmann H., Arias-Palomo E., Bos J.L. Structure of EPAC2 in complex with a cyclic AMP analogue and RAP1B. Nature. 2008;455:124–127. doi: 10.1038/nature07187. [DOI] [PubMed] [Google Scholar]
- 4.Rehmann H., Das J., Bos J.L. Structure of the cyclic-AMP-responsive exchange factor EPAC2 in its auto-inhibited state. Nature. 2006;439:625–628. doi: 10.1038/nature04468. [DOI] [PubMed] [Google Scholar]
- 5.Rehmann H., Prakash B., Wittinghofer A. Structure and regulation of the cAMP-binding domains of EPAC2. Nat. Struct. Biol. 2003;10:26–32. doi: 10.1038/nsb878. [DOI] [PubMed] [Google Scholar]
- 6.Grandoch M., Roscioni S.S., Schmidt M. The role of EPAC proteins, novel cAMP mediators, in the regulation of immune, lung and neuronal function. Br. J. Pharmacol. 2010;159:265–284. doi: 10.1111/j.1476-5381.2009.00458.x. [DOI] [PMC free article] [PubMed] [Google Scholar]
- 7.Abu-Abed M., Das R., Melacini G. Definition of an electrostatic relay switch critical for the cAMP-dependent activation of protein kinase A as revealed by the D170A mutant of RIα. Proteins. 2007;69:112–124. doi: 10.1002/prot.21446. [DOI] [PubMed] [Google Scholar]
- 8.Berman H.M., Ten Eyck L.F., Taylor S.S. The cAMP binding domain: an ancient signaling module. Proc. Natl. Acad. Sci. USA. 2005;102:45–50. doi: 10.1073/pnas.0408579102. [DOI] [PMC free article] [PubMed] [Google Scholar]
- 9.Das R., Melacini G. A model for agonism and antagonism in an ancient and ubiquitous cAMP-binding domain. J. Biol. Chem. 2007;282:581–593. doi: 10.1074/jbc.M607706200. [DOI] [PubMed] [Google Scholar]
- 10.Johnson D.A., Akamine P., Taylor S.S. Dynamics of cAMP-dependent protein kinase. Chem. Rev. 2001;101:2243–2270. doi: 10.1021/cr000226k. [DOI] [PubMed] [Google Scholar]
- 11.Kornev A.P., Taylor S.S., Ten Eyck L.F. A generalized allosteric mechanism for cis-regulated cyclic nucleotide binding domains. PLOS Comput. Biol. 2008;4:e1000056. doi: 10.1371/journal.pcbi.1000056. [DOI] [PMC free article] [PubMed] [Google Scholar]
- 12.Kannan N., Wu J., Taylor S.S. Evolution of allostery in the cyclic nucleotide binding module. Genome Biol. 2007;8:R264. doi: 10.1186/gb-2007-8-12-r264. [DOI] [PMC free article] [PubMed] [Google Scholar]
- 13.McNicholl E.T., Das R., Melacini G. Communication between tandem cAMP binding domains in the regulatory subunit of protein kinase A-Iα as revealed by domain-silencing mutations. J. Biol. Chem. 2010;285:15523–15537. doi: 10.1074/jbc.M110.105783. [DOI] [PMC free article] [PubMed] [Google Scholar]
- 14.Das R., Esposito V., Melacini G. cAMP activation of PKA defines an ancient signaling mechanism. Proc. Natl. Acad. Sci. USA. 2007;104:93–98. doi: 10.1073/pnas.0609033103. [DOI] [PMC free article] [PubMed] [Google Scholar]
- 15.Masterson L.R., Shi L., Veglia G. Dynamically committed, uncommitted, and quenched states encoded in protein kinase A revealed by NMR spectroscopy. Proc. Natl. Acad. Sci. USA. 2011;108:6969–6974. doi: 10.1073/pnas.1102701108. [DOI] [PMC free article] [PubMed] [Google Scholar]
- 16.Zagotta W.N., Olivier N.B., Gouaux E. Structural basis for modulation and agonist specificity of HCN pacemaker channels. Nature. 2003;425:200–205. doi: 10.1038/nature01922. [DOI] [PubMed] [Google Scholar]
- 17.Das R., Chowdhury S., Melacini G. Dynamically driven ligand selectivity in cyclic nucleotide binding domains. J. Biol. Chem. 2009;284:23682–23696. doi: 10.1074/jbc.M109.011700. [DOI] [PMC free article] [PubMed] [Google Scholar]
- 18.Das R., Mazhab-Jafari M.T., Melacini G. Entropy-driven cAMP-dependent allosteric control of inhibitory interactions in exchange proteins directly activated by cAMP. J. Biol. Chem. 2008;283:19691–19703. doi: 10.1074/jbc.M802164200. [DOI] [PubMed] [Google Scholar]
- 19.Mazhab-Jafari M.T., Das R., Melacini G. Understanding cAMP-dependent allostery by NMR spectroscopy: comparative analysis of the EPAC1 cAMP-binding domain in its apo and cAMP-bound states. J. Am. Chem. Soc. 2007;129:14482–14492. doi: 10.1021/ja0753703. [DOI] [PubMed] [Google Scholar]
- 20.Selvaratnam R., Chowdhury S., Melacini G. Mapping allostery through the covariance analysis of NMR chemical shifts. Proc. Natl. Acad. Sci. USA. 2011;108:6133–6138. doi: 10.1073/pnas.1017311108. [DOI] [PMC free article] [PubMed] [Google Scholar]
- 21.Vanschouwen B., Selvaratnam R., Melacini G. Role of dynamics in the auto-inhibition and activation of the exchange protein directly activated by cyclic AMP (EPAC) J. Biol. Chem. 2011 doi: 10.1074/jbc.M111.277723. [Epub ahead of print] PMID: 21873431. [DOI] [PMC free article] [PubMed] [Google Scholar]
- 22.Delaglio F., Grzesiek S., Bax A. NMRPipe: a multidimensional spectral processing system based on UNIX pipes. J. Biomol. NMR. 1995;6:277–293. doi: 10.1007/BF00197809. [DOI] [PubMed] [Google Scholar]
- 23.Goddard T.D., Kneller D.G. University of California; San Francisco, CA: 2006. SPARKY 3. [Google Scholar]
- 24.Berjanskii M.V., Wishart D.S. The RCI server: rapid and accurate calculation of protein flexibility using chemical shifts. Nucleic Acids Res. 2007;35(Web Server issue):W531–W537. doi: 10.1093/nar/gkm328. [DOI] [PMC free article] [PubMed] [Google Scholar]
- 25.Berjanskii M.V., Wishart D.S. A simple method to predict protein flexibility using secondary chemical shifts. J. Am. Chem. Soc. 2005;127:14970–14971. doi: 10.1021/ja054842f. [DOI] [PubMed] [Google Scholar]
- 26.Jarymowycz V.A., Stone M.J. Fast time scale dynamics of protein backbones: NMR relaxation methods, applications, and functional consequences. Chem. Rev. 2006;106:1624–1671. doi: 10.1021/cr040421p. [DOI] [PubMed] [Google Scholar]
- 27.Rehmann H., Schwede F., Bos J.L. Ligand-mediated activation of the cAMP-responsive guanine nucleotide exchange factor EPAC. J. Biol. Chem. 2003;278:38548–38556. doi: 10.1074/jbc.M306292200. [DOI] [PubMed] [Google Scholar]
- 28.Ramos D., Ducat T., Goto N.K. Conformation of the cell division regulator MinE: evidence for interactions between the topological specificity and anti-MinCD domains. Biochemistry. 2006;45:4593–4601. doi: 10.1021/bi060022j. [DOI] [PubMed] [Google Scholar]
- 29.Brubaker W.D., Freites J.A., Martin R.W. Separating instability from aggregation propensity in γS-crystalline variants. Biophys. J. 2011;100:498–506. doi: 10.1016/j.bpj.2010.12.3691. [DOI] [PMC free article] [PubMed] [Google Scholar]
- 30.Popovych N., Sun S., Kalodimos C.G. Dynamically driven protein allostery. Nat. Struct. Mol. Biol. 2006;13:831–838. doi: 10.1038/nsmb1132. [DOI] [PMC free article] [PubMed] [Google Scholar]
- 31.Phillips J.C., Braun R., Schulten K. Scalable molecular dynamics with NAMD. J. Comput. Chem. 2005;26:1781–1802. doi: 10.1002/jcc.20289. [DOI] [PMC free article] [PubMed] [Google Scholar]
- 32.Oblinsky D.G., VanSchouwen B.M.B., Rothstein S.M. Procrustean rotation in concert with principal component analysis of molecular dynamics trajectories: quantifying global and local differences between conformational samples. J. Chem. Phys. 2009;131:225102. doi: 10.1063/1.3268625. [DOI] [PubMed] [Google Scholar]
Associated Data
This section collects any data citations, data availability statements, or supplementary materials included in this article.