

Abstract
Confocal fluorescence microscopy is a powerful biological tool providing high-resolution, three-dimensional (3D) imaging of fluorescent molecules. Many cellular components are weakly fluorescent, however, and thus their imaging requires additional labeling. As an alternative, label-free imaging can be performed by photothermal (PT) microscopy (PTM), based on nonradiative relaxation of absorbed energy into heat. Previously, little progress has been made in PT spectral identification of cellular chromophores at the 3D microscopic scale. Here, we introduce PTM integrating confocal thermal-lens scanning schematic, time-resolved detection, PT spectral identification, and nonlinear nanobubble-induced signal amplification with a tunable pulsed nanosecond laser. The capabilities of this confocal PTM were demonstrated for high-resolution 3D imaging and spectral identification of up to four chromophores and fluorophores in live cells and Caenorhabditis elegans. Examples include cytochrome c, green fluorescent protein, Mito-Tracker Red, Alexa-488, and natural drug-enhanced or genetically engineered melanin as a PT contrast agent. PTM was able to guide spectral burning of strong absorption background, which masked weakly absorbing chromophores (e.g., cytochromes in the melanin background). PTM provided label-free monitoring of stress-related changes to cytochrome c distribution, in C. elegans at the single-cell level. In nonlinear mode ultrasharp PT spectra from cyt c and the lateral resolution of 120 nm during calibration with 10-nm gold film were observed, suggesting a potential of PTM to break through the spectral and diffraction limits, respectively. Confocal PT spectromicroscopy could provide a valuable alternative or supplement to fluorescence microscopy for imaging of nonfluorescent chromophores and certain fluorophores.
Introduction
Among the various optical microscopic imaging methods, including absorption, fluorescence, scattering, and Raman techniques, confocal fluorescence microscopy remains the most powerful biological tool. It allows three-dimensional (3D) imaging of absorbing molecules (termed chromophores) having dominant radiative relaxation of absorbed energy (i.e., fluorophores) (1). Despite its widespread use for diverse applications, fluorescence imaging suffers from some well-documented limitations such as photobleaching, blinking, and autofluorescent background in cells and tissues (2,3). Because many cellular components are only weakly fluorescent in the native state, their imaging by fluorescence microscopy requires tagging with fluorescent labels (4), most of which are cytotoxic (5–11), and can alter cell properties even at subtoxic levels (12,13).
As an alternative, photothermal (PT) microscopy (PTM) has demonstrated tremendous potential for high-sensitivity, label-free imaging of nonfluorescent or weakly fluorescent chromophores having dominant nonradiative conversion of absorbed energy into heat (14–16). Laser-induced thermal effects in PTM can be detected by diverse methods including dual-beam (pump/probe) thermal lensing, beam deflection (e.g., mirage effects), phase-contrast, polarization-interference contrast, and heterodyne schematics (see reviews (15–18) and references cited therein). Documented applications of PTM include studies of cellular cytochrome c (cyt c) (19–21), laser surgery (22), mitochondrial morphology (23), neuron receptors (24), blood cell-surface markers (PT immunoassay) (25), gene expression (PT-DNA microarrays) (26), cell-cycle distribution (27), gold nanoparticle tracking in live cells (28,29), PT flow cytometry (30–33), and imaging of heme proteins (18,34) (see also reviews (16,19)). PT demonstrated the highest absorption sensitivity of all microscopic imaging modalities, allowing detection of single molecules (35) or single 1.4-nm gold nanoparticles comprising just 57 Au atoms (16). It is noteworthy that these techniques have potential for further improvements, which may include thermal-lens multiplex imaging (21), far-field PT microscopy beyond the diffraction limit (36), PT nanocluster drug assay (37), use of advanced nanoparticles as PT molecular labels (16,38), PT multiphoton microscopy (34), and nonlinear high-resolution PT spectroscopy (39).
Most biological applications of PTM have been realized either through heterodyne detection of scattered probe laser light (16,29,35), or time-resolved thermal lens detection via probe beam defocusing with one-photon (20,21), or two-photon laser excitation (34). Heterodyne detection of scattered probe light requires relatively high power for the probe laser (35), and is obscured in light-scattering biological tissues. Indeed, single molecule (35) and nanoparticle (16) detection have been achieved under the most favorable PT conditions using strongly absorbing targets and minimal scattering background (23,35). Thermal-lens detection proved to be less sensitive to scattering background (20). Two-photon excitation improves axial resolution (34) but increases the likelihood of tissue photodamage; moreover, it is applicable only to a limited range of absorbing targets. Almost all existing applications of PT microscopy were directed to the detection of just a single chromophore (e.g., cyt c) or nanoparticle type using a limited range of laser wavelengths. Identification of multiple cellular chromophores in a real biological environment had not been demonstrated previously by PTM, especially at the level of a whole living organism. In 2002, we proposed PT confocal microscopy schematics for tissue imaging (40,41). In 2004, confocal thermal-lens detection was developed for nonbiological samples (42,43). However, applications of PT confocal microscopy to spectral identification and 3D imaging in live tissues have not been reported yet.
Herewith, we introduce a PT confocal spectromicroscopy that integrates a robust pulsed single-photon excitation and confocal thermal-lens detection schematic. The advantages of this microscopic platform include label-free spectral identification and 3D imaging of multiple chromophores and even fluorophores in live cells and intact Caenorhabditis elegans.
Materials and Methods
PT confocal microscope setup
The confocal PTM was built on the technical platform of an Olympus IX81 inverted microscope (Olympus America, Center Valley, PA) (see Fig. S1 in the Supporting Material) and a tunable pulsed optical parametric oscillator (Opolette HR 355 LD, OPOTEK, Carlsbad, CA) with the following parameters: spectral range, 410–2200 nm; pulse width, 5 ns; pulse repetition rate, 100 Hz; and energy fluence range, 0.1–104 mJ/cm2. PTM was integrated with standard modules for transmission and fluorescence microscopy in biological samples. The energy of the laser pulses referred also as laser pump pulses (or beam) were controlled by an energy meter (PE10-SH, OPHIR, Logan, UT). In PT thermal-lens mode, laser-induced temperature-dependent variations of the refractive index (thermal lens) upon absorption of the pump laser radiation caused the defocusing of a collinear He-Ne laser (model 117A, Spectra-Physics, Santa Clara, CA) probe beam with a wavelength of 633 nm and power of 1.4 mW. Reduction in beam intensity at its center (referred to as a PT signal; see Supporting Material) was detected by a photodetector with built-in preamplifier (PDA36A, 40 dB amplification, ThorLabs, Newton, NJ) after transiting a narrow-bandpass filter (MaxLine laser clean-up filter, central wavelength 633 nm, spectral bandwidth 12.5 nm, LL01-633-12.5, Semrock, Rochester, NY). In linear mode, PT signal showed a linear, positive, asymmetric component associated with fast heating (0.1–0.5 μs) and slower (0.5–1 μs) cooling effects. In nonlinear mode, a sharp negative peak was associated with the formation of nano- and microbubbles around overheated zones (18). Laser-induced bubbles, with typical duration of 0.2–1 μs, are formed after absorption of the excitation-laser pulse (∼5–10 ns duration) following a typical delay of 20–100 ns; thus, they could not affect pump-pulse absorption, but significantly enhanced probe beam refraction. The laser beam waists were adjusted by beam expanders (BE02M-A, ThorLabs) before entering the microscope. Chromatic aberrations were minimized by the use of achromatic objectives (100× Olympus DPlan, oil, NA 1.25, or 60× Olympus PlanApo N, oil, NA 1.42, Olympus America). The plane of the probe-beam pinhole was fixed one Rayleigh distance from the collected probe-beam waist (42,43). Focusing of beams in the sample was controlled by axial translation of a focusing objective, with 50-nm positioning precision.
A computer (Dell (Round Rock, TX) Precision 690) equipped with a high-speed (200 MHz) analog-to-digital converter board PCI-5124, 12-bit card, 128 MB of memory (National Instruments, Austin, TX) was used to acquire signals from the photodiode and energy meter (see Supporting Material). The synchronization of the excitation laser, signal acquisition/procession, and feedback-enhanced control over the translation stage were implemented in a single software module (in-house software based on LabView 8.5 complex, National Instruments). Correction of PT spectra over the wide range of wavelengths was implemented offline with the use of standard samples (see Supporting Material). The optical bright-field and fluorescence images were obtained with a color charge-coupled device camera (DP-72, Olympus), which was also used to navigate the laser beams to sample areas of interest.
Cell culture
B16F10, SK-mel-1, and MDA-MB-231 cells were purchased from the ATCC, maintained at the NIGMS Mutant Cell Repository (Manassas, VA). Stable transgenic MDA-MB-231 cells expressing a green fluorescent protein (GFP) were the gift of Dr. Thomas Kelly (University of Arkansas for Medical Sciences, Little Rock, AR). All cells were cultured in Dulbecco's modified Eagle's medium (unless stated otherwise) supplemented with 10% fetal bovine serum, and maintained at 37°C in an atmosphere of 5% CO2, 95% ambient air.
Nematode Strains
C. elegans strains: wild-type Bristol-N2, 1295 (expressing GFP) and JJ1271 glo-1(zu391) (lacking autofluorescence and birefringent gut granules) (44) were obtained from the Caenorhabditis Genetics Center (Minneapolis, MN). Worms were maintained at 20°C, and fed on Escherichia coli bacteria, strain OP50.
Reagents
MitoTracker Red CMXRos dye (catalogue No. M-7512) fluorescent dye, primary monoclonal antibody to cyt c (catalogue No. 456100), and secondary Alexa488-labeled goat antibody to mouse IgG (H+L) at 2 mg/mL (catalogue No. A11001) were purchased from Invitrogen (Carlsbad, CA). PE-conjugated antibody to melanoma-associated chondroitin sulfate proteoglycan (MCSP), a cell-surface antigen specific for human melanoma, was purchased from Miltenyi Biotec (Auburn, CA). Plasmid pEGFP-wt-TYR was the gift of Dr. Ruth Halaban (Yale School of Medicine, New Haven, CT).
Paclitaxel activation of melanogenesis
To activate melanogenesis, B16F10 mouse melanoma cells were treated with 10 μM paclitaxel introduced into tissue-culture growth medium. PT imaging was used to quantify melanin content 2.5 h after drug administration. B16F10 cells not treated with the drug were used as control.
Melanogenesis activation in MDA-MB-231 breast cancer cell culture
Before transfection human (MDA-MB-231) cells were expanded in liquid medium (Leibovitz's L-15 + antibiotic) for 2 days. A pEGFP-wt-TYR plasmid was introduced using lipofectamine according to a standard protocol (45). All cells were allowed 24-h recovery before imaging. Obtained transgenic cells expressing tyrosinase and eGFP were imagined by transmission, wide-filed fluorescence and PT microscopy 24 h after tyrosinase activation. Original MDA-231-MB cells were used as control.
Mitochondria and cyt c staining in cells and C. elegans
B10F16 and MDA-231 cells were cultured overnight on glass slides in Dulbecco's modified Eagle's medium plus 10% fetal bovine serum at 37°C, 5% CO2. For staining, 1 μL of 10-μg/mL MitoTracker solution was added to 0.5 mL of growth medium; cells were incubated with the dye at 37°C for 5 min, and then washed 3 times with phosphate buffered saline (PBS) and overlaid with a coverslip for microscopy.
C. elegans first-stage (L1) larvae were collected in the absence of bacteria, and then grown 3 days on agarose plates previously seeded with 100-μL of E. coli OP50 bacteria containing 4 μg/mL MitoTracker dye. Adult worms (3 days posthatch) were washed with distilled H2O, anesthetized in a 1% (w/v) aqueous solution of sodium azide, and placed on a glass slide under a coverslip for observation. The remaining worms were fixed in a freshly prepared aqueous solution of 1% formaldehyde as described, and used for immunofluorescence staining of the cyt c distribution. Primary antibody was added at 5 μL per 0.9 mL of buffer (dilution 5.5/1000) overnight at 20°C, followed by 5 μL of Alexa488-tagged secondary antibody in 0.5 mL of buffer (dilution 1/100) overnight at 20°C.
Results
Confocal PT microspectroscopy platform
To overcome several limitations of the previous designs of pulsed PT microscopy, such as low axial resolution (>10 μm), the lack of 3D imaging and spectral scanning capabilities, we developed a time-resolved dual-beam (pump-probe) confocal PTM (Fig. 1 A). The pump laser pulses (also termed pump pulses) induce temperature-dependent modulations of the refractive index around absorbing targets, thus defocusing a collinear continuous wave probe beam (Fig. 1 B). The detector's pinhole aperture positioned on a plane situated one Rayleigh range away from the waist plane of the probe beam (Fig. 1 A) provided detection of the thermal-lens effect while eliminating the influence of out-of-focus PT signals. Images were constructed by acquiring PT signals from a sample as it undergoes X-Y scanning. For 3D imaging, several PT images are acquired on parallel x-y planes distributed along the z axis. Relative to existing designs this PTM scheme adds the following features: 1), confocal thermal-lens detection geometry with pulse-excitation mode; 2), time-resolved PT signal detection; 3), relatively high pulse-rate of tunable pump laser (100 Hz); 4), possible nonlinear signal amplification via nanobubbles induction; 4), rapid spatial scanning (10 ms per image pixel); 5), rapid spectral tuning (100 nm/s) across a wide spectral range, 410–2200 nm; 6), low probe-beam power (1 mW); 7), flexibility in the adjustment of lateral and axial resolution; and 8), synchronization of spatial and spectral scanning. These features provide a versatile, multifunctional capability for PT confocal microscopy in biological applications, such as 1), conventional PT imaging; 2), 3D imaging; 3), time-resolved studies of dynamic PT effects at the level of 0.1–2 μs; 4), spectral identification of cellular proteins (including fluorescent reporters) over broad visible and near-infrared spectral ranges (Fig. 1 C); and 5), study of laser-induced nonlinear effects.
Figure 1.
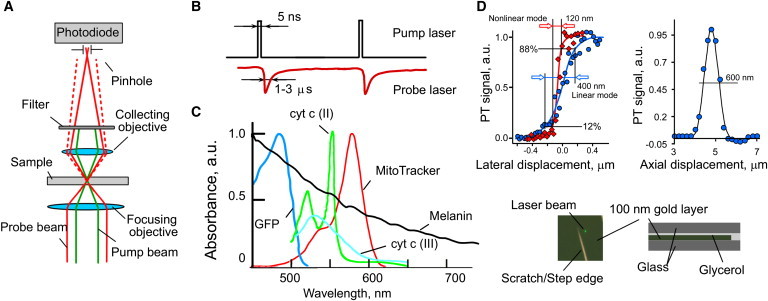
Confocal PT spectromicroscopy of intrinsic cellular chromophores. (A) Confocal pump-probe PTM schematic. (B) Time-resolved PT signals (bottom) observed as changes in probe beam intensity after pump-pulse excitation (top). (C) Absorption spectra of chromophores and fluorophores. (D) Top left: lateral PTM resolution in linear (circles) and nonlinear (diamonds) modes, normalized signal curves; top right, axial PTM resolution in linear mode. Bottom: photo of the scratched gold layer (left) and a scheme of layer deposition (right) for lateral and axial resolution studies.
Spatial resolution
Lateral and axial resolutions of confocal PTM were estimated by imaging 100- and 10-nm gold films on a glass substrate (Fig. 1 D). Lateral PT resolution was determined by a line-scan method (50-nm step size) through a gold film sample having a well-defined edge at relatively low (0.1 J/cm2) and high (5 J/cm2) energy fluence associated with linear and nonlinear PTM modes. The distance in a line scan, between 12% and 88% of PT signal amplitude points, represented the equivalent of full width at half-maximum for a Gaussian intensity distribution (Fig. 1 D, left). Axial resolution was determined by transverse translation of a beam focused through the gold film by the focusing objective with a 100-nm step. The full width at half-maximum of PT signal curve was used to calculate axial resolution of PTM (Fig. 1 D, right). For a 100× focusing objective and 532-nm excitation, the axial resolution was 600 nm, and lateral resolution was 350 nm, and 120 nm in linear and nonlinear modes, respectively (Fig. 1 D, upper panels).
Imaging and identification of intracellular melanin
We first assessed the ability of confocal PTM to image intracellular melanin, which by virtue of its absorption across a broad spectral range (Fig. 1 C) is an attractive intrinsic marker in melanoma cells. In (46), we proposed genetic engineering of melanin in cells with low melanin content as a potentially universal PT and photoacoustic contrast agent in analogy to GFP in fluorescent techniques.
PT imaging of lightly pigmented human melanoma SK-mel-1 cells revealed the presence of a few melanin clusters (Fig. 2, A and Fig. 2 B, right panel), invisible by conventional transmission microscopy (Fig. 2 B, left) or indistinguishable from other light scatterers. PT microspectroscopy confirmed that the detected subcellular microstructures had an absorption signature of melanin (Fig. 2 C). Confocal PTM provided intracellular distribution of melanin in 3D (Fig. 2 A, bottom, and Movie S1). Using PT imaging we observed four- to sixfold induction of melanin synthesis by paclixatel, a FOXO3a activator (Fig. 2 D and Fig. S3). Next, we increased PT contrast of nonmelanoma cells by stimulating melanin synthesis (46). Melanogenesis was induced in MDA-MB-231 breast cancer cells after introduction of a plasmid expressing an eGFP-tagged tyrosinase gene (47). Melanin formation in breast cancer cells was detected just 1 day following plasmid transfection (Fig. 2 D, lower panels; Fig. S4); whereas no PT signals were observed in the control cells under the same conditions. Fluorescence imaging of eGFP coexpressed with tyrosinase correlated imperfectly with PT imaging of melanin (Fig. S4 C), as some cells showed significant melanin content but low levels of fluorescence. This suggested that tyrosinase expression revealed by the eGFP tag is less useful as a measure of melanogenesis induction than direct PT melanin quantification. It should be noted that the relatively low absorption of submicron-sized melanin clusters, and the small difference in scattering properties between melanin and intracellular organelles, limits identification of melanin in the cells by scattering-based (darkfield or phase-contrast) microscopic methods (48).
Figure 2.
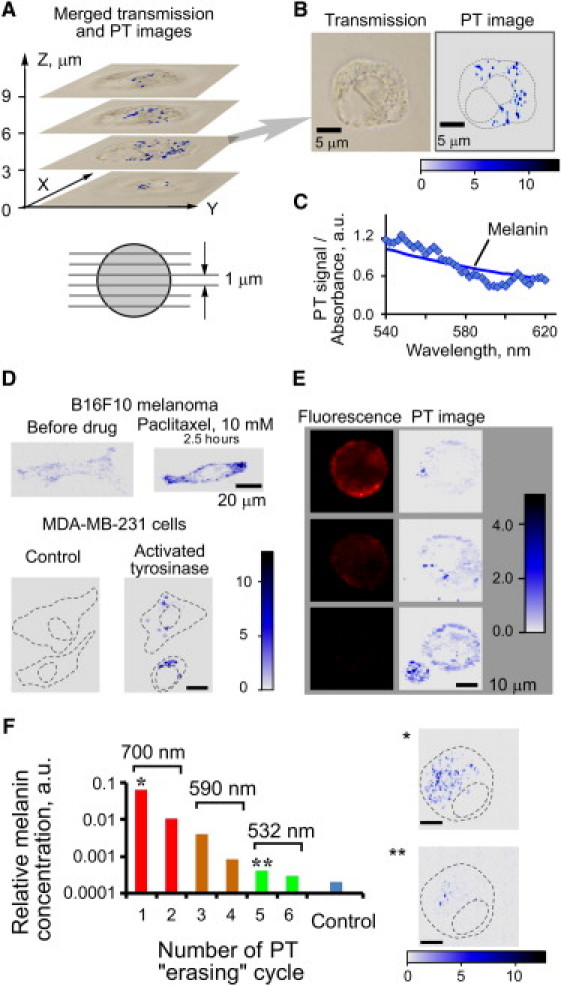
PT imaging of melanin in live cells. (A–C) Melanin detection in a single SK-mel-1 cell by confocal PTM. (A) 3D melanin distribution: top, merged transmission and PT images taken along the Z axis, and the corresponding cell sectioning scheme (bottom). (B) Melanin in cell cytoplasm: transmission (left) and PT (right) images. (C) PT spectral identification of intracellular melanin (diamonds) and a conventional absorption spectrum (darker, solid line). (D) Melanogenesis monitoring by PTM. Top: activation of melanogenesis in B16F10 cells by drug exposure (10-μM paclixatel). PT imaging before (left) and after (right) exposure. Bottom: activation of tyrosinase expression in MDA- MB-231 breast cancer cells transfected with a pEGFP-wt-TYR expression plasmid. PT images of control (left) and transfected (right) cells. (E) Fluorescent (left) and PT (right) images of the same three SK-mel-1 cells; fluorescence signal derives from phycoerythrin-conjugated antibody to MCSP at the cell membrane, whereas PT imaging of melanin in the cytoplasm is label-free. PTM parameters: pump laser wavelength, 600 nm; pulse energy, (A),(B),(E) 200 nJ, (D) 20 nJ; scanning step size (A),(B) 0.5 μm, (D),(E) 1.0 μm. (F) Gradual PTM guided spectral burning of melanin in B16F10 melanoma cells. Single and double asterisks mark PT image before and after PT erasing, respectively. Dashed lines indicate cell membrane and nuclear boundaries. Pump laser parameters (wavelength, pulse energy): (I) 700 nm, 0.5 μJ; (II) 590 nm, 5.0 μJ; (III) 532 nm, 8.3 μJ; beam diameter, 0.8 μm.
Confocal PTM was used in combination with fluorescence microscopy to assess the correlation between pigmentation of individual cells and expression of MCSP, which is implicated in cell adhesion, motility, and invasion processes (49,50). Although MCSP expression has been linked to melanoma pigmentation and neoplastic phenotype, no data have been presented to date that show a clear relationship between pigmentation and oncogenesis or metastatic potential (49). The accuracy of pigmentation-based prognosis could be impaired if histological pigmentation is assessed at low sensitivity, or if metastatic activity is determined by a minor subset of circulating melanoma cells (51), or if pigmentation is affected by conditions at each site of metastatic growth (52). PTM permitted pigmentation and gene expression data to be correlated for individual cells including circulating tumor cells (51) at very high sensitivity. In particular, with PTM, significant variations in cell pigmentation were observed for the SK-mel-1 cell line (Fig. 2 E). According to the conventional flow cytometry (Fig. S5), 51% of these cells expressed MCSP. A similar percentage of cells produced high-level PT signals from melanin. Simultaneous fluorescence imaging of antibody-labeled MCSP and PT imaging of melanin revealed an inverse relationship: in cells with high MCSP content melanin was low, and vice versa (Fig. 2 E). These data correlated well with the melanoma phenotype during differentiation (50). Thus, the integration of PTM and fluorescence microscopy can be useful as a tool to dissociate prognostic markers that are not functionally related, and, as we demonstrated herewith, to establish a possible link between melanin pigmentation and the oncogenic potential of individual circulating melanoma cells (46).
Finally, we used PTM in the time-resolved mode to explore PT signal amplification (10- to 30-fold) through laser-induced nano- and microbubbles around overheated melanin clusters at relatively high laser-pulse energies (38,39). The amplification of PT signal was associated with strong refraction of the probe beam light on passage through a gas-phase bubble (i.e., acting as a strongly negative spherical lens). The power of such an air lens was dramatically higher than that of a thermal lens in a uniform (single-phase) medium. These effects were accompanied by PT-based highly localize thermal decomposition of melanin. We termed this approach spectral burning (i.e., spectrally selective target destruction) by analogy to conventional spectral hole burning (53). We demonstrated this technique for erasing melanin within B16F10 melanoma cells, as evidenced by a several hundredfold decrease in the melanin-specific absorption of cells (Fig. 2 F, see details in the Supporting Material). This spectral burning technique, under PTM guidance, can become a useful tool for many applications, such as removal of specific organelles, or of strong cellular background absorption that masks other weakly absorbing cellular components (e.g., cytochromes). To the best of our knowledge, these data represent the first application of the laser spectral burning under PTM guidance within individual living cells.
Spectromicroscopy of chromophores and fluorophores
Most cell chromophores and fluorophores have nonoverlapping or partially overlapping absorption spectra in the visible and near-infrared range. Because PT signal amplitude is proportional to cellular absorption, simultaneous PT imaging and PT spectroscopy of cells can attain high spatial and spectral resolution. Microspectroscopy provides both localization and identification of cellular chromophores. To validate this approach, we compared fluorescent imaging of mitochondria in human breast cancer MDA-MB-231 cells (Fig. 3 A) stained with MitoTracker (Fig. 3 B) and PTM imaging at 532 nm (Fig. 3 C, green). This wavelength corresponded to the absorption maximum of oxidized cyt c (oxidation state III). In addition, MitoTracker was imaged by PTM at 580 nm (Fig. 3 C, red). PT and fluorescence imaging show approximate colocalization of PT and fluorescence signals, both expected to be associated with mitochondria. Slight shifts in the peak locations of PT signals at 532 nm relative to 580 nm (Fig. 3 C, red and green points) apparently reflect movement of mitochondria in the cytoplasm between PT measurements. To confirm colocalization of MitoTracker and cyt c signals, PT spectromicroscopy of the areas with high cyt c signals was performed. PT spectra (Fig. 3 D) revealed spectral signatures having maxima at 530–550 nm and 570–585 nm, which correspond to peaks of cyt c and MitoTracker absorbance (Fig. 1 C). PT spectra from control unstained cells and from the 30 μM MitoTracker solution showed only one maximum each (see Fig. S6) associated with absorption spectra of cyt c and MitoTracker, respectively.
Figure 3.
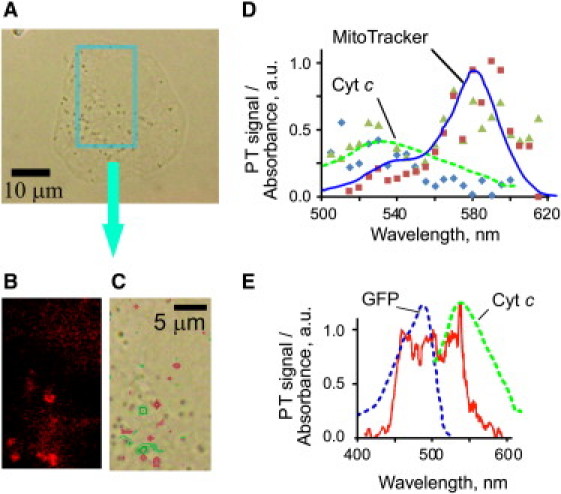
Multispectral PT microscopy of breast cancer MDA-MB-231 cells with MitoTracker and GFP. A transmission image, magnification 100×. Fluorescence (B) and PT (C) images of the selected cell region at 580 nm and 532 pump-laser wavelengths. (D) PT spectral signature (triangles) of colocalized MitoTracker (for which the absorption spectrum is indicated by a solid line) and cytochrome c [III] (dashed line) in MitoTracker-stained cells; ribbons and squares show PT spectra from an unstained cell and from 30-μM MitoTracker solution, respectively. (E) PT spectrum (solid line) obtained from a MDA-MB-231 breast cancer cell expressing GFP (pEGFP-N1 vector). Dashed lines represent absorption spectra of GFP and cyt c [III]. Laser parameters: beam diameter, 1 μm; pulse energy, 0.5–20 μJ.
In MDA-MB-231 cells expressing a GFP, PT spectroscopy resolved GFP (absorbance in 450−500 nm spectral range) and cyt c absorbing at 530−550 nm (Fig. 3 E). PT imaging of GFP distribution was in agreement with fluorescent microscopy data (Fig. S6, C and D). Thus, label-free PTM allows both identification of nonfluorescent cyt c and imaging of fluorescent GFP. Moreover, integration of PT imaging and spectroscopy allowed distinguishing multiple chromophores and fluorophores and proved their intracellular collocation. Some PT spectra were sharper than the absorption spectra (Fig. 3 E) that was associated with nonlinear nanobubble-induced PT signal amplification accompanied by spectral ultrasharpening phenomena (39).
Multispectral imaging of C. elegans
We performed PT multispectral imaging and spectral identification of up to four chromophores simultaneously, in live C. elegans nematodes immobilized by the metabolic inhibitor sodium azide. In studies paralleling those described for cultured human cells in the preceding section nematodes were analyzed by PTM, PT spectroscopy, and fluorescence imaging. High confocal-based axial resolution and low influence of scattering background provided the markedly superior resolution of PTM for each chromophore, indicating the cytosolic distribution of GFP (i.e., absence from nuclei and smaller organelles), and a punctate or tubular distribution for MitoTracker, as a typical signature of mitochondrial morphology (see Fig. S7). Moreover, nonconfocal fluorescence imaging was confounded by significant background autofluorescence (54) in wild-type worms, which was absent in PT images. To minimize autofluorescence, all subsequent experiments used a nematode strain (JJ1271) having very low intestinal autofluorescence. PT signal from cyt c (532 nm) was at similar amplitude for wild-type and JJ1271 worms, implying far less background contributed by autofluorescent granules to PT images than to fluorescence images. Mitochondria were then labeled by feeding MitoTracker dye to live nematodes (Fig. S7 and Fig. S8), and imaged both via MitoTracker fluorescence and by PT mapping of the cyt c distribution. The resulting PT images of cyt c (Fig. S8 C) were punctate or reticular, similar to images of cell mitochondria made with the pH-dependent dye rhodamine 123 (55), whereas MitoTracker fluorescence was diffuse (Fig. S8 B).
As a demonstration of confocal PTM imaging in adult C. elegans, we reconstructed the volume distribution of light-absorbing components for live anesthetized nematodes. PT images were scanned in a stack of 10 parallel planes spaced at 5-μm intervals. Fig. 4 illustrates the distribution of PT signals in an anterior segment (Fig. 4 A, showing pharynx and intestine), and in more posterior segments (Fig. 4 B, displaying two overlaid worms). Cyt c-associated signals were strongest within body wall muscles (Fig. 4 C, white arrows), and in the nerve ring area (Fig. 4 C, yellow stripe). Much weaker cyt c signals close to the detection limits originated in intestine and uterus (green arrows), whereas nearby body muscles provided high PT signals (Fig. 4 D; see Movie S2 in the Supporting Material for 3D rendering of absorption distribution). Due to high axial resolution (Fig. 1 D), and thermal-lens detection schematics, confocal PT imaging was not affected by the second worm lying on top of the one imaged (the pump laser beam was coming from the bottom).
Figure 4.
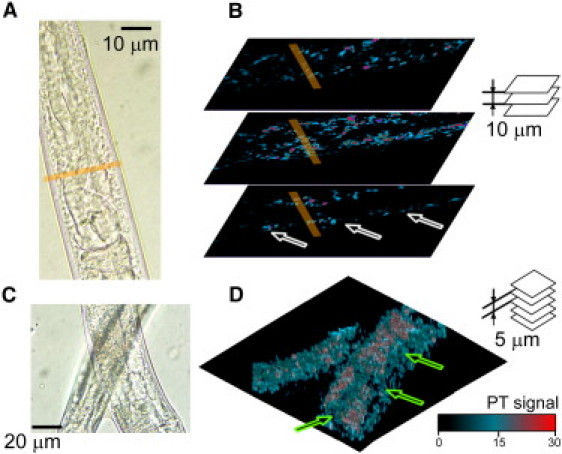
PT confocal 3D imaging of cyt c distribution in nematodes. (A and B) TDM/PT images of a pharyngeal region, and (C and D) TDM/PT images of posterior segments. (B) Three transverse PT images of the anterior region (A) visualize cyt c in body wall muscle (arrows) and in the nerve ring (line), at 10-μm steps. (D) 3D rendering of 10 transverse PT images taken sequentially at 5-μm steps along the Z axis.
To evaluate whether absorption of cyt c determines PT signals at 532 nm, we incubated permeabilized nematodes with antibody to cyt c. Worms fed with MitoTracker to label mitochondria were fixed and stained with Alexa-488-tagged secondary antibody to visualize cyt c. PT imaging was performed at wavelengths corresponding to MitoTracker (590 nm, Fig. 5 A, right), Alexa-488 (490 nm, Fig. 5 B, right), cyt c (532 nm, Fig. 5 C), and flavin (450 nm, Fig. 5 D). Images derived by PT showed excellent collocalization of discrete signals for Alexa-488 dye (490 nm) immunohistochemically linked to cyt c, and cyt c detected directly (532-nm PT image). The fluorescence images of Mitotracker dye (Fig. 5 A, left) and Alexa-488-tagged cyt c (Fig. 5 B, left) agreed reasonably well, but differ markedly from PT images, probably due to their lower spatial resolution (both confocal depth and within-plane resolution) combined with greater light scattering. Flavins, scanned at their 450-nm absorption peak (54), provided a control PT image that was more homogeneous than the other markers. Flavins, which become oxidized and accumulate in C. elegans tissues during aging (54), did not always correlate spatially with the other three presumably colocalized chromophores. This is not surprising, because aggregates of oxidized or otherwise misfolded proteins accrue in the cytoplasm during C. elegans aging but are not localized to specific organelles (56,57). These results, and the differential spectra acquired from the sample (Fig. 5 E), demonstrate the ability of PT to map and identify up to four chromophores with well-resolved absorption spectra in C. elegans.
Figure 5.
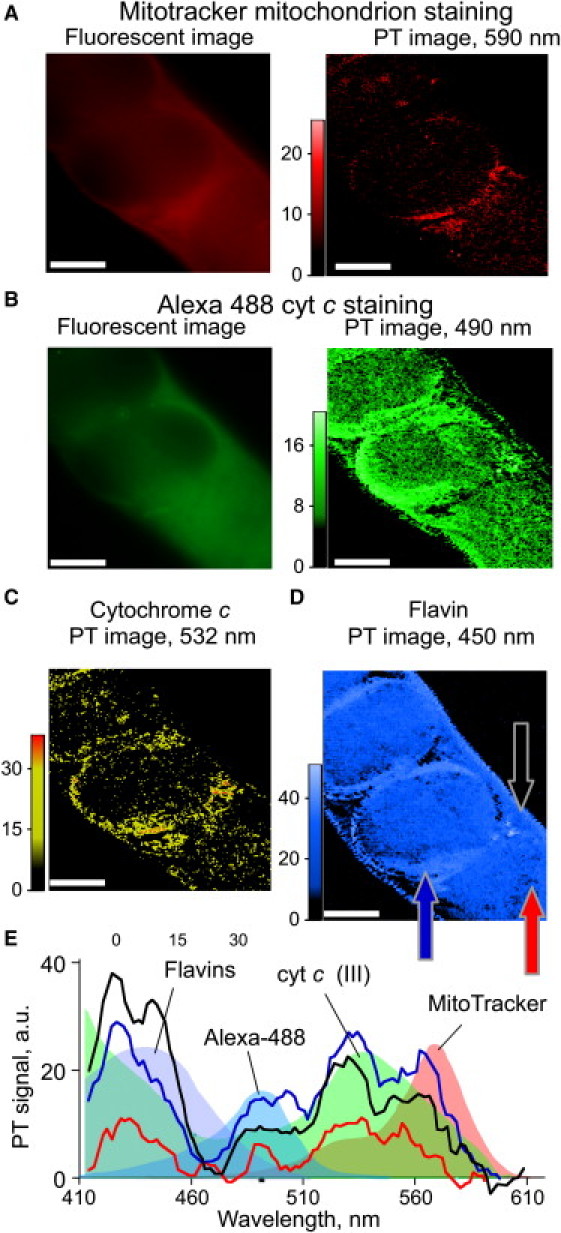
Multispectral imaging of four different light-absorbing reporters in a nematode histological sample. (A and B) Fluorescence and PT images of MitoTracker (A) and Alexa-488 (B) stains. (C and D) Label-free PT imaging of cyt c (C) and flavin (D) distributions in nematode tissues. (E) PT spectra from three different sites in the sample (arrows in panel D). Conventional absorbance spectra of the identified components are superimposed as colored backgrounds. Laser parameters: wavelengths, 590/490/532/450 nm for A/B/C/D, respectively; beam diameter, 300 nm; scanning step size, 0.5 μm; pulse energy, 2/6/4/6 μJ for A/B/C/D, respectively.
In vivo monitoring of oxidative stress
In vivo label-free PT imaging cyt c could be used for assessment of mitochondrial dysfunction or the apoptotic release of cyt c into the cytoplasm. PTM with short laser exposure (5 ns) generates minimal laser-induced stress in C. elegans (58). In successive scans of the cyt c distribution in C. elegans, the PT signal decreased ∼5% per scan over a 30-min period, most likely related to slight laser-induced spatial and absorption modification of cyt c in the irradiated zone. Data involving repetitive scans were therefore normalized to compensate for this effect. Oxidative stress was triggered in a live nematode (Fig. 6, A and B), by a well-establish hydrogen peroxide exposure method (0.5 mM, well below 3–7 mM levels used in toxicity assays (59)). We acquired PT images from the central (perivulval) area of the worm, including eggs within the oviduct (Fig. 6, C–F), and monitored local PT signal amplitudes and spectra from the nerve-ring area before and after exposure (Fig. 6, G–I). PT signal significantly changed due to oxidative stress; the highest amplitude increase was observed for body muscles having the highest mitochondrial content. In contrast, PT signal amplitude in cuticle decreased over time relative to the initial observation, probably due to direct diffusion of hydrogen peroxide into the external cuticle. Real-time PT signal monitoring near the nerve ring (Fig. 6 G) provided kinetics of oxidative stress (Fig. 6, H and I), in the pharyngeal area easily accessible to ingested hydrogen peroxide. In particular, we observed an increased positive component of PT signal at the nerve ring, 0.5 min after administering hydrogen peroxide, which was transformed into a negative component at 5 min, followed by a gradual fall in PT signal as it returned to its original level. According to the nanocluster model of PTM assay (37), this PT signal behavior corresponds to the following sequential effects 1), mitochondrial shrinkage (a natural metabolic response to oxidative stress (60)), resulting in increased local concentration of cyt c in smaller mitochondria; this led to the increased local absorbance and resulted in an initial increase of PT signal amplitude; 2) further absorbance increase favors nano- and microbubble formation around overheated zones, which transforms the positive PT signal shape into negative due to strong refractive and scattering optical effects in bubbles (20,37,39); and 3), PT signal amplitude decline may be associated with cyt c escape from mitochondria to cytoplasm due to apoptosis, decreasing the local cyt c concentration and mitochondrial absorbance. For simplicity, here we present PT signal amplitude behavior in absolute units (Fig. 6 H). To the best of our knowledge, this is the first real-time, label-free assessment of oxidative stress in individual cells of live C. elegans.
Figure 6.
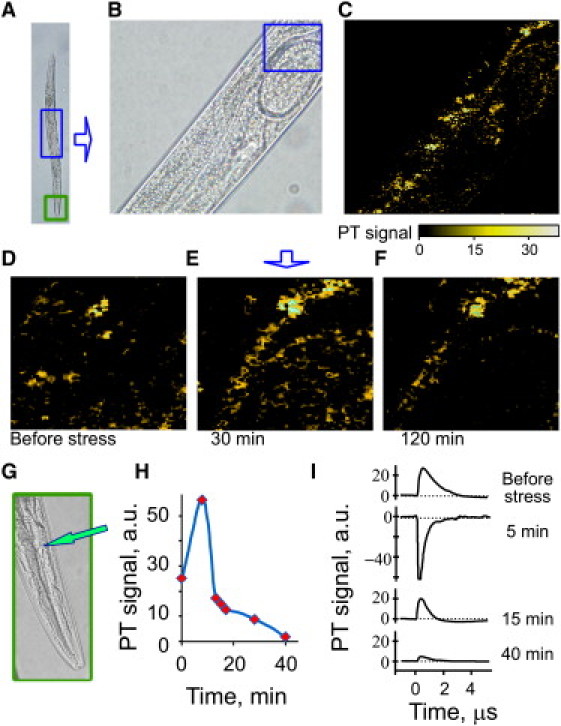
In vivo real-time label-free PT monitoring of cyt c release after oxidative stress in a nematode. (A and B) Transmission images of nematode regions scanned for cyt c signal. (A) an entire worm; (B) central region (corresponding to the top square in A), for which the cyt c PT image is shown in C. (D–F) Successive PT images of a small tissue region (square in B): before (D), 30 min (E), and 120 min (F) after initiating exposure to peroxide stress. Laser parameters: wavelength, 532 nm; beam diameter, 300 nm; step size, 500 nm; pulse energy, 2 μJ. (G) head area (bottom square in A), indicating nerve ring (arrow) at which PT signal was monitored for H and I. (H) PT signal amplitude as a function of oxidative-stress time and, (I) corresponding PT signal shapes. Laser parameters: wavelength, 532 nm; beam diameter, 2 μm; pulse energy, 10 μJ.
Discussion
In this work, we demonstrated what to our knowledge are several new applications of advanced multifunctional PTM for confocal imaging of nonfluorescent chromophores with dominant nonradiative relaxation of absorbed energy in live cells and C. elegans. The described PTM design combined one-photon excitation in a wide spectral range and confocal detection of PT effect. It provided 3D spatial reconstruction of local absorption to map the distribution of specific molecular species, along with spectral identification of chromophores having intracellular localizations. Their identification can be performed either locally, by acquiring detailed local PT spectra across a wide range of wavelengths (400–2200 nm, Fig. S2), or via acquisition of multispectral PT images at several wavelengths followed by pixel-by-pixel calculation of the sample spectra. We also demonstrated detection of fluorescent dyes and proteins by PTM. For fluorophores undergoing radiative energy relaxation, PT contrast is reduced relative to that of chromophores with the same absorbance (Eq. S2). As a result, the higher pump-laser energy required for fluorophore detection would increase the likelihood of sample photobleaching. For chromophores such as melanin, we demonstrated the safety of long-term PT monitoring of live cells with only minimal temperature increase (estimated as 0.5–1°K in a diffraction-limited volume; see the Supporting Material).
From our perspective, future applications of PTM could include quantitation of chromophore expression in transgenic cell lines having high light absorbance contrast, and real-time reporting of cell-drug or cell-nanoparticle interactions. PT imaging is able to localize sites of reporter accrual, and to quantify and identify chromophores and light-absorbing nanoparticles. In particular, PT imaging of melanin demonstrated high sensitivity and flexibility of methods to study its subcellular distribution. We showed that PT can assess melanogenesis, not only in melanoma cells but also in nonmelanocytes such as breast cancer cells transgenically induced to produce melanin (Fig. 2 D). Development of transgenic light-absorbing reporters, which may retain absorption properties in fusion proteins, would add further potential applications of absorbance-based imaging.
To our knowledge, we report here for the first time that a PT technique can provide label-free 3D imaging and identification of the cellular cyt c distribution (originating in mitochondria) or of other chromophores within individual human cells in culture or C. elegans in vivo. Assessment in different tissues revealed different PT image patterns, presumably due to differences in respiratory activity. We demonstrated that label-free PTM provided monitoring of changes due to oxidative stress and subsequent stress-induced mitochondrial shrinkage leading to increased local cytochrome absorption. The data acquired are in line with our previous findings of ultrahigh sensitivity of the PT assay in vitro, to effects of chemicals, radiation, and drugs (3–7 orders of magnitude better than the sensitivity of any previous assays) at the single-cell level (18,20,37).
As initially proposed previously (46) and verified here, genetically engineered melanin has the potential to be a universal PT contrast agent, comparable to GFP in fluorescence techniques. The ability to monitor melanin expression and its activation by various inducing agents is especially relevant to the application of PT and photoacoustic techniques to diagnosis of skin melanoma, and label-free detection of circulating melanoma cells in blood and lymph—a key diagnostic indicator of metastatic progression, cancer recurrence, and therapeutic efficacy (46). PT monitoring of drug-enhanced melanin synthesis demonstrates the potential of PTM for studies of cell response to various drugs (20).
Compared to photoacoustic tomography (61), confocal PTM has lower depth penetration due to probe beam geometry distortion in optically thick samples (15). However, much higher absorption sensitivity (by 50- to 100-fold), and noncontact, noninvasive measurement, could make PTM the method of choice for cell studies in vitro as well as in vivo for optically transparent animal models such as C. elegans or zebrafish. Further improvements of the pulsed PTM schematics would include minimization of vibrational noise, accurate optimization of the optical scheme (43), development of the methodology for accurate quantitative calibration of PTM in scattering samples, and the use of pulsed laser sources with high pulse repetition rate (up to 500 kHz) for fast imaging (62). The observed super narrow PT spectral bands of cyt c and the lateral resolution of 120 nm in nonlinear mode suggests tremendous potential of far-field PTM to break through the spectral and diffraction limits using laser-induced nanobubbles as PT signal amplifiers.
Acknowledgments
We thank Dr. J.-H. Ye for the help with cell cultures.
This work was supported in part by the National Institutes of Health grant Nos. R01EB000873, R01CA131164, R01EB009230, and R21CA139373, the National Science Foundation grant Nos. DBI-0852737 and the Arkansas Biosciences Institute, and by support from the Department of Veterans Affairs to R.J.S.R.
Supporting Material
References
- 1.Lichtman J.W., Conchello J.A. Fluorescence microscopy. Nat. Methods. 2005;2:910–919. doi: 10.1038/nmeth817. [DOI] [PubMed] [Google Scholar]
- 2.Doornbos R.M.P., de Grooth B.G., Greve J. Experimental and model investigations of bleaching and saturation of fluorescence in flow cytometry. Cytometry. 1997;29:204–214. doi: 10.1002/(sici)1097-0320(19971101)29:3<204::aid-cyto3>3.0.co;2-b. [DOI] [PubMed] [Google Scholar]
- 3.Slavik J. Plenum Press; New York: 1996. Fluorescence Microscopy and Fluorescent Probes. [Google Scholar]
- 4.Bornhop D.J., Contag C.H., Murphy C.J. Advance in contrast agents, reporters, and detection. J. Biomed. Opt. 2001;6:106–110. doi: 10.1117/1.1360394. [DOI] [PubMed] [Google Scholar]
- 5.Nestmann E.R., Douglas G.R., Kowbel D.J. Mutagenic activity of rhodamine dyes and their impurities as detected by mutation induction in Salmonella and DNA damage in Chinese hamster ovary cells. Cancer Res. 1979;39:4412–4417. [PubMed] [Google Scholar]
- 6.Zdolsek J.M. Acridine orange-mediated photodamage to cultured cells. APMIS. 1993;101:127–132. doi: 10.1111/j.1699-0463.1993.tb00091.x. [DOI] [PubMed] [Google Scholar]
- 7.Molnar J., Petofi S., Motohashi N. Antiplasmid and carcinogenic molecular orbitals of benz[c]acridine and related compounds. Anticancer Res. 1993;13:263–266. [PubMed] [Google Scholar]
- 8.Zhang J.L., Yokoyama S., Ohhashi T. Inhibitory effects of fluorescein isothiocyanate photoactivation on lymphatic pump activity. Microvasc. Res. 1997;54:99–107. doi: 10.1006/mvre.1997.2030. [DOI] [PubMed] [Google Scholar]
- 9.Saetzler R.K., Jallo J., Tuma R.F. Intravital fluorescence microscopy: impact of light-induced phototoxicity on adhesion of fluorescently labeled leukocytes. J. Histochem. Cytochem. 1997;45:505–513. doi: 10.1177/002215549704500403. [DOI] [PubMed] [Google Scholar]
- 10.Hoshino A., Hanada S., Yamamoto K. Toxicity of nanocrystal quantum dots: the relevance of surface modifications. Arch. Toxicol. 2011;85:707–720. doi: 10.1007/s00204-011-0695-0. [DOI] [PubMed] [Google Scholar]
- 11.Ghaderi S., Ramesh B., Seifalian A.M. Fluorescence nanoparticles “quantum dots” as drug delivery system and their toxicity: a review. J. Drug Target. 2011;19:475–486. doi: 10.3109/1061186X.2010.526227. [DOI] [PubMed] [Google Scholar]
- 12.Nolte M.A., Kraal G., Mebius R.E. Effects of fluorescent and nonfluorescent tracing methods on lymphocyte migration in vivo. Cytometry A. 2004;61:35–44. doi: 10.1002/cyto.a.20074. [DOI] [PubMed] [Google Scholar]
- 13.Abbitt K.B., Rainger G.E., Nash G.B. Effects of fluorescent dyes on selectin and integrin-mediated stages of adhesion and migration of flowing leukocytes. J. Immunol. Methods. 2000;239:109–119. doi: 10.1016/s0022-1759(00)00189-7. [DOI] [PubMed] [Google Scholar]
- 14.Zharov V.P., Letokhov V.S. Springer-Verlag; New York: 1986. Laser Optoacoustic Spectroscopy. [Google Scholar]
- 15.Bialkowski S.E. Wiley-Interscience; New York: 1996. Photothermal Spectroscopy Methods for Chemical Analysis. [Google Scholar]
- 16.Cognet L., Berciaud S., Lounis B. Photothermal methods for single nonluminescent nano-objects. Anal. Chem. 2008;80:2288–2294. doi: 10.1021/ac086020h. [DOI] [PubMed] [Google Scholar]
- 17.Proskurnin M.A., Kononets M.Y. Modern analytical thermooptical spectroscopy. Russ. Chem. Rev. 2004;73:1143–1172. [Google Scholar]
- 18.Zharov V.P., Lapotko D.O. Photothermal imaging of nanoparticles and cells. IEEE J. Sel. Top. Quantum Electron. 2005;11:733–751. [Google Scholar]
- 19.Tamaki E., Sato K., Kitamori T. Single-cell analysis by a scanning thermal lens microscope with a microchip: direct monitoring of cytochrome c distribution during apoptosis process. Anal. Chem. 2002;74:1560–1564. doi: 10.1021/ac011092t. [DOI] [PubMed] [Google Scholar]
- 20.Zharov V.P., Galitovskiy V., Chambers T.C. Superhigh-sensitivity photothermal monitoring of individual cell response to antitumor drug. J. Biomed. Opt. 2006;11:064034. doi: 10.1117/1.2405349. [DOI] [PubMed] [Google Scholar]
- 21.Brusnichkin A.V., Nedosekin D.A., Zharov V.P. Ultrasensitive label-free photothermal imaging, spectral identification, and quantification of cytochrome c in mitochondria, live cells, and solutions. J Biophotonics. 2010;3:791–806. doi: 10.1002/jbio.201000012. [DOI] [PMC free article] [PubMed] [Google Scholar]
- 22.Lapotko D.O., Romanovskaya T.R., Zharov V.P. Photothermal time-resolved imaging of living cells. Lasers Surg. Med. 2002;31:53–63. doi: 10.1002/lsm.10068. [DOI] [PubMed] [Google Scholar]
- 23.Lasne D., Blab G.A., Cognet L. Label-free optical imaging of mitochondria in live cells. Opt. Express. 2007;15:14184–14193. doi: 10.1364/oe.15.014184. [DOI] [PubMed] [Google Scholar]
- 24.Thoumine O., Ewers H., Choquet D. Probing the dynamics of protein-protein interactions at neuronal contacts by optical imaging. Chem. Rev. 2008;108:1565–1587. doi: 10.1021/cr078204m. [DOI] [PubMed] [Google Scholar]
- 25.Kimura H., Sekiguchi K., Mukaida M. Assay of spherical cell surface molecules by thermal lens microscopy and its application to blood cell substances. Anal. Chem. 2001;73:4333–4337. doi: 10.1021/ac010257v. [DOI] [PubMed] [Google Scholar]
- 26.Blab G.A., Cognet L., Lounis B. Optical readout of gold nanoparticle-based DNA microarrays without silver enhancement. Biophys. J. 2006;90:L13–L15. doi: 10.1529/biophysj.105.076182. [DOI] [PMC free article] [PubMed] [Google Scholar]
- 27.Hammiche A., German M.J., Martin F.L. Monitoring cell cycle distributions in MCF-7 cells using near-field photothermal microspectroscopy. Biophys. J. 2005;88:3699–3706. doi: 10.1529/biophysj.104.053926. [DOI] [PMC free article] [PubMed] [Google Scholar]
- 28.Cognet L., Tardin C., Lounis B. Single metallic nanoparticle imaging for protein detection in cells. Proc. Natl. Acad. Sci. USA. 2003;100:11350–11355. doi: 10.1073/pnas.1534635100. [DOI] [PMC free article] [PubMed] [Google Scholar]
- 29.Leduc C., Jung J.-M., Lounis B. Direct investigation of intracellular presence of gold nanoparticles via photothermal heterodyne imaging. ACS Nano. 2011;5:2587–2592. doi: 10.1021/nn1023285. [DOI] [PubMed] [Google Scholar]
- 30.Zharov V.P., Galanzha E.I., Tuchin V.V. Integrated photothermal flow cytometry in vivo. J. Biomed. Opt. 2005;10:051502. doi: 10.1117/1.2070167. [DOI] [PubMed] [Google Scholar]
- 31.Zharov V.P., Galanzha E.I., Tuchin V.V. Photothermal image flow cytometry in vivo. Opt. Lett. 2005;30:628–630. doi: 10.1364/ol.30.000628. [DOI] [PubMed] [Google Scholar]
- 32.Zharov V.P., Galanzha E.I., Tuchin V.V. In vivo photothermal flow cytometry: imaging and detection of individual cells in blood and lymph flow. J. Cell. Biochem. 2006;97:916–932. doi: 10.1002/jcb.20766. [DOI] [PubMed] [Google Scholar]
- 33.Zharov V.P., Galanzha E.I., Tuchin V.V. Photothermal flow cytometry in vitro for detection and imaging of individual moving cells. Cytometry A. 2007;71:191–206. doi: 10.1002/cyto.a.20384. [DOI] [PubMed] [Google Scholar]
- 34.Lu S.J., Min W., Xie X.S. Label-free imaging of heme proteins with two-photon excited photothermal lens microscopy. Appl. Phys. Lett. 2010;96:113701–113703. [Google Scholar]
- 35.Gaiduk A., Yorulmaz M., Orrit M. Room-temperature detection of a single molecule's absorption by photothermal contrast. Science. 2010;330:353–356. doi: 10.1126/science.1195475. [DOI] [PubMed] [Google Scholar]
- 36.Zharov V.P. Far-field photothermal microscopy beyond the diffraction limit. Opt. Lett. 2003;28:1314–1316. doi: 10.1364/ol.28.001314. [DOI] [PubMed] [Google Scholar]
- 37.Zharov V.P., Galitovsky V., Chowdhury P. Nanocluster model of photothermal assay: application for high-sensitive monitoring of nicotine-induced changes in metabolism, apoptosis, and necrosis at a cellular level. J. Biomed. Opt. 2005;10:44011. doi: 10.1117/1.1990200. [DOI] [PubMed] [Google Scholar]
- 38.Kim J.W., Galanzha E.I., Zharov V.P. Golden carbon nanotubes as multimodal photoacoustic and photothermal high-contrast molecular agents. Nat. Nanotechnol. 2009;4:688–694. doi: 10.1038/nnano.2009.231. [DOI] [PMC free article] [PubMed] [Google Scholar]
- 39.Zharov V.P. Ultrasharp nonlinear photothermal and photoacoustic resonances and holes beyond the spectral limit. Nat. Photonics. 2011;5:110–116. doi: 10.1038/nphoton.2010.280. [DOI] [PMC free article] [PubMed] [Google Scholar]
- 40.Zharov V.P., Vesnin Sergey G., Suen James Y., Harms Steven E. Photothermal/microwave radiometry for imaging and temperature feedback. Proc. SPIE. 2002;4618:163–173. [Google Scholar]
- 41.Zharov V. Confocal photothermal flow cytometry in vivo. Proc. SPIE. 2005;5697:15–26. [Google Scholar]
- 42.Moreau J., Loriette V. Confocal thermal-lens microscope. Opt. Lett. 2004;29:1488–1490. doi: 10.1364/ol.29.001488. [DOI] [PubMed] [Google Scholar]
- 43.Moreau J., Loriette V. Confocal dual-beam thermal-lens microscope: model and experimental results. Jpn. J. Appl. Phys. 2006;45:7141–7151. [Google Scholar]
- 44.Zubovych I.O., Straud S., Roth M.G. Mitochondrial dysfunction confers resistance to multiple drugs in Caenorhabditis elegans. Mol. Biol. Cell. 2010;21:956–969. doi: 10.1091/mbc.E09-08-0673. [DOI] [PMC free article] [PubMed] [Google Scholar]
- 45.Dalby B., Cates S., Ciccarone V.C. Advanced transfection with Lipofectamine 2000 reagent: primary neurons, siRNA, and high-throughput applications. Methods. 2004;33:95–103. doi: 10.1016/j.ymeth.2003.11.023. [DOI] [PubMed] [Google Scholar]
- 46.Galanzha E.I., Shashkov E.V., Zharov V.P. In vivo, noninvasive, label-free detection and eradication of circulating metastatic melanoma cells using two-color photoacoustic flow cytometry with a diode laser. Cancer Res. 2009;69:7926–7934. doi: 10.1158/0008-5472.CAN-08-4900. [DOI] [PMC free article] [PubMed] [Google Scholar]
- 47.Kaur J., Hill H.Z. Transfection of nonmelanocytic cells with tyrosinase gene constructs for survival studies. Environ. Mol. Mutagen. 2001;38:216–222. doi: 10.1002/em.1074. [DOI] [PubMed] [Google Scholar]
- 48.Nedosekin D.A., Shashkov E.V., Zharov V.P. Photothermal multispectral image cytometry for quantitative histology of nanoparticles and micrometastasis in intact, stained and selectively burned tissues. Cytometry A. 2010;77:1049–1058. doi: 10.1002/cyto.a.20977. [DOI] [PMC free article] [PubMed] [Google Scholar]
- 49.Westekemper H., Karimi S., Grabellus F. Expression of MCSP and PRAME in conjunctival melanoma. Br. J. Ophthalmol. 2010;94:1322–1327. doi: 10.1136/bjo.2009.167445. [DOI] [PubMed] [Google Scholar]
- 50.Bernfield M., Götte M., Zako M. Functions of cell surface heparan sulfate proteoglycans. Annu. Rev. Biochem. 1999;68:729–777. doi: 10.1146/annurev.biochem.68.1.729. [DOI] [PubMed] [Google Scholar]
- 51.Ma J., Lin J.Y., Frank M.H. Isolation of tumorigenic circulating melanoma cells. Biochem. Biophys. Res. Commun. 2010;402:711–717. doi: 10.1016/j.bbrc.2010.10.091. [DOI] [PMC free article] [PubMed] [Google Scholar]
- 52.Price J.E., Tarin D., Fidler I.J. Influence of organ microenvironment on pigmentation of a metastatic murine melanoma. Cancer Res. 1988;48:2258–2264. [PubMed] [Google Scholar]
- 53.Moerner W.E., Bjorklund G.C. Springer-Verlag; Heidelberg, New York: 1988. Persistent Spectral Hole-Burning: Science and Applications. [Google Scholar]
- 54.Davis B.O., Jr., Anderson G.L., Dusenbery D.B. Total luminescence spectroscopy of fluorescence changes during aging in Caenorhabditis elegans. Biochemistry. 1982;21:4089–4095. doi: 10.1021/bi00260a027. [DOI] [PubMed] [Google Scholar]
- 55.Goldstein S., Korczack L.B. Status of mitochondria in living human fibroblasts during growth and senescence in vitro: use of the laser dye rhodamine 123. J. Cell Biol. 1981;91:392–398. doi: 10.1083/jcb.91.2.392. [DOI] [PMC free article] [PubMed] [Google Scholar]
- 56.Kikis E.A., Gidalevitz T., Morimoto R.I. Protein homeostasis in models of aging and age-related conformational disease. Adv. Exp. Med. Biol. 2010;694:138–159. doi: 10.1007/978-1-4419-7002-2_11. [DOI] [PMC free article] [PubMed] [Google Scholar]
- 57.David D.C., Ollikainen N., Kenyon C. Widespread protein aggregation as an inherent part of aging in C. elegans. PLoS Biol. 2010;8:e1000450. doi: 10.1371/journal.pbio.1000450. [DOI] [PMC free article] [PubMed] [Google Scholar]
- 58.Leitz G., Fällman E., Axner O. Stress response in Caenorhabditis elegans caused by optical tweezers: wavelength, power, and time dependence. Biophys. J. 2002;82:2224–2231. doi: 10.1016/S0006-3495(02)75568-9. [DOI] [PMC free article] [PubMed] [Google Scholar]
- 59.Ayyadevara S., Alla R., Shmookler Reis R.J. Remarkable longevity and stress resistance of nematode PI3K-null mutants. Aging Cell. 2008;7:13–22. doi: 10.1111/j.1474-9726.2007.00348.x. [DOI] [PubMed] [Google Scholar]
- 60.Halestrap A.P., Woodfield K.-Y., Connern C.P. Oxidative stress, thiol reagents, and membrane potential modulate the mitochondrial permeability transition by affecting nucleotide binding to the adenine nucleotide translocase. J. Biol. Chem. 1997;272:3346–3354. doi: 10.1074/jbc.272.6.3346. [DOI] [PubMed] [Google Scholar]
- 61.Ntziachristos V. Going deeper than microscopy: the optical imaging frontier in biology. Nat. Methods. 2010;7:603–614. doi: 10.1038/nmeth.1483. [DOI] [PubMed] [Google Scholar]
- 62.Nedosekin D.A., Sarimollaoglu M., Zharov V.P. Ultra-fast photoacoustic flow cytometry with a 0.5 MHz pulse repetition rate nanosecond laser. Opt. Express. 2010;18:8605–8620. doi: 10.1364/OE.18.008605. [DOI] [PMC free article] [PubMed] [Google Scholar]
- 63.Wu S., Dovichi N.J. Fresnel diffraction theory for steady-state thermal lens measurements in thin films. J. Appl. Phys. 1990;67:1170–1182. [Google Scholar]
- 64.Joshi P.R., Dada O.O., Bialkowski S.E. Pulsed laser excited photothermal lens spectrometry of cadmium sulfoselenide doped silica glasses. J Phys: Conf Ser. 2010;214:012117. doi: 10.1366/000370209788700982. [DOI] [PubMed] [Google Scholar]
- 65.Brusnichkin A.V., Nedosekin D.A., Zharov V.P. Photothermal lens detection of gold nanoparticles: theory and experiments. Appl. Spectrosc. 2007;61:1191–1201. doi: 10.1366/000370207782597175. [DOI] [PubMed] [Google Scholar]
- 66.Prahl, S. 2011. Optical Absorption of Hemoglobin. http://omlc.ogi.edu/spectra/hemoglobin/.
Associated Data
This section collects any data citations, data availability statements, or supplementary materials included in this article.