Abstract
Ectonucleotide pyrophosphate phosphodiesterase (ENPP1) has been shown to negatively modulate insulin receptor and to induce cellular insulin resistance when overexpressed in various cell types. Systemic insulin resistance has also been observed when ENPP1 is overexpressed in multiple tissues of transgenic models and attributed largely to tissue insulin resistance induced in skeletal muscle and liver. Another key tissue in regulating glucose and lipid metabolism is adipose tissue (AT). Interestingly, obese patients with insulin resistance have been reported to have increased AT ENPP1 expression. However, the specific effects of ENPP1 in AT have not been studied. To better understand the specific role of AT ENPP1 on systemic metabolism, we have created a transgenic mouse model (C57/Bl6 background) with targeted overexpression of human ENPP1 in adipocytes, using aP2 promoter in the transgene construct (AdiposeENPP1-TG). Using either regular chow or pair-feeding protocol with 60% fat diet, we compared body fat content and distribution and insulin signaling in adipose, muscle, and liver tissues of AdiposeENPP1-TG and wild-type (WT) siblings. We also compared response to intraperitoneal glucose tolerance test (IPGTT) and insulin tolerance test (ITT). Our results show no changes in Adipose ENPP1-TG mice fed a regular chow diet. After high-fat diet with pair-feeding protocol, AdiposeENPP1-TG and WT mice had similar weights. However, AdiposeENPP1-TG mice developed fatty liver in association with changes in AT characterized by smaller adipocyte size and decreased phosphorylation of insulin receptor Tyr1361 and Akt Ser473. These changes in AT function and fat distribution were associated with systemic abnormalities of lipid and glucose metabolism, including increased plasma concentrations of fatty acid, triglyceride, plasma glucose, and insulin during IPGTT and decreased glucose suppression during ITT. Thus, our results show that, in the presence of a high-fat diet, ENPP1 overexpression in adipocytes induces fatty liver, hyperlipidemia, and dysglycemia, thus recapitulating key manifestations of the metabolic syndrome.
Keywords: ectonucleotide pyrophosphate phosphodiesterase, transgenic mice, fatty liver
excessive caloric intake and fat deposition is a common cause of adipose tissue dysfunction that leads to a clustering of systemic metabolic changes identifiable in the metabolic syndrome (22) and to the associated increased risk for both type 2 diabetes and cardiovascular disease (CVD).
Among the complex changes occurring in metabolic syndrome, ectopic fat deposition (particularly fatty liver) is increasingly recognized as causative of changes in lipid and glucose metabolism, which in turn leads to type 2 diabetes and CVD (6, 7). These changes are induced by positive caloric balance and obesity. However, it has become increasingly clear that several groups of people are “metabolically obese” even when body mass index (BMI) and waist circumference are not increased (23). The opposite is also true, and obese people may be found to have mild or no metabolic abnormalities associated with the metabolic syndrome and to maintain low risk for type 2 diabetes and CVD (18). Although fat distribution with predominant abdominal deposition can account for some of these clinical observations, an alternative explanation can be found in variability of overall functional capacity of adipose tissue as a “buffer” of excessive caloric intake. In other words, if storage capacity of adipose tissue is low, as it happens in its extreme manifestation in patients with lipodystrophy (13), fatty liver, and metabolic syndrome, and its consequences will be present at low body weight and with no or minimal increase in adipose tissue mass, including abdominal adipose tissue. If storage capacity is high, then obesity (or even morbid obesity) can be compatible with no fatty liver and no systemic metabolic abnormalities (18, 28). Recent research in various laboratories has focused on identifying mechanisms of reduced triglyceride storage capacity of adipose tissue. Among those, we have reported previously on the effects of ectonucleotide pyrophosphate phosphodiesterase (ENPP1) overexpression in adipocytes (17).
ENPP1 is a class II transmembrane glycoprotein that belongs to the ENPP family of enzymes known to hydrolyze 5′-phosphodiester bonds in nucleotides (11). ENPP1 also modulates insulin action by physical interaction with the α-subunit of the insulin receptor and inhibition of β-subunit activation (12, 13, 19). Interestingly, increased expression of ENPP1 in adipose tissue of insulin-resistant subjects has been reported previously (10). However, the specific effects of adipose tissue ENPP1 on systemic lipid and glucose metabolism are not yet known. Previous transgenic models have demonstrated systemic insulin resistance with ENPP1 overexpression in multiple tissues (except adipose), and the effects are attributed largely to insulin resistance induced in skeletal muscle and liver (20). In this study, we turned our attention to the specific effects of ENPP1 overexpression in mature adipocytes.
On the basis of the above observations, we have hypothesized that ENPP1 overexpression in adipocytes is an important mechanism of adipose tissue dysfunction leading to adipocyte insulin resistance, reduced triglyceride storage capacity, fat deposition in ectopic tissues (including liver), and systemic manifestations of the metabolic syndrome. In support of our hypothesis, this study addresses the “in vivo” effects of ENPP1 overexpression in adipocytes using the adipose ENPP1 transgenic (AdiposeENPP1-TG) mice, a murine model obtained with targeted overexpression of human ENPP1 in adipocytes using the aP2 promoter in the transgenic construct.
MATERIALS AND METHODS
Animals.
Transgenic mice were produced by the University of Texas Southwestern (UTSW) Transgenic Core Laboratory using a C57Bl/6J background. The transgene was constructed using the human ENPP1 cDNA from Dr. Vincenzo Trischitta (Sapienza University of Rome, Italy), a 5.4-kb region of the mouse aP2 promoter/enhancer from Dr. Bruce Spiegelman (Dana Farber Cancer Institute), and the pSTEC-1 vector containing restriction sites for promoter and cDNA insertion, an intron, and SV40 polyA sequences from Dr. C. D. Sigmund (University of Iowa). A c-myc epitope tag was added to the amino terminus located in the intracellular domain of ENPP1. The sequence of the final transgene was confirmed in both directions. The transgene was transmitted in the expected Mendelian ratios, and litter sizes were normal, indicating that it does not impede normal mouse fertility or embryo development. All transgenic mice used in this study were male and obtained by crossing a male transgenic from a single colony with a C57Bl/6J female. Multiple generations of transgenic mice have been used for the various protocols of this study, and stable gene expression has been confirmed with RT-PCR and protein quantification. Mice were housed in the animal facility at UTSW, where the experiments were initiated, and subsequently at UT Medical Branch (UTMB) in Galveston, TX, where the experiments were completed. The Institutional Animal Care Boards of both UTSW and UTMB approved the study protocol.
Diet.
After weaning, male mice were assigned to groups based on the presence or absence of the ENPP1 transgene. Different diets were started at 8 wk of age to conduct experiments with free access to food and also experiments with pair-feeding design. For the “ad libitum” diet experiments each group had free access to water and standard chow (4% fat by calories, Teklad 7001; Teklad, Madison, WI) or high-fat chow (60% fat by calories; Research Diets D12492, New Brunswick, NJ). For the pair-feeding experiments, a quantity of high-fat chow was chosen for the wild-type (WT) mice based on the intake recorded in the transgenic mice the day before.
Tissue collection.
After mice were euthanized, blood, epididymal adipose tissue, skeletal muscle, and liver tissue were obtained and stored at −80°C. About 5 mg of tissues was fixed in formalin for histology.
mRNA quantification.
Total RNA was isolated from frozen tissues using RNA STAT-60 (Tel-Test, Friendswood, TX). Genomic DNA was removed from the total RNA preparations using DNAse 1 (DNA Free; Ambion). RNA from each sample was diluted to 5 ng/μl, and 100 ng of RNA was reverse-transcribed in a 100-μl reaction using random hexamers (TaqMan Reverse Transcription kit; Applied Biosystems). To produce cDNA for standard curves, RNA from each of the control samples was pooled and serially diluted before cDNA synthesis. Each PCR reaction contained 2 μl of cDNA, 150 nM each of forward and reverse primers, and 5 μl of SYBR Green Universal PCR Master Mix (Applied Biosystems). Thermal cycling and data collection were performed using the ABI Prism 7900HT instrument (Applied Biosystems). Data were analyzed using SDS version 2.2 software (Applied Biosystems). Relative quantification of gene expression was by the comparative cycle threshold (CT) method (User Bulletin No. 2; Applied Biosystems). Cyclophilin mRNA was the endogenous control for total RNA content. Primers were designed using Primer Express version 2.0 (Applied Biosystems) and synthesized by Integrated DNA Technologies. Amplification efficiency of each primer set was determined by analyzing the slope of the standard curve (User Bulletin No. 2; Applied Biosystems).
Oil Red O staining.
Liver tissues were fixed with 10% formalin in PBS for 15 min and stained for ≥1 h in freshly diluted Oil Red O solution (6 parts Oil Red O stock solution and 4 parts H2O; Oil Red O stock solution is 0.5% Oil Red O in isopropanol). The stain was then removed, and the cells were washed twice with water with or without counterstain (0.25% giemsa for 15 min) and then photographed.
Immunoblot analysis.
Tissue was homogenized with a Potter-Elvehjem pestle in RIPA buffer for ENPP1 immunoblot analysis or cell lysis buffer (Cell Signaling Technology, Danvers, MA) for other proteins, added with 1 mM PMSF, 1× protease inibitor cocktail(Sigma), and phosphatase inibitor cocktail (Sigma). Proteins were separated by SDS-PAGE, transferred to a nitrocellulose membrane (Bio-Rad), and incubated overnight with the antibody. Tyr1361 phospho-insulin receptor antibody (Sigma-Aldrich), insulin Receptor antibody (BD Bioscience, San Jose, CA), c-myc antibody (Cell Signaling Technology, Danvers, MA), AKT and serine 473 phospho-AKT (Cell Signaling Technology), murine ENPP1 (Cell Signaling Technology), and human ENPP1 antibody (Imgenex, San Diego, CA) were available commercially.
Body composition and indirect calorimetry measurements.
Body composition was measured by magnetic resonance imaging (MRI) using an Echo MRI apparatus (Echo Medical Systems, Houston, TX). For indirect calorimetry measurements, animals were housed individually in metabolic chambers maintained at 20–22°C on a 12:12-h light-dark cycle with lights on at 0700. Metabolic measurements (oxygen consumption, respiratory exchange ratio, and locomotor activity) were obtained continuously using an open-circuit indirect calorimetry Comprehensive Laboratory Animal Monitoring System (Columbus Instruments, Columbus, OH). Mice were provided with the standard chow diet mentioned above and tap water ad libitum. Presented results contain data collected for a period of 8 days following 3 days of adaptation to the metabolic cages. For food intake measurements, mice were housed individually, and food was weighed each day at noon for 7 days. Food intake is expressed as the grams of food ingested per gram of body weight.
Liver triglyceride measurements.
Triglycerides were extracted from frozen liver tissues (200 mg), as described by Folch et al. (8). Triacylglycerol content was assayed using the GPO-Trinder Sigma kit (Sigma-Aldrich). Hepatic lipids were also quantitated using TLC separation followed by gas chromatographic quantitation. For this method, liver tissue was pulverized under liquid nitrogen, and ∼20–50 mg tissue/reaction was weighed and used. The samples were vortexed with 3 ml of extraction solution [1:2 (vol/vol) methanol-chloroform containing 0.05 mg/ml butylated hydroxytoluene] and appropriate volumes of internal standards and left overnight to allow further extraction of the lipids. The next day, the samples were centrifuged at 3,500 rpm for 30 min at 4°C. The supernatant was collected and dried under gentle nitrogen flow. The lipids in the tubes were redissolved in 50 μl of chloroform-methanol (2:1 vol/vol) spotted on TLC plates and separated using the solvent mixture heptane-ethyl ether-acetic acid [70:30:1 (vol/vol)]. After the run the plates were sprayed with primuline solution, and the lipid spots were detected under the UV lamp with a wavelength of 365 nm. The spots corresponding to triacylglycerols and diacylglycerols were scrapped into separate tubes and dissolved in 50 μl of hexane and 1 ml of 14% BF3-CH3OH by vortex and then heated at 100°C for 4 min and then cooled on ice. Then, 1 ml of ddH2O and 2 ml of hexane were added into each tube, and the samples were shaken for 15 min and centrifuged for 15 min at 2,000 rpm; the upper phase was removed and dried under gentle nitrogen flow. The lipids were redissolved in 50–100 μl of heptanes and analyzed using GC-FID.
Quantitation of adipocyte size.
Tissue sections from epididymal and mesenteric adipose tissue were stained with hematoxylin and eosin. Adobe Photoshop CS3 extended and Adobe Extendscript Toolkit 2 softwares were used to measure adipocyte area, which is represented as the average adipocyte area (in μm2). Adipocyte size was measured from five mice per genotype (>500 cells/genotype).
Intraperitoneal glucose tolerance test.
Glucose was administered by intraperitoneal injection at a dose of 1 g/kg body wt following a 5-h fast. Blood samples were obtained via the tail vein at baseline and 15, 30, 60, 90, and 120 min after intraperitoneal glucose injection. Blood glucose levels were measured using an Ascensia glucometer (Bayer). Insulin was measured from plasma obtained at time 0, 15, 30, 60, 90 and 120 min during intraperitoneal glucose tolerance test (IPGTT). Ultra Sensitive Mouse Insulin ELISA Kit (cat. no. 90080; Crystal Chem, Downers Grove, IL) was used for insulin measurement.
Insulin tolerance test.
After a 5-h fast, mice had 0.5 U/kg body wt regular insulin injected intraperitoneally. Blood glucose was measured at baseline and at 30-min intervals for 2 h using an Ascensia glucometer (Bayer).
Biochemical quantitations.
Plasma glucose concentration was assayed using a glucose oxidase method. The plasma concentrations of free fatty acids were measured by enzymatic colorimetric assay (Roche Diagnostics, Mannheim, Germany). Plasma triglycerides were measured using the GPO-Trinder Sigma kit (Sigma-Aldrich). Insulin was assayed using Ultra Sensitive Mouse Insulin ELISA Kit (cat. no. 90080; Crystal Chem). Leptin, adiponectin, resistin, and TNFα were measured using commercially available multiplex immunoassays (Millipore, Billerica, MA).
Statistics.
Data were analyzed using SAS version 9.2 (SAS Institute, Cary, NC) and are presented as means ± SD. Because of skewness, plasma triglyceride and fatty acid were log-transformed prior to analysis. A two-tailed Student t-test was used for group comparison where appropriate. One-way ANOVA followed by least square contrast of the ANOVA model was used for multiple comparisons. Significance was defined as P < 0.05.
RESULTS
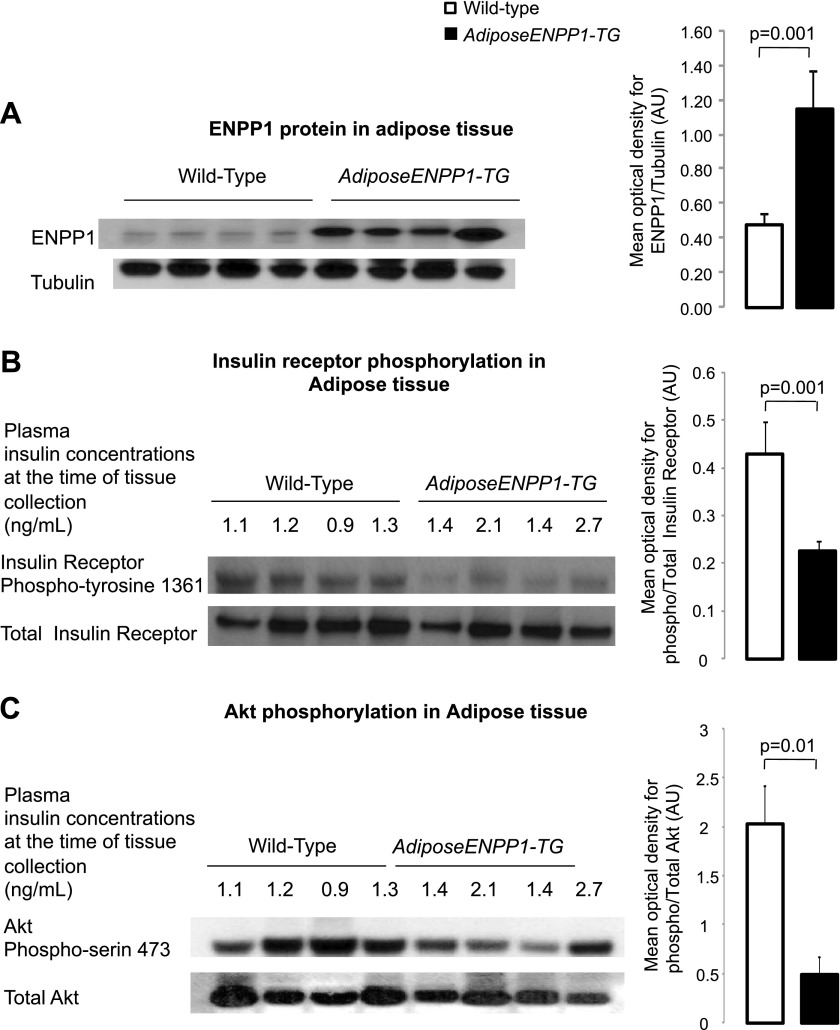
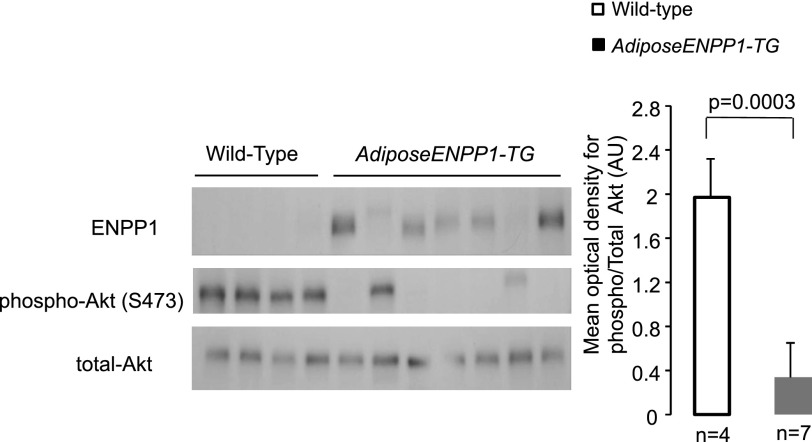
ENPP1 was elevated about threefold in white adipose tissue of the AdiposeENPP1-TG mice (Fig. 1A). The increase in adipose ENPP1 protein was associated with reduced phosphorylation of the insulin receptor Tyr1361 and Akt Ser473 in the presence of comparable plasma insulin concentrations at the time of tissue collection after 5 h of fasting (Fig. 1, B and C). Decreased insulin signaling activation in the AdiposeENPP1-TG was confirmed during hyperinsulinemia induced by the intraperitoneal administration of insulin at a dose of 0.5 U/kg body wt. Figure 2 shows decreased Akt phosphorylation in the adipose tissue of AdiposeENPP1-TG mice compared with the WT both fasting and after 30 min from insulin injection. Interestingly, variability in the transgenic protein content was proportionate to the variability in Akt phosphorylation even within the AdiposeENPP1-TG group.
Fig. 1.
A: representative Western blot using antibodies against murine (endogenous) ectonucleotide pyrophosphate phosphodiesterase (ENPP1) protein at 110 kDa in epididymal adipose tissue of adipose ENPP1 transgenic (AdiposeENPP1-TG) mice and wild-type littermates after 60% fat diet with pair-feeding protocol. The optical density is expressed in arbitrary units (AU) as means ± SD for each study group. B: representative Western blot for total and phospho-insulin receptor Tyr1361 (95 kDa) in adipose tissue. C: representative Western blot for total and phospho-Akt Ser473 (60 kDa) in adipose tissue. Tissue was collected after food was withheld for 5 h. Fasting plasma insulin concentrations, at the time of adipose tissue collection, are also shown.
Fig. 2.
Adipose tissue was collected from 7 AdiposeENPP1-TG mice and 4 wild-type mice 30 min after intraperitoneal insulin injection at a dose of 0.5 U/kg body wt. All mice were studied after being exposed to 12 wk of a 60% fat diet with pair-feeding protocol. The Western blots show ENPP1 protein and Akt phosphorylation in each animal. The mean optical density and SD for phospho/total Akt Ser473 (60 kDa) is shown in the bar graph for the 2 study groups.
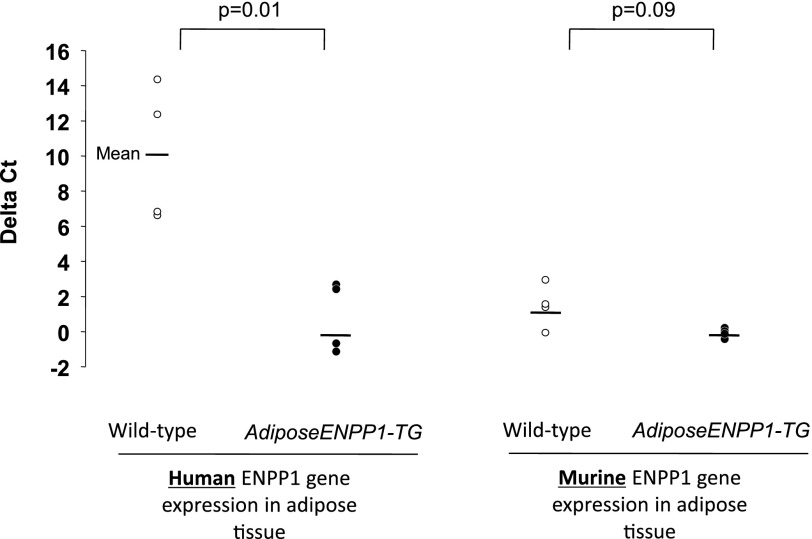
Cross-reactivity of the murine antibody with human ENPP1 can account for the differences in ENPP1 protein content between the two mice groups. To confirm that increased ENPP1 protein in adipose was attributable to the human transgene, we evaluated differences in human and murine ENPP1 gene expression in adipose tissue of the two mice groups. Figure 3 shows that RT-PCR results in epididymal adipose tissue, using primers designed for human and murine ENPP1. These primers had no cross-reactivity. Only AdiposeENPP1-TG mice were found to have human ENPP1 expression, whereas the endogenous ENPP1 expression was comparable with that of WT littermates.
Fig. 3.
RT-PCR was performed in epididymal adipose tissue of the same AdiposeENPP1-TG mice and wild-type littermates, using specific primers for human and murine ENPP1. Results are reported as ΔCT (cycle threshold), using cyclophilin as reference gene.
AdiposeENPP1-TG and WT littermates had similar body weights at week 24 if exposed to regular chow diet (Table 1). However, when exposed to high fat diet (60% fat), the transgenic mice had lower weight than the WT (P = 0.02), and food intake was also lower (P < 0.0001). Therefore, a pair-feeding protocol was followed to compare the studied variables while minimizing differences in body weight between the AdiposeENPP1-TG and the WT littermates.
Table 1.
AdiposeENPP1-TG and wild-type littermate mice were given either regular chow diet or diet containing 60% fat without food quantity restrictions (“ad libitum”)
| Wild-type | AdiposeENPP1-TG | P Value | |
|---|---|---|---|
| Regular chow diet (“ad libitum”) | |||
| Weight | |||
| Week 8 | 26.6 ± 1.6 | 25.9 ± 0.6 | 0.3 |
| Week 16 | 31.4 ± 2.8 | 27.2 ± 2.3 | 0.08 |
| Week 24 | 37.3 ± 2.9 | 33.9 ± 2.5 | 0.2 |
| Food intake | |||
| Week 8 | 3.9 ± 0.1 | 3.8 ± 0.08 | 0.8 |
| Week 16 | 4.0 ± 0.2 | 3.9 ± 0.1 | 0.6 |
| Week 24 | 3.8 ± 0.1 | 3.6 ± 0.2 | 0.3 |
| 60% fat diet (“ad libitum”) | |||
| Weight | |||
| Week 8 | 26.9 ± 0.7 | 27.1 ± 1.4 | 0.7 |
| Week 16 | 41.4 ± 6.8 | 36.5 ± 3.6 | 0.09 |
| Week 24 | 48.4 ± 5.8 | 42.2 ± 5.2 | 0.02 |
| Food intake | |||
| Week 8 | 2.8 ± 0.5 | 2.0 ± 0.2 | 0.0007 |
| Week 16 | 2.8 ± 0.3 | 2.2 ± 0.4 | 0.002 |
| Week 24 | 2.5 ± 0.07 | 1.9 ± 2.5 | <0.0001 |
The results are reported as group means ± SD and are in g for each dietary period; each animal (n = 5 for each group) was weighed at different intervals. AdiposeENPP1-TG, adipose ectonucleotide pyrophosphate phosphodiesterase (ENPP1) transgenic mice. Week nos. indicate the no. of weeks from diet initiation. All mice were 10 wk old when started on specific diet. Student t-test was used for comparison within each diet group.
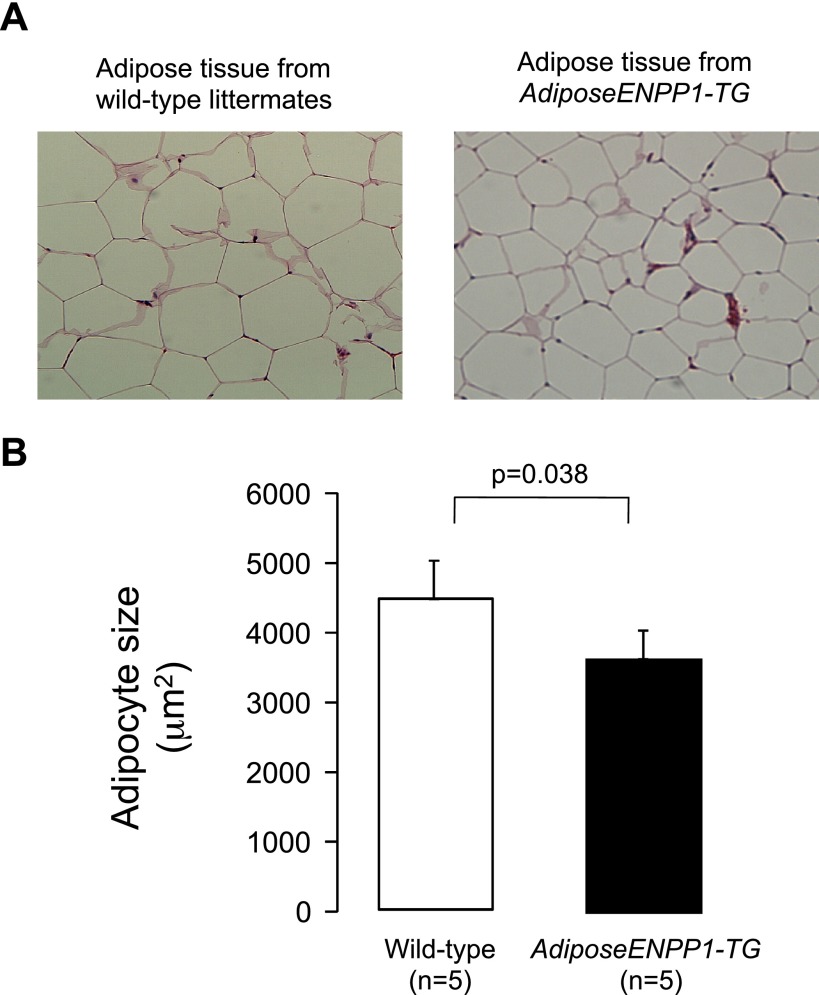
A group of pair-fed animals (60% fat diet) was used to perform calorimetric studies. These animals had similar body weights, total body fat, and organ weight for AdiposeENPP1-TG and WT littermates (Table 2). Furthermore, the food intake, oxygen consumption, respiratory exchange, and total locomotion were comparable. Despite similar adipose tissue mass (8 ± 3 and 9 ± 2 g for Adipose-TG and WT, respectively) we found that adipocyte size was significantly lower (P = 0.038) in the AdiposeENPP1-TG mice (Fig. 4).
Table 2.
A group of AdiposeENPP1-TG (n = 5) and a group of wild-type littermate mice (n = 5) underwent metabolic cage studies during last week of 14-wk feeding with 60% fat diet using pair-feeding protocol
| AdiposeENPP1-TG | Wild Type | P Value | |
|---|---|---|---|
| Body weight at age 20 wk, g | 32.3 ± 2.4 | 32.0 ± 2.4 | NS |
| Total body fat at age 20 wk, %body weight | 26.5 ± 3.3 | 26.2 ± 6.3 | NS |
| Epididymal fat weight, g | 1.4 ± 0.3 | 1.6 ± 0.5 | NS |
| Liver weight, g | 1.09 ± 0.10 | 1.09 ± 0.13 | NS |
| Heart weight, g | 0.17 ± 0.02 | 0.17 ± 0.02 | NS |
| Kidney weight, g | 0.33 ± 0.03 | 0.35 ± 0.02 | NS |
| Food intake, g/body weight | 0.18 ± 0.02 | 0.17 ± 0.02 | NS |
| Oxygen consumption, ml·h−1·kg−1 | 1,363 ± 105 | 1,445 ± 306 | NS |
| Respiratory exchange rate | 0.95 ± 0.00 | 0.96 ± 0.01 | NS |
| Total locomotion (ambulatory and rearing) | 5,364 ± 1,716 | 4,933 ± 1,343 | NS |
Data are means ± SD. NS, not significant. Body fat was measured using MRI after 5 h of fasting and soon before dissection for measurements of other organs at age 24 wk.
Fig. 4.
A: epididymal adipose tissue samples from wild-type and AdiposeENPP1-TG mice on 60% fat diet using pair-feeding protocol were stained with hematoxylin and eosin. B: median adipocyte size in AdiposeENPP1-TG mice and wild-type littermates. This group of mice was 24 wk old and had comparable total body fat content (body fat mass was 8 ± 3 g for the adipose-TG mice and 9 ± 2 g for the wild-type littermates).
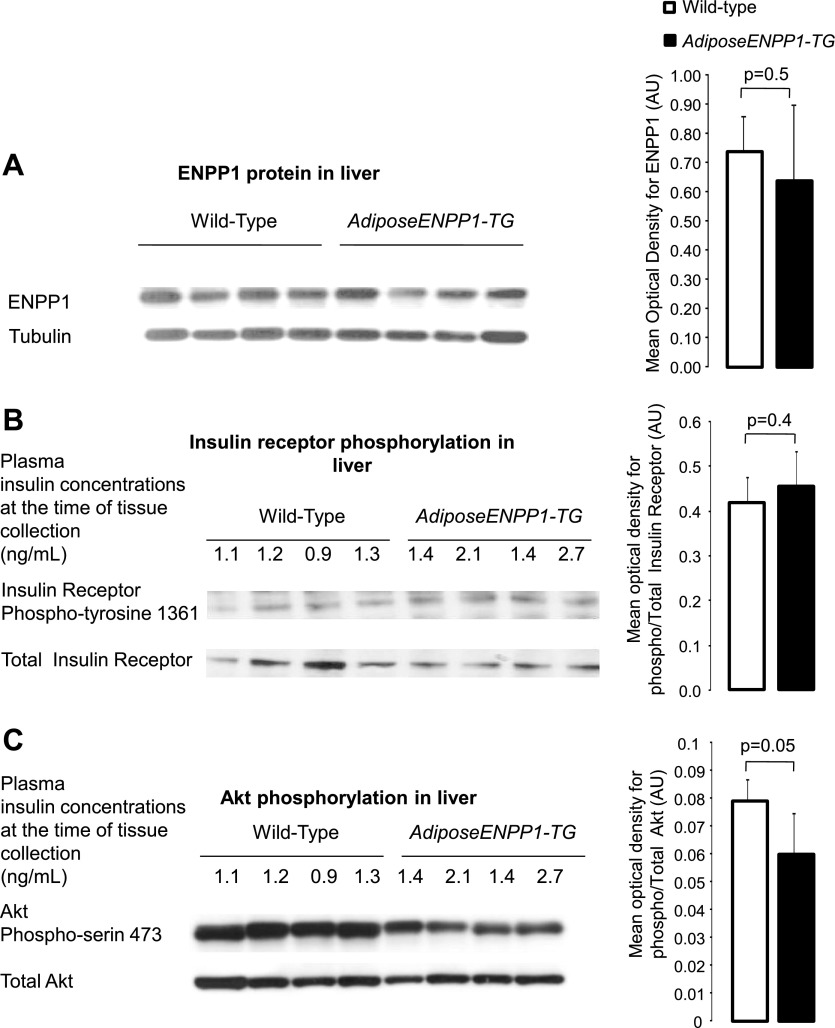
Figure 5 shows comparable ENPP1 protein content in the liver of AdiposeENPP1-TG and WT littermates. We did not find differences in the liver insulin receptor Tyr1361 phosphorylation between the two mice groups. However, Akt Ser473 phosphorylation was reduced by ∼30% in the liver of AdiposeENPP1-TG (P = 0.05).
Fig. 5.
A: representative Western blot using antibodies against murine (endogenous) ENPP1 protein at 110 kDa in liver of AdiposeENPP1-TG mice and wild-type littermates exposed to 12 wk of a 60% fat diet with pair-feeding protocol. The optical density is expressed in AU as means ± SD for each study group. B: representative Western blot for total and phospho-insulin receptor Tyr1361 (95 kDa) of liver. C: representative Western blot for total and phospho-Akt Ser473 (60 kDa). Tissue was collected after food was withheld for 5 h. Fasting plasma insulin concentrations, at the time of adipose tissue collection, are also shown in B and C.
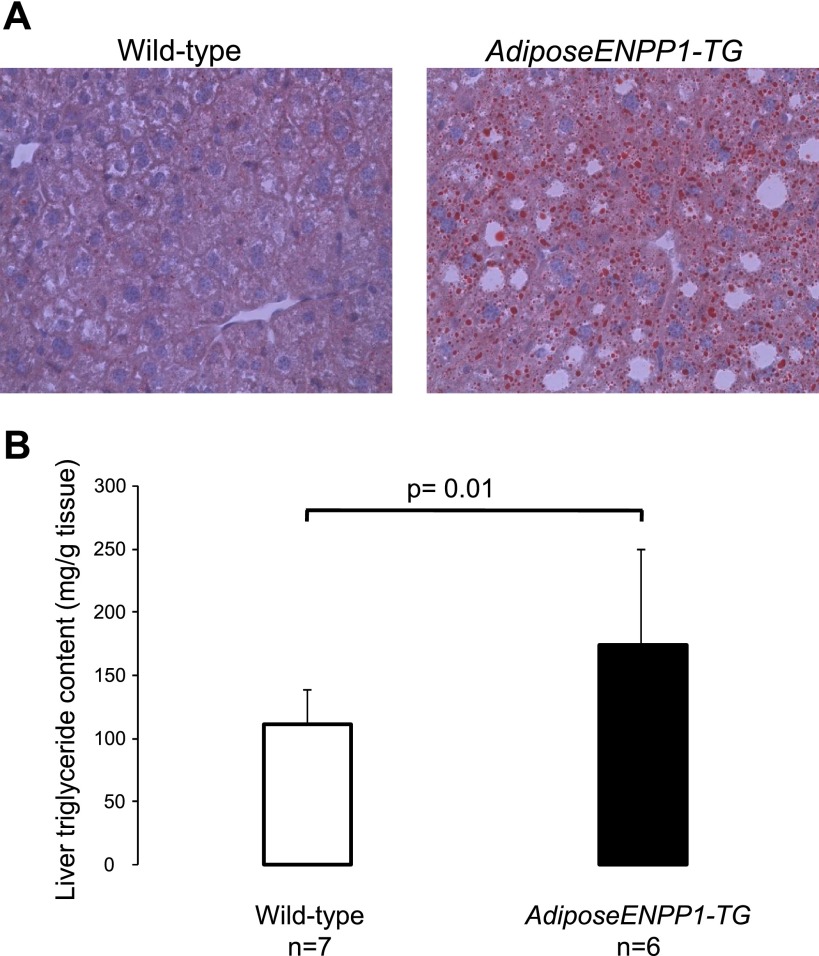
The liver of AdiposeENPP1-TG transgenic mice was found to be significantly enriched with triglycerides (Fig. 6). This finding was further confirmed in independent experiments using gas chromatographic quantitation after TLC separation (150 ± 7 and 100 ± 6 mg triglyceride/g tissue for 10 AdiposeENPP1-TG mice and 8 WT littermate mice, respectively, P = 0.02).
Fig. 6.
A: high-power view (×40 magnification) of an Oil Red O stain of liver from representative of an AdiposeENPP1-TG mouse and a wild-type littermate after 12 wk on a 60% fat diet with pair-feeding protocol. There are vacuolated hepatocytes containing microvesicular fat, which stain red in triglyceride liver specimen. B: means ± SD of liver fat content for each study group.
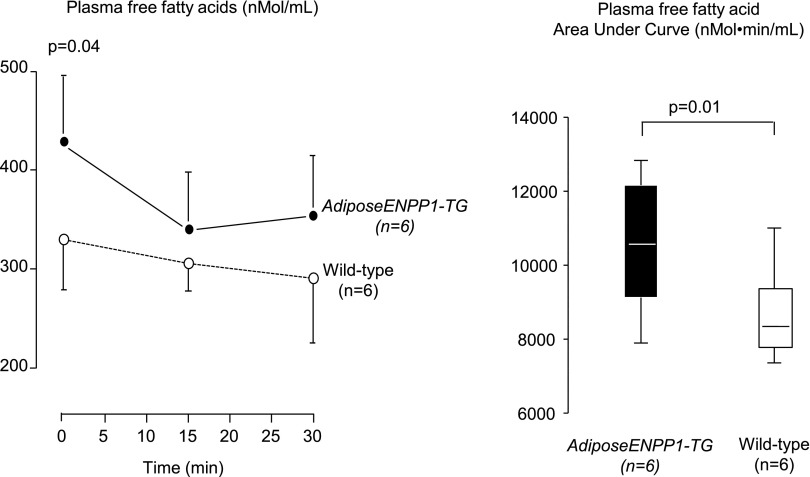
Figure 7 summarizes the results on plasma free fatty acids after 5 h of fasting and during the 30 min following intraperitoneal insulin administration at a dose of 5 U/kg body weight. The results show higher plasma fatty acids at baseline and incomplete suppression during hyperinsulinemia. The area under the curve for plasma fatty acids was significantly higher in the ENPP1-Adipose-TG mice (P = 0.01).
Fig. 7.
Plasma free fatty acids were measured after 5 h of food being withheld for the time 0 measurements. Plasma free fatty acids at times 15 and 30 min were measured after intraperitoneal insulin administration (0.5 U/kg). The calculated area under the curve is compared between the 2 study groups. AdiposeENPP1-TG mice and wild-type littermates were studied after being exposed to 12 wk of a 60% fat diet with pair-feeding protocol.
Figure 8 depicts results of systemic metabolic studies in groups of mice fed regular chow diet and in groups fed 60% fat diet using the pair-feeding protocol. Plasma glucose and insulin concentrations were similar in the two study groups on regular chow diet. However, the AdiposeENPP1-TG mice pair-fed with a 60% fat diet had higher plasma glucose (P < 0.05 at time points 30, 60, and 120 min) and insulin concentrations (P < 0.05 at time points 0 and 15 min) than the other three groups during IPGTT. Figure 8C shows that glucose suppression following insulin administration was decreased in the AdiposeENPP1-TG mice on a high-fat diet (P < 0.05 at time points 15–120 min from insulin administration). Possible mechanisms involved in the observed systemic effect of adipose tissue-specific ENPP1 overexpression are presented schematically in Fig. 9.
Fig. 8.
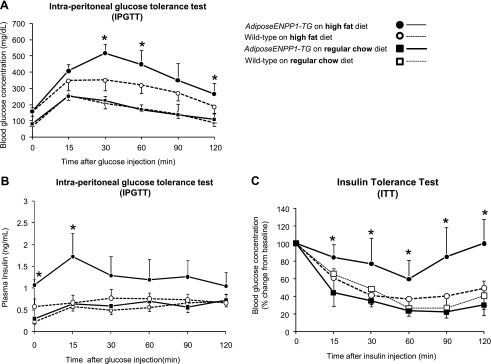
A: plasma glucose concentrations are shown at different time points during intraperitoneal glucose tolerance test (IPGTT) in 22-wk-old AdiposeENPP1-TG mice and wild-type littermates exposed to either regular chow or 60% fat diet for 12 wk. Each data point indicates means ± SD from n = 6 mice for each group. B: plasma insulin concentrations are shown at different time points during IPGTT as means ± SD. C: plasma glucose changes from baseline are reported at different time points during insulin tolerance test (ITT) as means ± SD. Insulin was injected in the intraperitoneum at the concentration of 0.5 U/kg body wt. *P < 0.05 vs. WT on high-fat diet and vs. groups on regular chow diet.
Fig. 9.
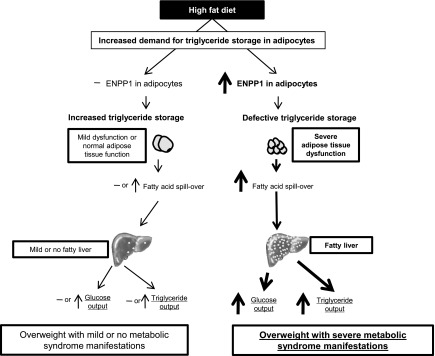
Schematic representation of the effects of ENPP1 on triglyceride storage in adipose tissue and its interaction with diet and weight gain as a determinant of fatty liver and other manifestations of the metabolic syndrome in the AdiposeENPP1-TG.
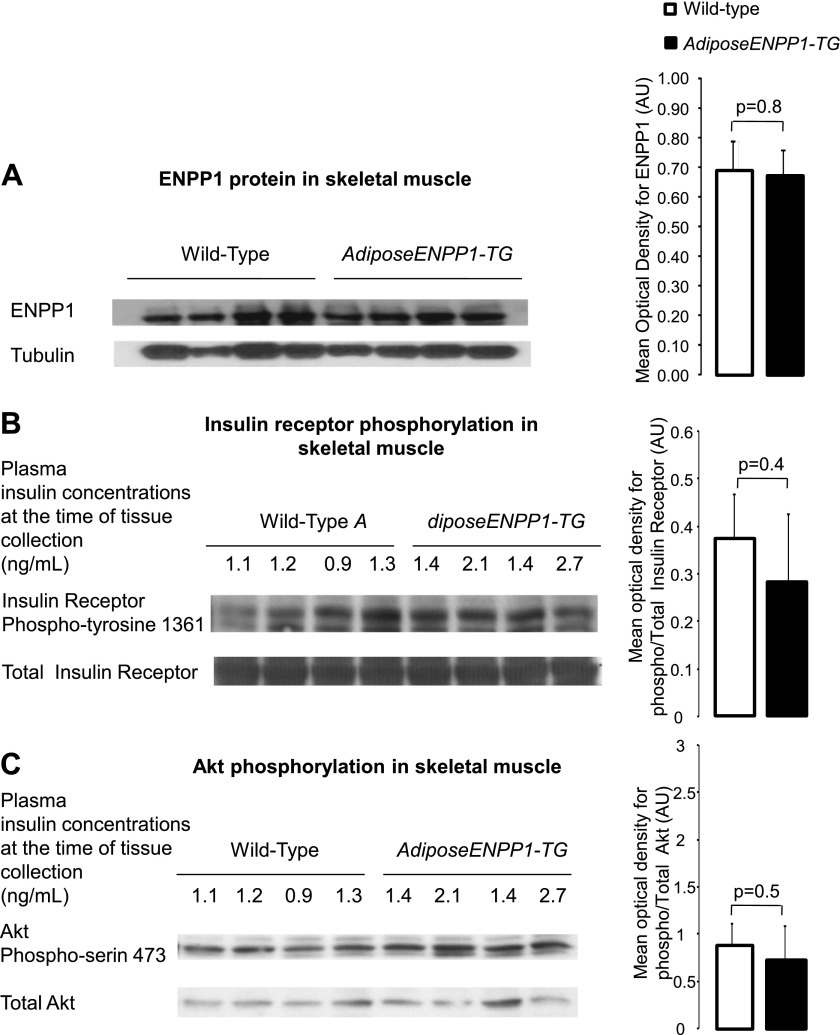
Of note, transgene expression was observed in white and brown adipose tissue and absent in other tissues relevant for systemic glucose and lipid metabolism (Fig. 10). Also, we failed to detect group differences for ENPP1 protein quantity, insulin signaling activation, and tissue fat content in the skeletal muscle (21 ± 11 and 20 ± 12 mg triglyceride/g tissue for AdiposeENPP1-TG and WT, respectively, P = 0.9; Fig. 11). Skeletal muscle diacylglycerol content was similar in the two study groups (data not shown).
Fig. 10.

The transgene construct for human ENPP1 includes aP2 promoter and c-myc tag. This is a representative Western blot with antibodies against c-myc recombinant ENPP1 protein in various tissues of AdiposeENPP1-TG mice. The recombinant protein is present in both white (WAT) and brown adipose tissue (BAT) but not in other tissues, including spleen and liver, that contain a significant number of macrophages.
Fig. 11.
A: representative Western blot using antibodies against murine (endogenous) ENPP1 protein at 110 kDa in muscle of AdiposeENPP1-TG mice and wild-type littermates exposed to 12 wk of a 60% fat diet with pair-feeding protocol. The optical density is expressed in AU as means ± SD for each study group. B: representative Western blot for total and phospho-insulin receptor Tyr1361 (95 kDa) of liver. C: representative Western blot for total and phospho-Akt Ser473 (60 kDa). Tissue was collected after food was withheld for 5 h. Fasting plasma insulin concentrations, at the time of adipose tissue collection, are also shown in B and C.
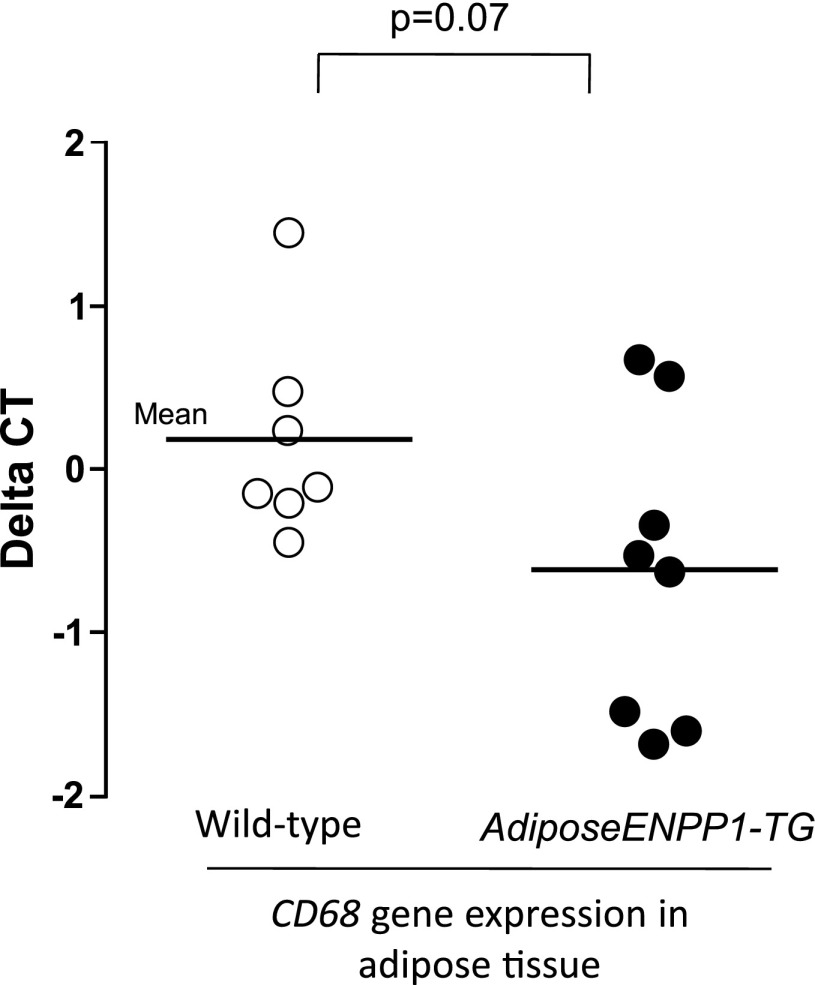
Table 3 summarizes plasma concentrations of lipids and adipokines. AdiposeENPP1-TG mice had increased plasma concentrations of fatty acids and triglycerides and decreased plasma concentrations of leptin. A trend toward lower plasma adiponectin concentrations did not reach statistical significance. Plasma concentrations of inflammatory adipokines IL-6 and TNFα were similar in the two study groups. Adipose tissue gene expression of inflammatory cytokines was also comparable (data not shown). However, there was a nonsignificant trend toward higher adipose tissue expression of CD68, a marker of increased macrophage recruiting (Fig. 12).
Table 3.
Plasma concentrations of lipids and adipose tissue metabolites in AdiposeENPP1-TG and their wild-type littermates after 12 wk of a 60% fat diet with pair-feeding protocol
| Variable | AdiposeENPP1-TG | Wild Type | P Value |
|---|---|---|---|
| Triglyceride, mg/dl | 116 ± 34 | 79 ± 11 | 0.03 |
| Free fatty acid, ng/ml | 110 ± 11 | 79 ± 8 | 0.02 |
| Adiponectin, mg/ml | 19 ± 5 | 23 ± 3 | 0.11 |
| Leptin, ng/ml | 31 ± 30 | 116 ± 10 | 0.05 |
| Resistin, ng/ml | 2.1 ± 0.9 | 2.5 ± 1.8 | 0.53 |
| PAI-1, ng/ml | 2.0 ± 1.3 | 2.3 ± 1.6 | 0.61 |
| IL-6, ng/ml | 12.9 ± 8.6 | 16.7 ± 17.9 | 0.40 |
| TNFα, ng/ml | 1.8 ± 1.9 | 2.7 ± 4.6 | 0.62 |
Data are reported as means ± SD. PAI-1, plasminogen activator inhibitor-1. Student t-test for independent variables was used for group comparison.
Fig. 12.
RT-PCR was performed in epididymal adipose tissue samples from 8 AdiposeENPP1-TG mice and 7 wild-type littermates exposed to 12 wk of a 60% fat diet with pair-feeding protocol. Results are reported as ΔCT, using cyclophilin as reference gene.
DISCUSSION
The findings of this study support the view that adipocyte ENPP1 can modulate the overall caloric “buffering” function of adipose tissue in the presence of excessive fat intake. As depicted in the schematic representation of Fig. 9, our results support the hypothesis that when storage demand is increased by high-fat feeding, ENPP1 overexpression in adipocytes of AdiposeENPP1-TG mice impairs the physiological increase in adipocyte size (triglyceride storage) we found in the WT siblings. This change in adipose tissue function likely reflects decreased triglyceride storage capacity in adipose tissue and appears to be a major cause of fatty liver and systemic changes in lipid and glucose metabolism commonly observed in the metabolic syndrome.
The possibility that ENPP1 would determine fatty liver and impact systemic glucose and lipid metabolism “in vivo” through an effect on adipocyte function had not been investigated previously. This gap in the literature is of importance in light of the observation that ENPP1 is often overexpressed in adipose tissue of insulin-resistant people (10). Of note, this previous study in humans included nonobese individuals, thus suggesting that ENPP1 overexpression is an early defect in the development of systemic insulin resistance independent of obesity.
Our mouse model provides information on the isolated effects of ENPP1-induced adipose tissue dysfunction on systemic handling of glucose and lipid metabolism. Although no systemic consequences of ENPP1 overexpression were found when diet did not demand triglyceride storage in adipose tissue (regular chow fed mice), AdiposeENPP1-TG mice on high-fat diets manifested fatty liver (Fig. 6).
Typically, fatty liver in obesity is associated with hyperinsulinemia and defective insulin signaling directed to hepatic glucose metabolism (4, 7, 21). However, insulin signaling directed to sterol regulatory element-binding protein-1c (SREBP-1c) activation has been described to be intact and upregulated by hyperinsulinemia, thus contributing to lipogenesis (3, 16, 26). This mechanism explains about 10% of “de novo” lipogenesis in obesity and insulin resistance (25) and up to 24% in human with fatty liver (5). Interestingly, our animal model was found to have diminished hepatic Akt phosphorylation even without changes in ENPP1 expression (Fig. 5C). In addition, no defective insulin receptor activation was measurable in the hepatocytes of these animals (Fig. 5B). Methodological problems related to insulin receptor phosphorylation quantification may have precluded us from finding small differences. On the other hand, postreceptor dysregulation could also be postulated. The reduction of hepatic Akt-phosphorylation of AdiposeENPP1-TG mice could determine defective insulin-mediated suppression of hepatic glucose output and contribute to the dysglycemia observed “in vivo” using IPGTT and insulin tolerance test (Fig. 8). Since decreased Akt phosphorylation would predict decreased SREBP-1c activations (3), fatty acid synthesis might not be significant contributor to the fatty liver of AdiposeENPP1-TG mice. As depicted in the schematic of Fig. 9, increased fatty acid “spillover” from adipose tissue could be a reasonable consequence of defective triglyceride storage. This would provide an important substrate for the liver to synthesize triglyceride. The concomitant changes in glucose metabolism may contribute to provide the additional substrate to promote the triglyceride synthesis in the liver of this animal model. However, the possibility that a yet-unidentified signal from adipose tissue to the liver may be a contributory mechanism cannot be excluded.
The possibility of such an adipocyte-secreted molecule has been postulated to explain the fatty liver phenotype of another model of fatty liver induced by adipocyte insulin resistance, the adipose Glut4-deficient mice (1). Similarly to our model, the decreased insulin-mediated glucose utilization in adipocytes of Glut4-deficient mice induces hepatic steatosis, hepatic insulin resistance, and systemic insulin resistance (1, 15). However, a major difference between the two models is the presence of increased plasma fatty acid in the AdiposeENPP1-TG mice and its absence in the adipose Glut4-deficient mice. Likely as the consequence of upstream adipocyte insulin resistance induced by the ENPP1 overexpression, increased baseline fatty acid and incomplete suppression during the hyperinsulinemia induced by the IPGTT (Fig. 8) would support our mechanistic hypothesis depicted in Fig. 9. The concept that adipocyte fatty acid handling plays a major role in hepatic insulin sensitivity and triglyceride deposition is supported further by the findings in adipose hormone-sensitive lipase-deficient mice (27). In that model, decreased lipolysis was shown to be associated with low plasma fatty acid, improved insulin sensitivity, and reduced triglyceride content in the liver.
Another important link between adipose tissue function, systemic insulin resistance, and hepatic insulin resistance/steatosis is production of inflammatory cytokines in adipose tissue. Adipose tissue inflammation has been reported to play a role in hepatic steatosis and insulin resistance in obesity. Mice lacking the Jnk1 gene in adipose tissue do not develop high-fat diet-induced inflammation of adipose tissue and do not develop systemic insulin resistance, hepatic insulin resistance, or fat deposition despite developing obesity (24). Similarly, mice with specific deficiency of Fas in adipose tissue have been shown to be protected from obesity-induced insulin resistance, liver insulin resistance, and steatosis (29). Fas is known to mediate inflammation in obesity, particularly in adipocytes, and contribute to adipose tissue inflammation and metabolic dysregulation. We found that the adipose tissue of AdiposeENPP1-TG mice has no significant increase in expression of genes involved in inflammation, such as IL-6 and TNFα. However, there was a trend toward increased expression of CD68, a marker of macrophage recruiting (Fig. 12). Because plasma concentrations of IL-6 and TNFα were not increased (Table 1), there is no evidence at this point for a role of adipose tissue inflammation in the pathogenesis of hepatic insulin resistance and steatosis of the AdiposeENPP1-TG mice. Interestingly, overexpression of adipose ENPP1 but not TNFα was found to be associated with whole body and adipose tissue insulin resistance in nonobese humans without diabetes (10).
The adipocyte insulin resistance induced by the ENPP1 overexpression in our model appears to be similar to the adipocyte-specific insulin receptor knockout model (adipose-IRKO or -FIRKO) regarding its effect on adipocyte size (2). Similarly to our model, the adipocytes of FIRKO mice remain small with higher caloric intake. However, FIRKO mice do not develop systemic insulin resistance. An explanation for these different responses to adipocyte insulin resistance can be found in the lack of excessive lipolysis in the FIRKO mice. FIRKO mice have been reported to have adipose tissue uncoupling protein 1 activation and increased energy expenditure during hyperphagia (2, 14). This metabolic response can account for a lack of increased plasma nonesterified fatty acids and determine the different systemic metabolic response to induced adipocyte insulin resistance. Understanding the mechanisms for the different effects of ENPP1-induced vs. insulin receptor knockout-induced insulin resistance in adipocytes may provide important insights into systemic regulation of glucose and lipid metabolism.
Of interest, we did not find increased triglyceride or diacylglycerol deposition, nor did we find any evidence of insulin-signaling defects in skeletal muscle (Fig. 11). These findings suggest that skeletal muscle utilization of glucose is intact and that the dysglycemia of AdiposeENPP1-TG mice is originating mainly from increased hepatic glucose production and decreased glucose uptake in adipose tissue. However, because gene expression studies, including hepatic phosphoenolpyruvate carboxykinase expression, have been thus far unrevealing (data not shown), further studies will be required to quantify hepatic glucose output in fasting conditions and during hyperinsulinemia to elucidate the mechanistic details for hyperglycemia in this model.
The similarities in metabolic changes observed between AdiposeENPP1-TG on a high-fat diet and patients with metabolic syndrome are supportive of a mechanistic role of adipose ENPP1 expression in increasing risk for type 2 diabetes by inducing adipose tissue insulin resistance and increasing fatty infiltration of the liver. As a consequence, more severe manifestations of the metabolic syndrome can be predicted even with mild increases in caloric intake and body fat mass, when ENPP1 is overexpressed in adipose tissue. Clearly, overexpression of ENPP1 in humans with insulin resistance is not exclusive of the adipose tissue, and the mechanisms involved in the ENPP1-related systemic metabolic changes are more complex than in the AdiposeENPP1-TG mouse. For example, decreased insulin receptor phosphorylation in concomitance with increased ENPP1 expression in skeletal muscle is not part of the AdiposeENPP1-TG mouse phenotype but can be found in nondiabetic, nonobese, insulin-resistant individuals (9). Regardless, the new animal model we report in this study can help to understand better the role of adipocyte insulin resistance vs. hypertrophy (not present in our model) and also the role of ENPP1 as a biomarker of increased susceptibility to type 2 diabetes and CVD independently of BMI or waist circumference. Our model could ultimately help identify novel intervention strategies to optimize adipocyte response to increased caloric demand and to reduce the risk for systemic metabolic complications of weight gain.
GRANTS
N. Abate and M. Chandalia are supported by National Institute of Diabetes and Digestive and Kidney Diseases Grant RO1-DK-072158. This work was in part supported by Grant 1-UL1-RR-029876 from the National Center for Research Resources, National Institutes of Health.
DISCLOSURES
No conflicts of interest, financial or otherwise, are declared by the authors.
Supplementary Material
ACKNOWLEDGMENTS
We thank Dr. Robert Hammer from the UTSW Core Laboratory and Dr. William Cook (now at Astra Zeneca) for creating the ENPP1 K121Q transgenic mice while at UTSW in Dallas, TX. We thank Dr. Vincenzo Trischitta, Sapienza University in Rome (Italy), for providing human ENPP1 K121Q cDNA. We acknowledge Thanalakshmi Seenivasan at UTSW and Suxia Yao at UTMB for technical support.
REFERENCES
- 1. Abel ED, Peroni O, Kim JK, Kim YB, Boss O, Hadro E, Minnemann T, Shulman GI, Kahn BB. Adipose-selective targeting of the GLUT4 gene impairs insulin action in muscle and liver. Nature 409: 729–733, 2001 [DOI] [PubMed] [Google Scholar]
- 2. Blüher M, Michael MD, Peroni OD, Ueki K, Carter N, Kahn BB, Kahn CR. Adipose tissue selective insulin receptor knockout protects against obesity and obesity-related glucose intolerance. Dev Cell 3: 25–38, 2001 [DOI] [PubMed] [Google Scholar]
- 3. Brown MS, Goldstein JL. Selective versus total insulin resistance: a pathogenic paradox. Cell Metab 7: 95–96, 2008 [DOI] [PubMed] [Google Scholar]
- 4. Bugianesi E, Gastaldelli A, Vanni E, Gambino R, Cassader M, Baldi S, Ponti V, Pagano G, Ferrannini E, Rizzetto M. Insulin resistance in non-diabetic patients with non-alcoholic fatty liver disease: sites and mechanisms. Diabetologia 48: 634–642, 2005 [DOI] [PubMed] [Google Scholar]
- 5. Donnelly KL, Smith CI, Schwarzenberg SJ, Jessurun J, Boldt MD, Parks EJ. Sources of fatty acids stored in liver and secreted via lipoproteins in patients with nonalcoholic fatty liver disease. J Clin Invest 115: 1343–1351, 2005 [DOI] [PMC free article] [PubMed] [Google Scholar]
- 6. Fabbrini E, Sullivan S, Klein S. Obesity and nonalcoholic fatty liver disease: biochemical, metabolic, and clinical implications. Hepatology 51: 679–689, 2010 [DOI] [PMC free article] [PubMed] [Google Scholar]
- 7. Fabbrini E, Magkos F, Mohammed BS, Pietka T, Abumrad NA, Patterson BW, Okunade A, Klein S. Intrahepatic fat, not visceral fat, is linked with metabolic complications of obesity. Proc Natl Acad Sci USA 106: 15430–15435, 2009 [DOI] [PMC free article] [PubMed] [Google Scholar]
- 8. Folch J, Lees M, Sloane Stanley GH. A simple method for the isolation and purification of total lipides from animal tissues. J Biol Chem 226: 497–509, 1957 [PubMed] [Google Scholar]
- 9. Frittitta L, Youngren J, Vigneri R, Maddux BA, Trischitta V, Goldfine ID. PC-1 content in skeletal muscle of non-obese, non-diabetic subjects: relationship to insulin receptor tyrosine kinase and whole body insulin sensitivity. Diabetologia 39: 1190–1195, 1996 [DOI] [PubMed] [Google Scholar]
- 10. Frittitta L, Youngren JF, Sbraccia P, D'Adamo M, Buongiorno A, Vigneri R, Goldfine ID, Trischitta V. Increased adipose tissue PC-1 protein content, but not tumor necrosis factor-alpha gene expression, is associated with a reduction of both whole body insulin sensitivity and insulin receptor tyrosine-kinase activity. Diabetologia 40: 282–289, 1997 [DOI] [PubMed] [Google Scholar]
- 11. Goding JW, Grobben B, Slegers H. Physiological and pathophysiological functions of the ecto-nucleotide pyrophosphatase/phosphodiesterase family. Biochim Biophys Acta 1638: 1–19, 2003 [DOI] [PubMed] [Google Scholar]
- 12. Grupe A, Alleman J, Goldfine ID, Sadick M, Stewart TA. Inhibition of insulin receptor phosphorylation by PC-1 is not mediated by the hydrolysis of adenosine triphosphate or the generation of adenosine. J Biol Chem 270: 22085–22088, 1995 [DOI] [PubMed] [Google Scholar]
- 13. Huang-Doran I, Sleigh A, Rochford JJ, O'Rahilly S, Savage DB. Lipodystrophy: metabolic insights from a rare disorder. J Endocrinol 207: 245–255, 2010 [DOI] [PubMed] [Google Scholar]
- 14. Katic M, Kennedy AR, Leykin I, Norris A, McGettrick A, Gesta S, Russell SJ, Bluher M, Maratos-Flier E, Kahn CR. Mitochondrial gene expression and increased oxidative metabolism: role in increased lifespan of fat-specific insulin receptor knock-out mice. Aging Cell 6: 827–839, 2007 [DOI] [PMC free article] [PubMed] [Google Scholar]
- 15. Kotani K, Peroni OD, Minokoshi Y, Boss O, Kahn BB. GLUT4 glucose transporter deficiency increases hepatic lipid production and peripheral lipid utilization. J Clin Invest 114: 1666–1675, 2004 [DOI] [PMC free article] [PubMed] [Google Scholar]
- 16. Li S, Brown MS, Goldstein JL. Bifurcation of insulin signaling pathway in rat liver: mTORC1 required for stimulation of lipogenesis, but not inhibition of gluconeogenesis. Proc Natl Acad Sci USA 107: 3441–3446, 2010 [DOI] [PMC free article] [PubMed] [Google Scholar]
- 17. Liang J, Fu M, Ciociola E, Chandalia M, Abate N. Role of ENPP1 on adipocyte maturation. PLoS One 2: e882, 2007 [DOI] [PMC free article] [PubMed] [Google Scholar]
- 18. Livingston EH, Chandalia M, Abate N. Do current body mass index criteria for obesity surgery reflect cardiovascular risk? Surg Obes Relat Dis 3: 577–585, 2007 [DOI] [PubMed] [Google Scholar]
- 19. Maddux BA, Goldfine ID. Membrane glycoprotein PC-1 inhibition of insulin receptor function occurs via direct interaction with the receptor alpha-subunit. Diabetes 49: 13–19, 2000 [DOI] [PubMed] [Google Scholar]
- 20. Maddux BA, Chang YN, Accili D, McGuinness OP, Youngren JF, Goldfine ID. Overexpression of the insulin receptor inhibitor PC-1/ENPP1 induces insulin resistance and hyperglycemia. Am J Physiol Endocrinol Metab 290: E746–E749, 2006 [DOI] [PubMed] [Google Scholar]
- 21. Marchesini G, Brizi M, Bianchi G, Tomassetti S, Bugianesi E, Lenzi M, McCullough AJ, Natale S, Forlani G, Melchionda N. Nonalcoholic fatty liver disease: a feature of the metabolic syndrome. Diabetes 50: 1844–1850, 2001 [DOI] [PubMed] [Google Scholar]
- 22. National Cholesterol Education Program (NCEP) Expert Panel on Detection, Evaluation, and Treatment of High Blood Cholesterol in Adults (Adult Treatment Panel III). Third Report of the National Cholesterol Education Program (NCEP) Expert Panel on Detection, Evaluation, and Treatment of High Blood Cholesterol in Adults (Adult Treatment Panel III) final report. Circulation 106: 3143–3421, 2002 [PubMed] [Google Scholar]
- 23. Ruderman NB, Schneider SH, Berchtold P. The “metabolically-obese,” normal-weight individual. Am J Clin Nutr 34: 1617–1621, 1981 [DOI] [PubMed] [Google Scholar]
- 24. Sabio G, Das M, Mora A, Zhang Z, Jun JY, Ko HJ, Barrett T, Kim JK, Davis RJ. A stress signaling pathway in adipose tissue regulates hepatic insulin resistance. Science 322: 1539–1543, 2008 [DOI] [PMC free article] [PubMed] [Google Scholar]
- 25. Schwarz JM, Linfoot P, Dare D, Aghajanian K. Hepatic de novo lipogenesis in normoinsulinemic and hyperinsulinemic subjects consuming high-fat, low-carbohydrate and low-fat, high-carbohydrate isoenergetic diets. Am J Clin Nutr 77: 43–50, 2003 [DOI] [PubMed] [Google Scholar]
- 26. Shimomura I, Matsuda M, Hammer RE, Bashmakov Y, Brown MS, Goldstein JL. Decreased IRS-2 and increased SREBP-1c lead to mixed insulin resistance and sensitivity in livers of lipodystrophic and ob/ob mice. Mol Cell 6: 77–86, 2000 [PubMed] [Google Scholar]
- 27. Park SY, Kim HJ, Wang S, Higashimori T, Dong J, Kim YJ, Cline G, Li H, Prentki M, Shulman GI, Mitchell GA, Kim JK. Hormone-sensitive lipase knockout mice have increased hepatic insulin sensitivity and are protected from short-term diet-induced insulin resistance in skeletal muscle and heart. Am J Physiol Endocrinol Metab 289: E30–E39, 2005 [DOI] [PubMed] [Google Scholar]
- 28. Ulitsky A, Ananthakrishnan AN, Komorowski R, Wallace J, Surapaneni SN, Franco J, Saeian K, Gawrieh S. A noninvasive clinical scoring model predicts risk of nonalcoholic steatohepatitis in morbidly obese patients. Obes Surg 20: 685–691, 2010 [DOI] [PubMed] [Google Scholar]
- 29. Wueest S, Rapold RA, Schumann DM, Rytka JM, Schildknecht A, Nov O, Chervonsky AV, Rudich A, Schoenle EJ, Donath MY, Konrad D. Deletion of Fas in adipocytes relieves adipose tissue inflammation and hepatic manifestations of obesity in mice. J Clin Invest 120: 191–202, 2010 [DOI] [PMC free article] [PubMed] [Google Scholar]
Associated Data
This section collects any data citations, data availability statements, or supplementary materials included in this article.


