Abstract
Ca2+/calmodulin-dependent protein kinase kinase 2 (CaMKK2) is a member of the Ca2+/CaM-dependent protein kinase family that is expressed abundantly in brain. Previous work has revealed that CaMKK2 knockout (CaMKK2 KO) mice eat less due to a central nervous system -signaling defect and are protected from diet-induced obesity, glucose intolerance, and insulin resistance. However, here we show that pair feeding of wild-type mice to match food consumption of CAMKK2 mice slows weight gain but fails to protect from diet-induced glucose intolerance, suggesting that other alterations in CaMKK2 KO mice are responsible for their improved glucose metabolism. CaMKK2 is shown to be expressed in liver and acute, specific reduction of the kinase in the liver of high-fat diet-fed CaMKK2floxed mice results in lowered blood glucose and improved glucose tolerance. Primary hepatocytes isolated from CaMKK2 KO mice produce less glucose and have decreased mRNA encoding peroxisome proliferator-activated receptor γ coactivator 1-α and the gluconeogenic enzymes glucose-6-phosphatase and phosphoenolpyruvate carboxykinase, and these mRNA fail to respond specifically to the stimulatory effect of catecholamine in a cell-autonomous manner. The mechanism responsible for suppressed gene induction in CaMKK2 KO hepatocytes may involve diminished phosphorylation of histone deacetylase 5, an event necessary in some contexts for derepression of the peroxisome proliferator-activated receptor γ coactivator 1-α promoter. Hepatocytes from CaMKK2 KO mice also show increased rates of de novo lipogenesis and fat oxidation. The changes in fat metabolism observed correlate with steatotic liver and altered acyl carnitine metabolomic profiles in CaMKK2 KO mice. Collectively, these results are consistent with suppressed catecholamine-induced induction of gluconeogenic gene expression in CaMKK2 KO mice that leads to improved whole-body glucose homeostasis despite the presence of increased hepatic fat content.
Type 2 diabetes is a widespread, costly health problem currently facing the US population. Controlling blood glucose has unequivocally been shown to slow the onset and progression of diabetic complications, yet current therapies generally fail to achieve true normalization of glycemic control. An inappropriately high level of hepatic glucose production via gluconeogenesis is believed to be an important contributing factor to hyperglycemia. Consistent with this, metformin, a widely used first-line treatment for type 2 diabetes, improves glucose metabolism by suppressing hepatic gluconeogenesis (1–6).
Gluconeogenesis, the de novo biosynthesis of new glucose from precursors such as glycerol, alanine, and lactate that occurs in liver and kidney is a mechanism for providing glucose during fasting, times of stress, and exercise. Once glucose becomes available from external sources, e.g. during a meal, gluconeogenesis is sharply and rapidly suppressed. Integration of these events is complex and occurs in part through hormonal control to maintain blood glucose within the narrow physiological range. Glucose-6-phosphatase (G6Pase) and phosphoenolpyruvate carboxykinase (PEPCK) are enzymes that circumvent otherwise irreversible steps of glycolysis and serve important regulatory roles in the gluconeogenic pathway. These enzymes are regulated by transcriptional mechanisms involving the transcription factors cAMP response element-binding protein (CREB), glucocorticoid receptor (GR), forkhead box protein O1, and hepatocyte nuclear factor 4 α, as well as the peroxisome proliferator-activated receptor γ coactivator 1-α (PGC-1α). Key stimulators of gluconeogenic gene transcription are glucagon, glucocorticoids, and catecholamines, which convey signals via the action of cAMP, GR, and Ca2+, respectively, whereas insulin is the most important hormone inhibiting gluconeogenesis. Inefficient suppression of this metabolic pathway due to hepatic insulin resistance combined with elevated glucagon or stress hormones contribute to the development of hyperglycemia in type 2 diabetes (7–11).
CaMKK2 knockout (KO) mice are protected from diet-induced obesity, hyperglycemia, glucose intolerance, and insulin resistance (12). CaMKK2 is a member of the Ca2+/CaM-dependent protein kinase family and was originally identified as a kinase that phosphorylates and activates CaMK1 and CaMKIV (13, 14). CaMKK2 is highly expressed throughout the brain, including the arcuate nucleus of the hypothalamus where it functions as an AMP-activated protein kinase (AMPK) kinase to mediate ghrelin-induced expression of the appetite enhancer, neuropeptide Y. Deletion or inhibition of CaMKK2 in the hypothalamus lowers neuropeptide Y expression and food intake (12). A role for CaMKK2 in regulating energy metabolism in tissues outside the brain has not been previously reported. Interestingly, AMPK, a CaMKK2 substrate under conditions that increase intracellular Ca2+ (15–17), is a well-established master regulator of energy metabolism in most cells including hepatocytes. Under fasted conditions, activation of AMPK leads to phosphorylation of multiple metabolic regulatory enzymes, resulting in activation of energy-producing pathways such as fatty acid oxidation. In this context, however, AMPK is activated by the AMPK kinase, liver kinase B1, and by an increase in the AMP/ATP ratio, events that are Ca2+ independent (18, 19). Liver-specific deletion of AMPK or liver kinase B1 results in whole-body hyperglycemia and glucose intolerance, phenotypes opposite to those observed when CaMKK2 is deleted in the mouse (20, 21). Thus, CaMKK2 is unlikely to function as an activator of AMPK in this well-described pathway in liver. The present study was undertaken to investigate the nature of the AMPK-independent pathway used by CaMKK2 in controlling whole-body glucose homeostasis.
Materials and Methods
Animal care
All animals were bred and maintained in either the Duke University LSRC or MSRBII animal facilities under a 12-h light (0600–01800 h), 12-h dark (1800–0600 h) cycle. Food and water were provided ad libitum (except during pair feeding), and all care was given in compliance within National Institutes of Health institutional guidelines on the care and use of laboratory animals.
Pair feeding
Starting at the age of 5 wk, food intake and body weight of individually housed wild-type (WT) and CaMKK2 KO mice were measured daily. Each day pair-fed WT mice were given the average ad libitum amount of food consumed by age-matched CaMKK2 KO mice the previous day. A separate group of individually housed WT mice was allowed ad libitum access to food.
Adenovirus-mediated gene transfer of Cre recombinase to liver and primary hepatocytes
All adenovirus used was purchased from Vector Biolabs (Philadelphia, PA) and is replication deficient (E1/E3 deleted), serotype 5, and under control of the cytomegalovirus (CMV) promoter. Adenovirus-CMV-cre recombinase-internal ribosome entry site-GFP (Ad-Cre) encodes cre recombinase and green fluorescent protein (GFP) in tandem and adenovirus-CMV-GFP, used as control virus (Ad-Con), encodes GFP. The viruses were amplified in human embryonic kidney 293a cells and purified using the AV Purification Maxi Kit from Biomiga, Inc. (San Diego, CA). Liver-targeted deletion of CaMKK2 in the adult mouse was achieved by systemic administration, via tail vein injection, of Ad-Cre or Ad-Con to 6-month-old CaMKK2floxed animals (12) that had been maintained on standard chow their entire lives or switched to the Surwit high-fat diet (D12330 from Research Diets, Inc., New Brunswick, NJ) 3 months before receiving the adenovirus. The dose used was 1 × 10⁸ infectious particles per mouse in a volume of 200 μl of saline. The efficiency of CaMKK2 deletion from the liver was measured by quantifying CaMKK2 protein in liver extracts by immunoblotting, and CaMKK2 mRNA by quantitative RT-PCR. Acute deletion of CaMKK2 from primary hepatocytes freshly isolated from CaMKK2floxed mice was performed 16 h after plating the cells in collagen-coated 12-well dishes in DMEM containing 10% serum and 25 mm glucose. Ad-Cre or Ad-Con was diluted in culture media and added to the cells at a multiplicity of infection of 3. The media containing the virus were removed 24 h later, and the cells were stimulated or processed as described.
Immunoblotting
Samples were fractionated by SDS-PAGE and transferred to Immobilon-P membrane (Millipore Corp., Bedford, MA). Primary antibody incubations were in Tris buffered saline (TBS) containing 5% BSA; blocking and secondary antibody incubations were in TBS containing 5% nonfat milk; and washes were in TBS with 0.5% Tween 20. Anti-CaMKK (BD Biosciences, Palo Alto, CA; catalog no. 610545) was used at a dilution of 1:500, antiphospho-HDAC4(ser246)/HDAC5(ser259)/HDAC7(ser155) (Cell Signaling Technology, Danvers, MA; catalog no. 3443) was used at 1:1000, antiphospho-HDAC4(ser632)/HDAC5(ser498)/HDAC7(ser486) (Cell Signaling; catalog no. 3424) was used at 1:1000, and anti-β-actin (Sigma Chemical Co., St. Louis, MO) was used at 1:10,000. The horseradish peroxidase-conjugated antimouse and antirabbit secondary antibodies were from Jackson ImmunoResearch Laboratories, Inc. (West Grove, PA) and were used at 1:5000 with the enhanced chemiluminescence kit from Amersham Biosciences (Piscataway, NJ).
Blood glucose and glucose tolerance test
Blood glucose from fed and fasted mice was determined by collecting a small drop of blood from the tail vein for analysis using a hand-held Bayer Ascensia Contour glucometer (Bayer AG, Leverkusen, Germany). Glucose tolerance tests were performed on mice that were fasted overnight (>12 h). At 0900 h baseline blood glucose was measured, after which each mouse was given an ip injection of 2 mg glucose per g body weight. Blood glucose was quantified as a function of time until levels returned to near baseline.
RNA isolation, reverse transcription, and RT-PCR
Total RNA from primary hepatocytes was isolated using the RNeasy kit (QIAGEN, Chatsworth, CA) and quantified spectrophotometrically. Single-strand DNA template was synthesized from random primers using SuperScript II Reverse Transcriptase (Invitrogen, Carlsbad, CA; catalog no. 18064–022) and quantified using an iCycler iQ Real-Time Detection System (Bio-Rad Laboratories, Inc., Hercules, CA) with the iQ STBR Green Supermix (Bio-Rad; catalog no. 170-8882) and the following target sequence-specific primer pairs: CaMKK2: 5′-CTCCCCACAGTCCTCT-3′ (forward) and 5′-AACACCATAGGAGCCCTT-3′ (reverse); G6Pase: 5′-CGCCCCTCTATGTCCTCTTTCC-3′ (forward) and 5′-CATTTCTCTACCCATCACCCC-3′ (reverse); PEPCK: 5′-GCCTCCTCAGCTGCATAATGGTCT-3′ (forward) and 5′-GAATGCTTTCTCGAAGTCCTCTTCTG-3′ (reverse); steroid receptor coactivator 1 (SRC-1): 5′-AGGAGTGATAGAGAAGGAGTCG-3′ (forward) and 5′-TGATTGTAACCCAAGTAGCTGG-3′ (reverse); and cyclophilin: 5′-GAGCTGTTTGCAGACAAACTTC-3′ (forward) and 5′-GAATGCTTTCTCGAAGTCCTCTTCTG-3′ (reverse). After deriving the relative amount of each transcript from a standard curve, transcript levels were normalized to cyclophilin signal.
Hepatocyte isolation and culture
A hepatocyte-enriched cell fraction was isolated from 12-wk-old mice by in situ perfusion of the liver with collagenase, based on the protocol of Schwabe et al. (22). Briefly, mice were anesthetized with 200 μl of ketamine (1:2 mix of xylazine/ketaset) administered by ip injection. A Jelco-W catheter (24G × 5/8 inches; Jelco, Inc., Wheeling, IL) was inserted into the inferior vena cava so that the tip was anterior to the renal veins, and perfusion initiated with Hanks buffered salt solution (HBSS) containing 1 μm EGTA. The portal vein was immediately severed and once blood had been flushed from the liver, the perfusate was switched to HBSS containing 1 μm CaCl2, 0.5 mg/ml collagenase (Sigma C5138), and pen/strep. A total volume of 50 ml of room temperature collagenase buffer was perfused per mouse at a perfusate speed of 5–7 ml/min. The liver was then placed in 25 ml of ice-cold HBSS containing 2 μm CaCl2, 1% BSA, and pen/strep and minced and shaken gently with forceps to release the cells, which were then passed through a 70-μm cell strainer and allowed to collect for 10 min by gravity to the bottom of the tube. After the supernatant enriched in nonparenchymal cells was discarded, the hepatocyte pellet was resuspended in 25 ml hepatocyte media (DMEM with 10% fetal bovine serum, 25 mm glucose, and pen/strep) the cells were allowed to collect by gravity again. After this step was repeated a third time, the cells were suspended in hepatocyte media and plated in culture dishes that had been coated with 20 μg/ml collagen. Before the hepatocytes were plated, cell viability was accessed by trypan blue exclusion, and only those preparations at least 80% viable were used. After an initial incubation of 6 h the cells were washed and given fresh media. When mimicking a fasted state, cells were cultured in serum-free, glucose-free DMEM supplemented with extra amino acids and Na pyruvate and containing pen/strep.
Liver histology
Livers were removed from 3-month-old mice, frozen in powdered dry ice, and stored at −80 C. Sections (10 μm) were cut on a cryostat set at −20 C, thaw mounted, air dried, and stored at −80 C until use. The slides were processed for Oil Red staining by transferring directly to ice-cold 4% paraformaldehyde and fixing for 10 min at room temperature. The slides were then rinsed with water, incubated for 2 min in 100% propylene glycol, and stained for 16 h in Oil Red (0.5% Oil Red O in propylene glycol), after which slides were differentiated in 85% propylene glycol for 1 min, rinsed with water, and counterstained with hematoxylin for 20 sec. The slides were then washed thoroughly with water and mounted in Anti-OX solution (7% gelatin, 50% glycerin, 0.1% phenol).
Glucose and lactate
Glucose was quantified using the Autokit Glucose kit from Wako Chemicals USA, Inc. (Richmond VA). Lactate was quantified using the L-Lactate Assay Kit (Eton Bioscience Inc., Research Triangle Park, NC).
Hepatocyte fat oxidation and de novo lipogenesis
Freshly isolated primary hepatocytes were cultured overnight in hepatocyte media. Fat oxidation was then determined based on the method previously described (23), by replacing the hepatocyte media with 1 ml per well in a six-well dish of oxidation media [DMEM with 3 mm glucose, 2% fetal bovine serum, 1 mm carnitine, 12.5 mm HEPES, and 0.5 μCi/ml [1-14C]oleaic acid, (Perkin Elmer)]. The reaction was terminated 3 h later by adding 100 μl 70% perchloric acid, and 14CO2 was trapped in 200 μl of 1 n NaOH and quantified by liquid scintillation counting. Lipogenesis was assayed by replacing the hepatocyte media with 1 ml per 12 wells, of serum-free DMEM containing 10 mm glucose and 1 μCi/ml [1-14C]acetic acid (Na salt) (PerkinElmer). After incubating 4 h, 5% fetal bovine serum was added to the cells, which were further incubated overnight. Total cellular lipid was then extracted into CHCl3 and quantified by liquid scintillation counting (24, 25).
Plasma measurements
EDTA plasma was collected from fed or overnight fasted mice at the time of euthanasia and analyzed for nonesterified fatty acid, triglycerides, ketones, and cholesterol as previously described (26).
Metabolic profiling
Mass spectrometry-based metabolic profiling of acylcarnitines was performed as described previously (27).
Statistics
Values are given as mean ± sem. Statistical analyses were determined using unpaired, two-tailed Student's t test. For all experiments, an asterisk represents P < 0.05.
Results
Pair feeding does not protect WT mice from diet-induced glucose intolerance
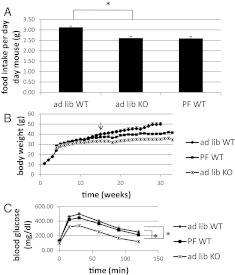
CaMKK2 KO mice, when fed a high-fat diet, eat less and are resistant to the obesity, hyperglycemia, glucose intolerance, and insulin resistance that develop in WT mice fed the same diet (12). To determine whether reduced food intake is sufficient to explain the metabolic improvements in CAMKK2 KO mice, WT and CaMKK2 KO mice were given ad libitum access to high-fat food and are referred to as ad lib WT and ad lib KO, respectively. A separate group of WT mice, referred to as pair-fed WT (PF WT), was calorically restricted to the lesser amount of food consumed by the ad lib KO group. As shown in Fig. 1A, the PF WT and ad lib KO groups consumed the same amount of food, approximately 15% less than consumed by ad lib WT mice. Pair feeding was continued for 30 wk during which time body weight was monitored. As shown in Fig. 1B, beginning at wk 14 and continuing throughout the remaining period of the experiment, PF WT mice show a reduction in body weight compared with their ad lib WT counterparts, but greater body weight when compared with ad lib KO mice. After 30 wk of pair feeding, PF WT mice showed slightly improved glucose tolerance compared with ad lib WT mice, but the difference was not statistically significant (Fig. 1C). In contrast, ad lib KO mice exhibited significantly improved glucose tolerance compared with either group of WT mice, ad lib or pair-fed. We conclude that reduced food intake accounts partially for the decreased body weight of CaMKK2 KO mice but not for the improved glucose tolerance, which implicates the involvement of CaMKK2 in pathways other than those controlling food intake.
Fig. 1.
Pair feeding WT mice does not improve negative effects of high-fat diet on glucose homeostasis. A, Pair-fed WT (PF WT) mice were restricted daily to the amount of high-fat food consumed ad libitum by CaMKK2 KO (ad lib KO) mice. A second group of WT mice were given free access to food (ad lib WT). B, Body weight accumulation of ad lib and PF mice over the 30-wk time course of the experiment. Arrow indicates wk 14, at which point ad lib WT and PF WT body weight becomes statistically different. At wk 30, PF WT mice do not show significantly improved glucose tolerance (C) when compared with ad lib KO. (n = 14).
Acute, liver-specific reduction of CaMKK2 lowers blood glucose and reverses diet-induced glucose intolerance
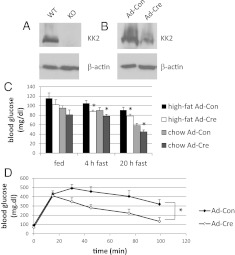
One possibility to consider was that CaMKK2 might be involved in the regulation of hepatic glucose homeostasis. As shown in Fig. 2A, CaMKK2 protein can be detected in whole-liver extracts from WT mice and can be partially reduced (∼70%) in the liver of adult CaMKK2floxed mice by adenovirus-mediated gene transfer of cre recombinase (Ad-Cre) (Fig. 2B). Acute reduction of hepatic CaMKK2 expression in chow and high-fat diet-fed mice resulted in reduced blood glucose in both fed and fasted states, although this was only statistically significant in the fasted state (Fig. 2C). In addition, the high-fat diet-fed, Ad-Cre-treated mice showed improved glucose tolerance compared with animals that had received control virus (Fig. 1D). These results suggest that absence of CaMKK2 from the liver contributes to the improved glucose homeostasis observed in germline CaMKK2 KO mice, and that this effect is observed in animals fed on normal chow or high-fat diets.
Fig. 2.
Liver-specific deletion of CaMKK2 lowers blood glucose and improves whole-body glucose tolerance. CaMKK2 protein is detected by Western blot in liver extract from WT mice (A). Exposure of chow or high-fat diet-fed CaMKK2floxed mice to adenovirus-cre (Ad-Cre) reduces CaMKK2 expression by approximately 50% relative to mice exposed to control virus (Ad-Con). Shown is one representative blot (B). Blood glucose of fed and fasted animals was determined 2 wk after viral transfer (C), and glucose tolerance (D) of high-fat diet-fed mice assayed (n = 5).
Primary hepatocytes from CaMKK2 KO mice exhibit suppressed gluconeogenesis that fails to respond to catecholamine
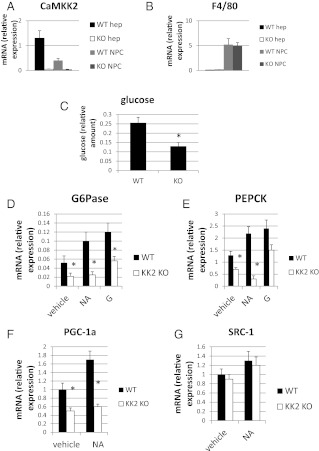
Glucose homeostasis was further evaluated in primary hepatocytes isolated from WT and CaMKK2 KO mice. Hepatocytes (hep) separated from nonparencymal cells (NPC) based on size are enriched in mRNA for CaMKK2 and low in mRNA for the F4/80 marker for Kupffer cells, a major cell type of the NPC fraction (Fig. 3, A and B). The capacity of hepatocyte-enriched fractions from WT and CaMKK2 KO mice for glucose production was compared by incubating the cells in glucose-free growth media containing multiple gluconeogenic substrates for 6 h, followed by measurement of glucose levels in the growth media. Hepatoctyes from CaMKK2 KO mice produced approximately half as much glucose as hepatocytes from WT mice, demonstrating a reduced capacity for glucose production in the former cells (Fig. 3C). We also measured the mRNA encoding G6Pase and PEPCK from the hepatocytes. Glucagon and noradrenaline (NA) positively regulate gluconeogenesis and were included with the cells as controls during the assay. G6Pase mRNA was detected in WT hepatocytes incubated in vehicle alone, and levels were increased 2.5- and 2-fold by glucagon and NA, respectively (Fig. 3D). In contrast, G6Pase was comparably increased by glucagon in CaMKK2 hepatocytes but not stimulated by NA. In addition, G6Pase mRNA in hepatocytes from CaMKK2 KO mice was low in the basal state. The same trend was observed for PEPCK (Fig. 3E).
Fig. 3.
Basal and catecholamine-induced gluconeogenesis is suppressed in primary hepatocytes from CaMKK2 KO mice. Hepatocyte-enriched (hep) and NPC fractions were isolated from WT and CaMKK2 KO mouse liver that are enriched in CaMKK2 (A) and F4/80 (B) mRNA, respectively. C, After a 6-h incubation of hepatocytes in glucose-free media, glucose present in the growth media was quantified. D–G, After a 6-h incubation in glucose-free media the indicated mRNAs, G6Pase, PEPCK, PGC-1a, and SRC-1 were quantified. Included during the incubation was glucagon (G) or NA (n = 3).
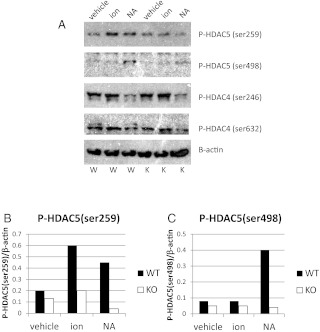
NA transmits signals by binding Gs-coupled β-adrenergic receptors and Gq-coupled α-adrenergic receptors, the latter of which increases the intracellular Ca2+ concentration and activates CaM kinases. G6Pase and PEPCK gene induction requires the transcriptional coactivator PGC-1a, which is also regulated transcriptionally. The basal level of PGC-1a mRNA is reduced in hepatocytes from CaMKK2 KO mice, and in contrast to WT mice, is not stimulated by NA (Fig. 3F). This is consistent with, and may explain, the reduction in G6Pase and PEPCK mRNA in the mutant hepatocytes. The effect is specific in that the mRNA level of SRC-1, a separate transcriptional coactivator, is similar in hepatocytes from WT and CaMKK2 KO mice (Fig. 3G) (28). The PGC-1α promoter is activated by the CREB/CREB-binding protein/TORC2 complex in response to cAMP-protein kinase A (PKA) signaling (4) and repressed by HDAC5 (29). Relief from repression occurs through phosphorylation of HDAC5 on two serine residues, serine 259 and serine 498, events that in some contexts are mediated by Ca2+-dependent activation of CaMK (30). To determine whether the absence of CaMKK2 prevents phosphorylation of HDAC5 and thus relief from repression, p-HDAC5 levels were quantified in hepatocytes from WT and CaMKK2 KO mice. Ionomycin and NA stimulation of WT hepatocytes increases HDAC5 phosphorylation of both serine 259 and serine 498. Compared with WT cells, CaMKK2 KO hepatocytes show decreased basal levels of p-HDAC5 and a failure to increase levels upon stimulation with ionomycin or NA (Fig. 4, A–C). In contrast, phosphorylation on analogous serines of the closely related family member, HDAC4, is neither increased by ionomycin nor NA in WT hepatocytes, nor different between the WT and CaMKK2 KO cells (Fig. 4A). The defective response of CaMKK2 KO hepatocytes to increase HDAC5 phosphorylation parallels their failure to increase PGC-1α mRNA.
Fig. 4.
A, Basal and catecholamine-induced phosphorylation of HDAC5 is suppressed in primary hepatocytes from CaMKK2 KO mice. Primary hepatocytes from WT and CaMKK2 KO mice incubated in hepatocyte media were treated with PBS (vehicle), 1 μm ionomycin (ion) for 5 min, or 10 μm NA for 10 min, after which protein extracts were made for PAGE and Western blotting with antibodies against P-HDAC5(ser259)/P-HDAC4(ser246), P-HDAC5(ser498)/P-HDAC4(ser632), and β-actin. W, Wild type; K, CaMKK2 KO hepatocyte samples, respectively. B and C, Signal was quantified by densitometry. Shown is one representative experiment (n = 3).
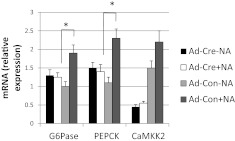
To determine whether CaMKK2 regulates G6Pase and PEPCK mRNA in a cell-autonomous manner, hepatocytes from CaMKK2floxed mice were treated with Ad-cre, resulting in approximately 70% suppression of CaMKK2 mRNA (Fig. 5). Compared with cells receiving control virus, Ad-Cre-treated cells showed impaired NA-induced stimulation of G6Pase and PEPCK mRNA (Fig. 5). Collectively, these results demonstrate decreased glucose production from CaMKK2 KO hepatocytes and suppressed G6Pase and PEPCK mRNA expression that fails to respond to the stimulatory effect of NA in a cell-autonomous manner.
Fig. 5.
The catecholamine signaling defect in hepatocytes from CaMKK2 KO mice is cell autonomous. CaMKK2 was deleted from primary hepatocytes from CaMKK2floxed mice by adenovirus-mediated gene transfer of cre-recombinase (Ad-Cre). Some cells received instead control virus (Ad-Con). The cells were switched 24 h later to glucose-free media in the presence and absence of NA for 6 h, after which mRNA for G6Pase, PEPCK, and CaMKK2 was quantified (n = 3).
CaMKK2 KO mice show enhanced hepatic lipid metabolism
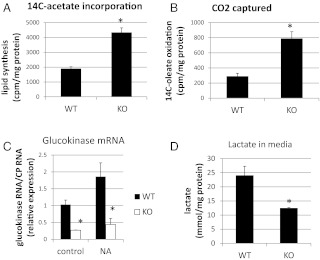
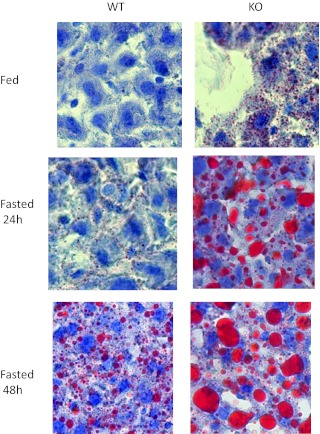
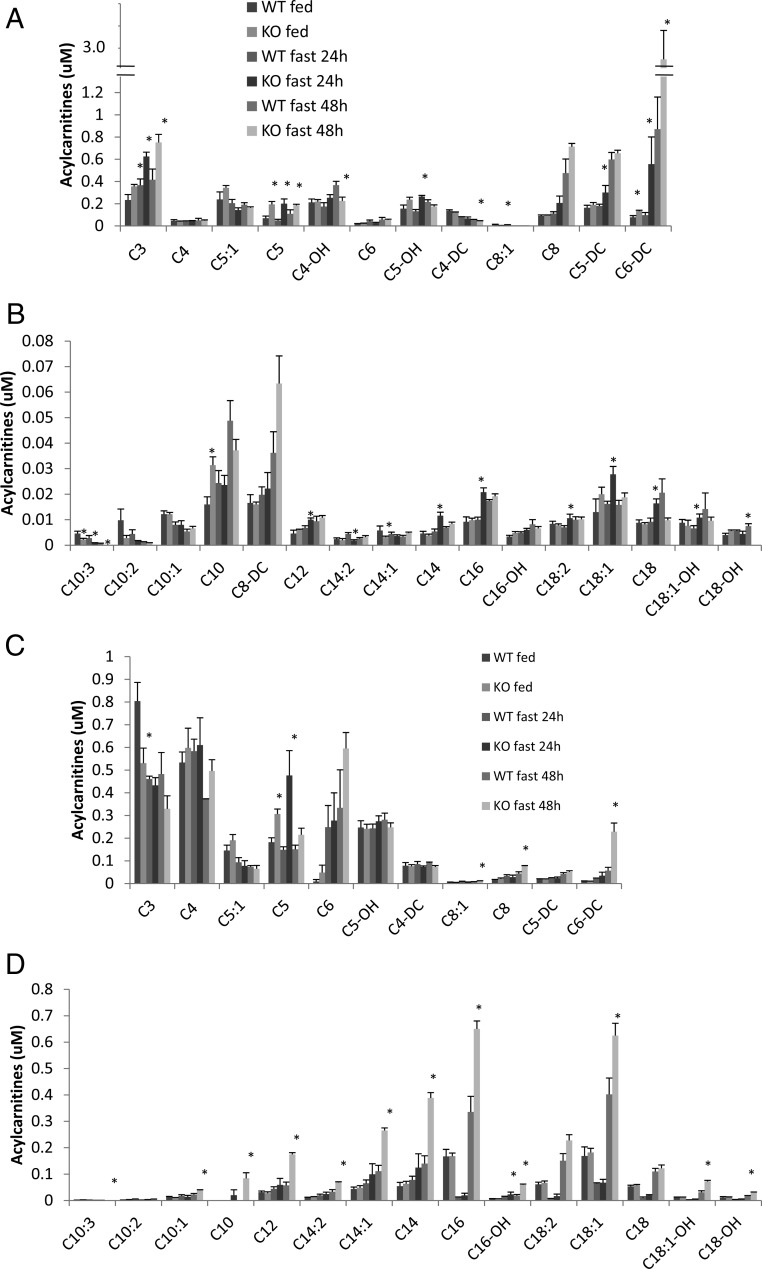
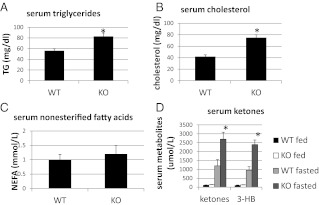
Fat metabolism, which is intricately linked to hepatic glucose metabolism, was examined in CaMKK2 KO primary hepatocytes and liver. In freshly isolated hepatocytes from CaMKK2 KO mice the rate of de novo lipogenesis is increased relative to that in WT cells (Fig. 6A), as is the rate of fat oxidation (Fig. 6, B). Hepatocytes from CaMKK2 KO mice also show reduced amounts of glucokinase mRNA and reduced lactate production, both indications of diminished glucose utilization and consistent with enhanced lipid metabolism (Fig. 6, C-D). In the liver, fat metabolism was initially evaluated by the staining of neutral lipids with the fat-soluble dye, Oil Red O, which indicates that livers from CaMKK2 KO mice accumulate lipids, and that this is enhanced during fasting (Fig. 7). Increased lipid content in CaMKK2 KO liver is consistent with the increased lipogenesis observed in the mutant hepatocytes. We also evaluated fat metabolism in the liver by analyzing acylcarnitine profiles, which provide a measure of fat oxidation byproducts. As expected, liver from WT mice displayed increased amounts of acylcarnitines of all chain lengths as the animals transitioned from the fed to fasted states, in concert with the switch from glucose to fat as the primary energy substrate (Fig. 8, A and B) (23). Relative to those of WT mice, livers from fed and fasted CaMKK2 KO mice had increased levels of acylcarnitines across all chain lengths, consistent with increased flux through the fat oxidation pathway (Fig. 8, A and B). Additional evidence for simultaneous increases in lipid oxidation and synthesis pathways in the CaMKK2 KO mouse is provided by elevated serum levels of triglycerides, cholesterol, acylcarnitines, and fasting ketones (Fig. 9).
Fig. 6.
Fat metabolism in primary hepatocytes from CaMKK2 KO mice is enhanced. Hepatocytes from CaMKK2 KO mice show increased rates of de novo lipogenesis (A) and fatty acid oxidation (B). To determine glucokinase mRNA levels and lactate production, hepatocytes were cultured overnight in hepatocyte media with 25 mm glucose. The next morning control cells or those treated with NA for 5 h were harvested, and the quantity of glucokinase mRNA, normalized for cyclophilin, was determined by RT-PCR (C). Cell culture media were collected overnight, and lactate was quantified using L-Lactate Assay Kit (Eton Bioscience, Inc.) (panel D). [n = 3 (panel A), n = 5 (panel B), n = 3 (panel C), and n = 3 (panel D)].
Fig. 7.
Liver from CaMKK2 KO mice is steatotic. Liver tissue sections from WT and CaMKK2 KO mice from chow-fed mice in fed and fasted states were stained with hematoxylin and the neutral lipid dye, Oil Red O. Shown are representative images in which n = 10.
Fig. 8.
Liver and serum acyl carnitine profiles. Short (A and C) and medium and long-chain length acyl carnitines were quantified in liver (A and B) and serum (C and D) from WT and CaMKK2 KO mice (n = 5).
Fig. 9.
A–D, Serum triglyceride, cholesterol, and ketones are increased in serum from CaMKK2 KO chow-fed mice (n = 9). NEFA, Nonesterified fatty acid; TG, Triglyceride; 3-HB, 3-hydroxybutyrate.
Discussion
The absence of CaMKK2 in the mouse reduces appetite and food intake due to a central nervous system-signaling defect and eliminates high-fat diet-induced glucose intolerance and insulin resistance in the animals (12). It has been suggested the latter phenotypes are a consequence of reduced food consumption and the accompanying reduction in body weight. We here provide evidence, using a combination of pair feeding and liver-specific CaMKK2 deletion experiments, that reduced food consumption does not account for the improved glucose metabolism displayed by CaMKK2 KO mice. Rather we show that CaMKK2 has a direct effect on hepatic glucose metabolism. Adult mice with acute liver-specific deletion of CaMKK2 exhibit reduced whole-body basal and fasting blood glucose, and those maintained on a high-fat diet show improved glucose tolerance. Primary hepatocytes lacking CaMKK2 have reduced glucose production and suppressed basal and catecholamine-induced expression of PGC-1α and its gluconeogenic pathway target genes G6Pase and PEPCK. A causal link between the hepatocyte and whole-body glucose phenotypes seems plausible because inhibiting hepatic gluconeogenesis is an established strategy for lowering whole-body blood glucose (4, 6). Our data suggest that hepatic CaMKK2 plays a role in maintaining tonic glucose in the basal state and in mediating hepatic glucose production in response to catecholamines. Together these results suggest that hepatic CaMKK2 may be a novel target for suppression of hyperglycemia in diabetes.
Hepatocytes from CaMKK2 KO mice show normal PGC-1α and gluconeogenic gene induction in response to glucagon. This is not surprising, because glucagon primarily activates adenylyl cyclase leading to accumulation of cAMP and activation of PKA in a Ca2+-independent fashion (8). In contrast, whereas catecholamines also activate the adenylyl cyclase-cAMP-PKA pathway, they have an additional effect to engage Gq-coupled α-adrenergic receptors to initiate a second signaling cascade that increases intracellular Ca2+, thus stimulating Ca2+-sensitive enzymes including CaMKK2 (31). Catecholamines are a potent stimulator of hepatic gluconeogenesis during times of stress, an effect that cannot be simply replaced by glucagon (32, 33). In the absence of acute stress, the circulating concentrations of catecholamines are low and are thought to contribute to the tonic, homeostatic, glycemic state.
Activation of the PGC-1α promoter requires binding of the P-CREB/CREB-binding protein/TORC2 complex, which forms in response to stimuli that increase cAMP, including glucagon, catecholamine acting via the β-adrenergic receptor, and GR, all of which are Ca2+ independent and therefore unlikely to involve CaMKK2 (4). Within the PGC-1α promoter are also binding sites for myocyte enhancer factor-2 (MEF2), a transcription factor expressed in muscle, brain, and liver, which binds these sites and activates transcription (29, 30, 34). However, MEF2 activity is repressed by its physical association with HDAC5, a repression that can be relieved by phosphorylation of HDAC5 on two conserved serine residues, creating docking sites for the 14.3.3 chaperone protein that mediates translocation of class II HDAC out of the nucleus (29, 35). Data presented here indicate that ionomycin and catecholamine do indeed stimulate the phosphorylation of HDAC5 on both serines in WT hepatocytes but not in hepatocytes from CaMKK2 KO mice, which also show reduced basal levels of phospho-HDAC5. The effect was specific in that phosphorylation of the closely related family member, HDAC4, was not increased by Ca2+ and was unaffected by deletion of CaMKK2. Although CaMKK2 is not known to directly phosphorylate HDAC5, of the protein kinases capable of directly phosphorylating HDAC5 and promoting its nuclear export in vivo and in vitro, several, including CaMK I, CaMK IV, and AMPK, are direct targets of CaMKK2 that could hypothetically function as physiological HDAC kinases to relieve HDAC-mediated repression of the PGC-1α promoter in response to a catecholamine-induced Ca2+-CaMKK2 signal (35–39). Interestingly, an AMPK activity reporter, AMPKAR, was recently described and allows spatiotemporal monitoring of AMPK activity in single cells. AMPK activity was found confined to the cytosol in response to energy stress but observed in both the cytosol and nucleus in response to Ca2+ elevation (40). HDAC4/5 was recently shown to function in mouse liver as a glucagon-activated regulator of gluconeogenesis through a mechanism involving recruitment of HDAC3, which results in acute transcriptional activation of G6Pase via deacetylation of the transcription factor forkhead box protein O (41). Although this represents a mechanism different from HDAC4/5 repression of transcription through MEF2, it demonstrates a regulatory role for HDAC4/5 in hepatic glucose production. The mechanism by which CaMKK2 mediates HDAC5 phosphorylation and whether or not this event indeed modulates hepatic PGC-1α mRNA levels remains to be determined in future studies.
Our data reveal CaMKK2 KO mice to metabolize hepatic lipids at enhanced rates relative to WT mice. Primary hepatocytes from mutant mice exhibit increased rates of lipogenesis and histological staining of liver sections from CaMKK2 KO mice reveals steatosis. Surprisingly, CaMKK2 KO mice also exhibit enhanced fat oxidation, a phenomenon usually inversely related to lipid synthesis. Fat oxidation was examined in hepatocytes by measuring CO2 production and evaluated in liver by analyzing acylcarnitine profiles. The acylcarnitine profile has been shown to reflect the state of fat oxidation in liver as demonstrated in PPARγ−/− mice where fat oxidation is blocked, or by WT mice as they transition from the fed to the fasted state (23, 42). Although the mechanism responsible for the alterations in fat oxidation in CaMKK2 KO mice is unknown, it is possible this is secondary to a decrease in glycolysis and glucose oxidation. Evidence for this comes from reduced lactate production by CaMKK2 KO hepatocytes and the sharp decrease in glucokinase expression. The increase in fatty acid oxidation may thus be simply a compensation for lack of glucose utilization. Liver steatosis is generally associated with elevated blood glucose and the development of glucose intolerance and insulin resistance, conditions that do not occur in CaMKK2 KO mice. In some instances, newly synthesized hepatic fat appears to form a pool with special access to fat oxidation. Instead of promoting insulin resistance and other toxic effects, this fat is benign (43, 44). Other examples in which increased hepatic fat content is dissociated from insulin resistance and hyperglycemia have been described (45, 46). Such models, including the CaMKK2 KO mouse, are of considerable interest for future studies aimed at identifying more precisely how fatty liver and metabolic disease are linked.
Acknowledgments
This work was supported by NIH Grants to A.R.M. (GM033976) and to C.B.N. (P01DK58398).
Disclosure Summary: The authors have nothing to disclose.
Footnotes
- Ad-Con
- Adenovirus-CMV-GFP, used as control virus
- Ad-Cre
- adenovirus-CMV-cre recombinase-IRES-GFP
- AMPK
- AMP-activated protein kinase
- CaMKK2
- Ca2+/calmodulin-dependent protein kinase kinase 2
- CMV
- cytomegalovirus
- CREB
- cAMP response element-binding protein
- GFP
- green fluorescent protein
- G6Pase
- glucose-6-phosphatase
- GR
- glucocorticoid receptor
- HBSS
- Hanks buffered salt solution
- HDAC
- histone deacetylase
- KO
- knockout
- MEF2
- myocyte enhancer factor-2
- NA
- noradrenaline
- NPC
- nonparencymal cells
- PEPCK
- phosphoenolpyruvate carboxykinase
- PGC-1α
- peroxisome proliferator-activated receptor γ coactivator 1-α
- PKA
- protein kinase A
- SRC-1
- steroid receptor coactivator 1
- WT
- wild type.
References
- 1. Muoio DM, Newgard CB. 2008. Mechanisms of disease: molecular and metabolic mechanisms of insulin resistance and β-cell failure in type 2 diabetes. Nat Rev Mol Cell Biol 9:193–205 [DOI] [PubMed] [Google Scholar]
- 2. Beck-Nielsen H, Hother-Nielsen O, Staehr P. 2002. Is hepatic glucose production increased in type 2 diabetes mellitus? Curr Diab Rep 2:231–236 [DOI] [PubMed] [Google Scholar]
- 3. Gaede P, Vedel P, Parving HH, Pedersen O. 1999. Intensified multifactorial intervention in patients with type 2 diabetes mellitus and microalbuminuria: the Steno type 2 randomised study. Lancet 353:617–622 [DOI] [PubMed] [Google Scholar]
- 4. He L, Sabet A, Djedjos S, Miller R, Sun X, Hussain MA, Radovick S, Wondisford FE. 2009. Metformin and insulin suppress hepatic gluconeogenesis through phosphorylation of CREB binding protein. Cell 137:635–646 [DOI] [PMC free article] [PubMed] [Google Scholar]
- 5. Jeng CY, Sheu WH, Fuh MM, Chen YD, Reaven GM. 1994. Relationship between hepatic glucose production and fasting plasma glucose concentration in patients with NIDDM. Diabetes 43:1440–1444 [DOI] [PubMed] [Google Scholar]
- 6. Staehr P, Hother-Nielsen O, Beck-Nielsen H. 2002. Hepatic glucose production: therapeutic target in type 2 diabetes? Diabetes Obes Metab 4:215–223 [DOI] [PubMed] [Google Scholar]
- 7. Cherrington AD. 1999. Banting Lecture 1997. Control of glucose uptake and release by the liver in vivo. Diabetes 48:1198–1214 [DOI] [PubMed] [Google Scholar]
- 8. Exton JH. 1987. Mechanisms of hormonal regulation of hepatic glucose metabolism. Diabetes Metab Rev 3:163–183 [DOI] [PubMed] [Google Scholar]
- 9. Pilkis SJ, Claus TH. 1991. Hepatic gluconeogenesis/glycolysis: regulation and structure/function relationships of substrate cycle enzymes. Annu Rev Nutr 11:465–515 [DOI] [PubMed] [Google Scholar]
- 10. Barthel A, Schmoll D. 2003. Novel concepts in insulin regulation of hepatic gluconeogenesis. Am J Physiol Endocrinol Metab 285:E685–E692 [DOI] [PubMed] [Google Scholar]
- 11. Spiegelman BM, Heinrich R. 2004. Biological control through regulated transcriptional coactivators. Cell 119:157–167 [DOI] [PubMed] [Google Scholar]
- 12. Anderson KA, Ribar TJ, Lin F, Noeldner PK, Green MF, Muehlbauer MJ, Witters LA, Kemp BE, Means AR. 2008. Hypothalamic CaMKK2 contributes to the regulation of energy balance. Cell Metab 7:377–388 [DOI] [PubMed] [Google Scholar]
- 13. Anderson KA, Kane CD. 1998. Ca2+/calmodulin-dependent protein kinase IV and calcium signaling. Biometals 11:331–343 [DOI] [PubMed] [Google Scholar]
- 14. Colomer J, Means AR. 2007. Physiological roles of the Ca2+/CaM-dependent protein kinase cascade in health and disease. Subcell Biochem 45:169–214 [DOI] [PubMed] [Google Scholar]
- 15. Witters LA, Kemp BE, Means AR. 2006. Chutes and Ladders: the search for protein kinases that act on AMPK. Trends Biochem Sci 31:13–16 [DOI] [PubMed] [Google Scholar]
- 16. Hurley RL, Anderson KA, Franzone JM, Kemp BE, Means AR, Witters LA. 2005. The Ca2+/calmodulin-dependent protein kinase kinases are AMP-activated protein kinase kinases. J Biol Chem 280:29060–29066 [DOI] [PubMed] [Google Scholar]
- 17. Hawley SA, Pan DA, Mustard KJ, Ross L, Bain J, Edelman AM, Frenguelli BG, Hardie DG. 2005. Calmodulin-dependent protein kinase kinase-β is an alternative upstream kinase for AMP-activated protein kinase. Cell Metab 2:9–19 [DOI] [PubMed] [Google Scholar]
- 18. Kahn BB, Alquier T, Carling D, Hardie DG. 2005. AMP-activated protein kinase: ancient energy gauge provides clues to modern understanding of metabolism. Cell Metab 1:15–25 [DOI] [PubMed] [Google Scholar]
- 19. Viollet B, Foretz M, Guigas B, Horman S, Dentin R, Bertrand L, Hue L, Andreelli F. 2006. Activation of AMP-activated protein kinase in the liver: a new strategy for the management of metabolic hepatic disorders. J Physiol 574:41–53 [DOI] [PMC free article] [PubMed] [Google Scholar]
- 20. Shaw RJ, Lamia KA, Vasquez D, Koo SH, Bardeesy N, Depinho RA, Montminy M, Cantley LC. 2005. The kinase LKB1 mediates glucose homeostasis in liver and therapeutic effects of metformin. Science 310:1642–1646 [DOI] [PMC free article] [PubMed] [Google Scholar]
- 21. Viollet B, Athea Y, Mounier R, Guigas B, Zarrinpashneh E, Horman S, Lantier L, Hebrard S, Devin-Leclerc J, Beauloye C, Foretz M, Andreelli F, Ventura-Clapier R, Bertrand L. 2009. AMPK: Lessons from transgenic and knockout animals. Front Biosci 14:19–44 [DOI] [PMC free article] [PubMed] [Google Scholar]
- 22. Schwabe RF, Bennett BL, Manning AM, Brenner DA. 2001. Differential role of Iκ B kinase 1 and 2 in primary rat hepatocytes. Hepatology 33:81–90 [DOI] [PubMed] [Google Scholar]
- 23. Koves TR, Ussher JR, Noland RC, Slentz D, Mosedale M, Ilkayeva O, Bain J, Stevens R, Dyck JR, Newgard CB, Lopaschuk GD, Muoio DM. 2008. Mitochondrial overload and incomplete fatty acid oxidation contribute to skeletal muscle insulin resistance. Cell Metab 7:45–56 [DOI] [PubMed] [Google Scholar]
- 24. Bligh EG, Dyer WJ. 1959. A rapid method of total lipid extraction and purification. Can J Biochem Physiol 37:911–917 [DOI] [PubMed] [Google Scholar]
- 25. Muoio DM, Seefeld K, Witters LA, Coleman RA. 1999. AMP-activated kinase reciprocally regulates triacylglycerol synthesis and fatty acid oxidation in liver and muscle: evidence that sn-glycerol-3-phosphate acyltransferase is a novel target. Biochem J 338:783–791 [PMC free article] [PubMed] [Google Scholar]
- 26. Newgard CB, An J, Bain JR, Muehlbauer MJ, Stevens RD, Lien LF, Haqq AM, Shah SH, Arlotto M, Slentz CA, Rochon J, Gallup D, Ilkayeva O, Wenner BR, Yancy WS, Jr, Eisenson H, Musante G, Surwit RS, Millington DS, Butler MD, Svetkey LP. 2009. A branched-chain amino acid-related metabolic signature that differentiates obese and lean humans and contributes to insulin resistance. Cell Metab 9:311–326 [DOI] [PMC free article] [PubMed] [Google Scholar]
- 27. An J, Muoio DM, Shiota M, Fujimoto Y, Cline GW, Shulman GI, Koves TR, Stevens R, Millington D, Newgard CB. 2004. Hepatic expression of malonyl-CoA decarboxylase reverses muscle, liver and whole-animal insulin resistance. Nat Med 10:268–274 [DOI] [PubMed] [Google Scholar]
- 28. Louet JF, Chopra AR, Sagen JV, An J, York B, Tannour-Louet M, Saha PK, Stevens RD, Wenner BR, Ilkayeva OR, Bain JR, Zhou S, DeMayo F, Xu J, Newgard CB, O'Malley BW. 2010. The coactivator SRC-1 is an essential coordinator of hepatic glucose production. Cell Metab 12:606–618 [DOI] [PMC free article] [PubMed] [Google Scholar]
- 29. Czubryt MP, McAnally J, Fishman GI, Olson EN. 2003. Regulation of peroxisome proliferator-activated receptor gamma coactivator 1 α (PGC-1 α) and mitochondrial function by MEF2 and HDAC5. Proc Natl Acad Sci USA 100:1711–1716 [DOI] [PMC free article] [PubMed] [Google Scholar]
- 30. Lu J, McKinsey TA, Nicol RL, Olson EN. 2000. Signal-dependent activation of the MEF2 transcription factor by dissociation from histone deacetylases. Proc Natl Acad Sci USA 97:4070–4075 [DOI] [PMC free article] [PubMed] [Google Scholar]
- 31. Exton JH, Blackmore PF, El-Refai MF, Dehaye JP, Strickland WG, Cherrington AD, Chan TM, Assimacopoulos-Jeannet FD, Chrisman TD. 1981. Mechanisms of hormonal regulation of liver metabolism. Adv Cyclic Nucleotide Res 14:491–505 [PubMed] [Google Scholar]
- 32. Smith U, Lager I. 1989. Insulin-antagonistic effects of counterregulatory hormones: clinical and mechanistic aspects. Diabetes Metab Rev 5:511–525 [DOI] [PubMed] [Google Scholar]
- 33. Gustavson SM, Chu CA, Nishizawa M, Farmer B, Neal D, Yang Y, Vaughan S, Donahue EP, Flakoll P, Cherrington AD. 2003. Glucagon's actions are modified by the combination of epinephrine and gluconeogenic precursor infusion. Am J Physiol Endocrinol Metab 285:E534–E544 [DOI] [PubMed] [Google Scholar]
- 34. Piantadosi CA, Withers CM, Bartz RR, MacGarvey NC, Fu P, Sweeney TE, Welty-Wolf KE, Suliman HB. 2011. Heme oxygenase-1 couples activation of mitochondrial biogenesis to anti-inflammatory cytokine expression. J Biol Chem 286:16374–16385 [DOI] [PMC free article] [PubMed] [Google Scholar]
- 35. Zhao X, Ito A, Kane CD, Liao TS, Bolger TA, Lemrow SM, Means AR, Yao TP. 2001. The modular nature of histone deacetylase HDAC4 confers phosphorylation-dependent intracellular trafficking. J Biol Chem 276:35042–35048 [DOI] [PubMed] [Google Scholar]
- 36. McKinsey TA, Zhang CL, Lu J, Olson EN. 2000. Signal-dependent nuclear export of a histone deacetylase regulates muscle differentiation. Nature 408:106–111 [DOI] [PMC free article] [PubMed] [Google Scholar]
- 37. McGee SL, van Denderen BJ, Howlett KF, Mollica J, Schertzer JD, Kemp BE, Hargreaves M. 2008. AMP-activated protein kinase regulates GLUT4 transcription by phosphorylating histone deacetylase 5. Diabetes 57:860–867 [DOI] [PubMed] [Google Scholar]
- 38. Zhao JX, Yue WF, Zhu MJ, Du M. 2011. AMP-activated protein kinase regulates β-catenin transcription via histone deacetylase 5. J Biol Chem 286:16426–16434 [DOI] [PMC free article] [PubMed] [Google Scholar]
- 39. McKinsey TA. 2007. Derepression of pathological cardiac genes by members of the CaM kinase superfamily. Cardiovasc Res 73:667–677 [DOI] [PubMed] [Google Scholar]
- 40. Tsou P, Zheng B, Hsu CH, Sasaki AT, Cantley LC. 2011. A fluorescent reporter of AMPK activity and cellular energy stress. Cell Metab 13:476–486 [DOI] [PMC free article] [PubMed] [Google Scholar]
- 41. Mihaylova MM, Vasquez DS, Ravnskjaer K, Denechaud PD, Yu RT, Alvarez JG, Downes M, Evans RM, Montminy M, Shaw RJ. 2011. Class IIa histone deacetylases are hormone-activated regulators of FOXO and mammalian glucose homeostasis. Cell 145:607–621 [DOI] [PMC free article] [PubMed] [Google Scholar]
- 42. Makowski L, Noland RC, Koves TR, Xing W, Ilkayeva OR, Muehlbauer MJ, Stevens RD, Muoio DM. 2009. Metabolic profiling of PPARα−/− mice reveals defects in carnitine and amino acid homeostasis that are partially reversed by oral carnitine supplementation. FASEB J 23:586–604 [DOI] [PMC free article] [PubMed] [Google Scholar]
- 43. Chakravarthy MV, Pan Z, Zhu Y, Tordjman K, Schneider JG, Coleman T, Turk J, Semenkovich CF. 2005. “New” hepatic fat activates PPARα to maintain glucose, lipid, and cholesterol homeostasis. Cell Metab 1:309–322 [DOI] [PubMed] [Google Scholar]
- 44. Lodhi IJ, Wei X, Semenkovich CF. 2011. Lipoexpediency: de novo lipogenesis as a metabolic signal transmitter. Trends Endocrinol Metab 22:1–8 [DOI] [PMC free article] [PubMed] [Google Scholar]
- 45. Monetti M, Levin MC, Watt MJ, Sajan MP, Marmor S, Hubbard BK, Stevens RD, Bain JR, Newgard CB, Farese RV, Sr, Hevener AL, Farese RV., Jr 2007. Dissociation of hepatic steatosis and insulin resistance in mice overexpressing DGAT in the liver. Cell Metab 6:69–78 [DOI] [PubMed] [Google Scholar]
- 46. Listenberger LL, Han X, Lewis SE, Cases S, Farese RV, Jr, Ory DS, Schaffer JE. 2003. Triglyceride accumulation protects against fatty acid-induced lipotoxicity. Proc Natl Acad Sci USA 100:3077–3082 [DOI] [PMC free article] [PubMed] [Google Scholar]


