

Altering pyrimidine levels in influenza virus– or VSV-infected cells reverses the inhibitory effect of viral proteins NS1 and M on host mRNA nuclear export, restoring expression of host antiviral factors.
Abstract
The NS1 protein of influenza virus is a major virulence factor essential for virus replication, as it redirects the host cell to promote viral protein expression. NS1 inhibits cellular messenger ribonucleic acid (mRNA) processing and export, down-regulating host gene expression and enhancing viral gene expression. We report in this paper the identification of a nontoxic quinoline carboxylic acid that reverts the inhibition of mRNA nuclear export by NS1, in the absence or presence of the virus. This quinoline carboxylic acid directly inhibited dihydroorotate dehydrogenase (DHODH), a host enzyme required for de novo pyrimidine biosynthesis, and partially reduced pyrimidine levels. This effect induced NXF1 expression, which promoted mRNA nuclear export in the presence of NS1. The release of NS1-mediated mRNA export block by DHODH inhibition also occurred in the presence of vesicular stomatitis virus M (matrix) protein, another viral inhibitor of mRNA export. This reversal of mRNA export block allowed expression of antiviral factors. Thus, pyrimidines play a necessary role in the inhibition of mRNA nuclear export by virulence factors.
Introduction
Influenza viruses cause widespread human disease, resulting in high mortality rates (Smith et al., 2004). Critical to the success of infection is the ability of influenza virus to rapidly produce viral proteins that alter cellular functions to favor production of new viral particles and to defeat the innate immune responses to virus infection. Within hours of infection by influenza virus, a viral nonstructural protein, NS1, inhibits host gene expression via down-regulation of host mRNA processing and export (Nemeroff et al., 1998; Satterly et al., 2007). NS1 also inhibits signaling pathways involved in the interferon-mediated antiviral response (Versteeg and García-Sastre, 2010) and activates AKT signaling (Cooray, 2004; Hale et al., 2006; Ehrhardt et al., 2007; Shin et al., 2007; Zhirnov and Klenk, 2007; Buchkovich et al., 2008) that, in part, acts through mTORC1 to up-regulate translation (Mata et al., 2011). These effects lead to preferential translation of viral proteins and inhibition of host protein synthesis. Influenza virus, from the PR8 strain, that lacks NS1 is attenuated (García-Sastre et al., 1998). This virus does not efficiently replicate in immune-competent cells, but it replicates in an immune-compromised host. These findings indicate that NS1 functions early during infection, strongly contributing to virulence.
Because influenza virus must convert host cell regulatory and metabolic pathways to its own use during the early hours of infection, it should be possible to identify critical host pathways required for viral infection. To discover host factors required for influenza virus replication, several genome-wide RNAi screens have been conducted to identify human genes required by the virus (Brass et al., 2009; Shapira et al., 2009; Karlas et al., 2010; König et al., 2010; Watanabe et al., 2010). An alternative and complementary approach is to screen synthetic chemical compound libraries for small molecules that inhibit influenza virus replication and/or influenza virus protein function without exhibiting toxicity to the host cell. We therefore performed a screen to search for small molecules that antagonized the inhibition of host gene expression mediated by NS1 in the absence of virus (Mata et al., 2011). We report here the identification of inhibitors of pyrimidine biosynthesis, which reveals a novel requirement for pyrimidines in NS1-mediated block of mRNA nuclear export. This requirement extends to the M (matrix) protein of the vesicular stomatitis virus (VSV), which is another viral protein that inhibits mRNA export (Her et al., 1997; von Kobbe et al., 2000; Enninga et al., 2002). Thus, pyrimidines have a critical role in regulating the mRNA export block induced by virulence factors of evolutionarily diverse viruses.
Results and discussion
DHODH inhibitor reverts NS1-mediated inhibition of host gene expression
Nuclear NS1 inhibits mRNA processing and export, leading to down-regulation of host gene expression (Nemeroff et al., 1998; Satterly et al., 2007). This activity facilitates viral gene expression. We have screened a library of 200,000 small molecules using a luciferase reporter gene assay to monitor down-regulation of host gene expression in cells transfected with a plasmid expressing NS1 alone, in the absence of viral infection (Mata et al., 2011). A nontoxic quinoline carboxylic acid (Fig. 1 and Fig. S1 A), termed compound 1, was identified, which did not alter luciferase activity by itself but reverted the inhibition of host gene expression by NS1 (Fig. 1, A and B) despite the fact that NS1 expression levels were not altered by 1 (Fig. 1 B).
Figure 1.

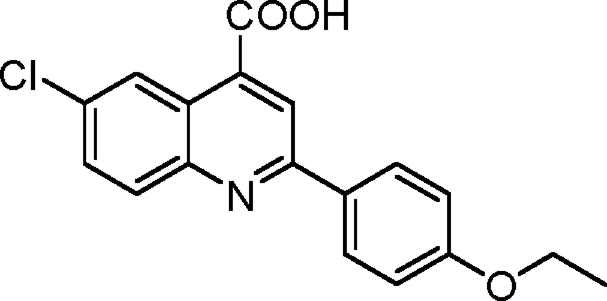
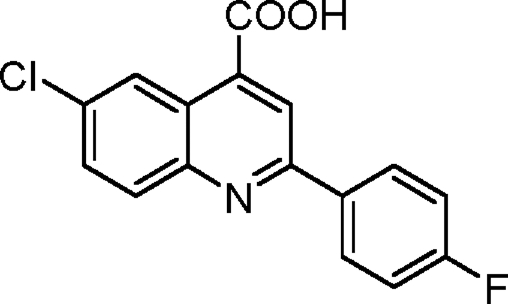
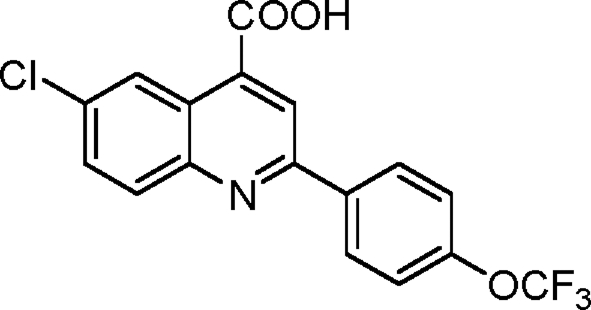
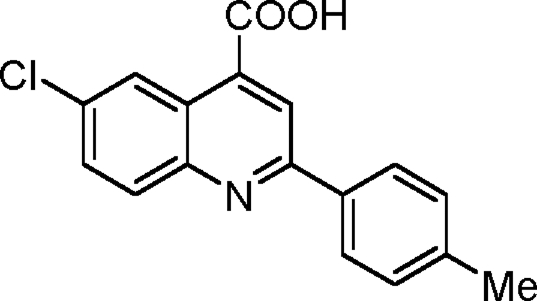
Quinoline carboxylic acid targets DHODH and reverts host gene expression block induced by NS1. (A) Structure of 1, a quinoline carboxylic acid. (B) Luciferase reporter gene assay was performed in 293T cells transfected with a plasmid encoding luciferase alone or cotransfected with a plasmid encoding NS1, in the absence or presence of 5 µM 1 as indicated. NS1 and β-actin levels were measured by immunoblot analysis. (C) Analogues of 1. (D) Dose–response curves for inhibition of human DHODH. Inhibitor concentration was varied in a threefold dilution series (0.01–100 µM), and the percentage of inhibition relative to no inhibitor control was determined (vi/vo × 100). Data collected in triplicate were fitted to the log[I] versus response (three parameters) equation in Prism to determine the IC50. Values given in parenthesis are the fitted IC50 values. A77 1726, the active metabolite of leflunomide, was used as a control and gave an IC50 = 0.25 (0.13–0.47) µM. (E) Model of 1-14 bound to human DHODH generated by DOCK. 1-14 (turquoise) was docked into the human DHODH structure (purple). ABBA, the original ligand cocrystallized with DHODH in 2B0M, is displayed in magenta, flavin mononucleotide (FMN) is displayed in yellow, orotate (oro) is displayed in purple, nitrogens are in blue, and oxygens are in red. Active site residues are labeled. ABBA is a brequinar analogue. (F) Relative abundance of uridine nucleotides determined by liquid chromatography MS/MS in HBECs in the absence or presence of 1-14. Intracellular UTP, UDP, and UMP levels were quantitated using MRM. Results represent mean values ± SD; **, P < 0.01.
A similarity search was performed to identify analogues of 1 and revealed that 1 was related to the quinoline carboxylic acid brequinar. Brequinar is a known inhibitor of the human dihydroorotate dehydrogenase (DHODH; Chen et al., 1986, 1992; Peters et al., 1990; Batt et al., 1995, 1998; Pitts et al., 1998), a key enzyme in the de novo biosynthesis pathway of pyrimidines (Phillips and Rathod, 2010). Mammalian cells have both the de novo pyrimidine synthesis pathway and salvage pathway that allow them to scavenge preformed pyrimidine nucleosides and bases for DNA and RNA synthesis. However, in rapidly growing cells, the salvage pathway is insufficient to supply the needed pyrimidines, and the de novo pathway plays a key role. In addition, UMP and UDP pools regulate various host signaling pathways, including growth factor activation (Huang and Graves, 2003).
Next, we synthesized analogues of compound 1 (Fig. 1 C), including some that more closely resembled brequinar, and tested this compound series for their ability to inhibit recombinant human DHODH in vitro. All five compounds inhibited human DHODH (Fig. 1 D). The most potent of these analogues, 1-14, was docked into the human DHODH structure (Protein Data Bank accession no. 2B0M) to generate a model of its binding interactions in the active site (Fig. 1 E). The brequinar analogue ligand 3-amido-5-biphenyl-benzolic acid (ABBA) was removed from the 2B0M coordinate set before docking. The docked 1-14 binds in a very similar position to ABBA. The carboxylate moiety of both compounds forms interactions with Arg136, and the hydrophobic biphenyl rings occupy the same pocket, which is lined with hydrophobic and aromatic amino acids (e.g., Phe62, Met111, Leu68, and Tyr38). As expected, cells treated with 1-14 had reduced UTP levels, whereas UMP and UDP pools were down-regulated to a lesser extent (Fig. 1 F).
Inhibition of influenza virus replication by DHODH inhibitors
Leflunomide is an inhibitor of human DHODH used as an antiarthritic drug, and its mechanism of action is through inhibition of DHODH by its active metabolite A77 1726 (Goldenberg, 1999; Herrmann et al., 2000; Olsen and Stein, 2004). Although leflunomide is the only currently marketed DHODH inhibitor, several other structural classes have been identified that show potent inhibition of the human enzyme, including brequinar (Chen et al., 1986, 1992; Peters et al., 1990; Batt et al., 1995, 1998; Pitts et al., 1998). These inhibitors of pyrimidine biosynthesis have been shown to have activity against viruses (Waldman et al., 1999; Lin et al., 2000; Bernhoff et al., 2010; Qing et al., 2010; Hoffmann et al., 2011). This antiviral activity has been interpreted as a result of suppressed production of pyrimidines that limits virus replication, as viral mRNAs are more actively transcribed than host mRNAs. To investigate whether 1-14 regulates virus replication, human bronchial epithelial cells (HBECs) were infected with influenza virus. We showed that influenza virus protein levels were reduced (Fig. 2 A), and virus replication was inhibited (Fig. 2 B). As expected for other inhibitors of pyrimidine biosynthesis (Waldman et al., 1999; Lin et al., 2000; Bernhoff et al., 2010; Qing et al., 2010; Hoffmann et al., 2011), VSV protein levels and replication were also down-regulated by 1-14 (Fig. S1, F and G).
Figure 2.

Quinoline carboxylic acid inhibits virus replication via DHODH. (A) HBECs were noninfected or infected with A/WSN/1933 at an MOI of 1. Cells were pretreated for 2 h with 1-14 and/or posttreated with 1-14, added at the indicated time points, for 24 h. Cell extracts were subjected to immunoblot analysis using antibodies against various influenza virus proteins. (B) HBECs were infected with A/WSN/1933 at an MOI of 0.01, and 1-14, at various concentrations, was added 1 h after infection. Virus replication was measured by plaque assays. (C) MDCK cells were infected with A/WSN/1933 at an MOI of 0.001 for 48 h and incubated with DMSO, 1, 1-10, and 1-14 in the absence (control) or presence of 500 µM uridine (U), cytidine (C), adenosine (A), or guanosine (G). Virus titers were measured by plaque assays. (D) MDCK cells were infected with A/WSN/1933 at an MOI of 0.001 for 48 h and incubated with DMSO or 1-14 in the absence or presence of 50 or 500 µM orotic acid. Virus titers were measured by plaque assays. Results represent mean values ± SD; **, P < 0.01. p.i., postinfection; pfu, plaque-forming unit.
To functionally demonstrate that inhibition of DHODH by 1 impairs viral replication, cells were infected in the presence of active 1, 1-14, or inactive 1-10 and uridine, cytidine, adenosine, or guanosine. The results showed that only pyrimidines were able to revert 1 or 1-14 antiviral activity for both influenza virus (Fig. 2 C) and VSV (Fig. S1 H). As expected, 1-10 had no antiviral effect, and addition of pyrimidines did not alter viral replication (Fig. 2 C and Fig. S1 H). Addition of orotate, the direct product of DHODH, also reverted 1-14–mediated inhibition of virus replication (Fig. 2 D and Fig. S1 I). We also tested the compound 1 series shown in Fig. 1 C for their ability to inhibit VSV replication and, importantly, the order of inhibition potency in the in vitro assay with recombinant DHODH (Fig. 1 D) correlated with the activity in the viral replication assay, with 1-14 the most active and 1-10 the least active (Table S8). Reduction of pyrimidine levels by 1 or 1-14, and by other DHODH inhibitors, preferentially down-regulated the more active viral polymerase (Fig. S1 J; Hoffmann et al., 2011) as compared with the host polymerase because these compounds did not alter the levels of a large number of host mRNAs (Table S9) and were not cytotoxic (Fig. S1 A; Hoffmann et al., 2011).
DHODH inhibitor releases host mRNA export block in influenza virus–infected cells
To determine whether cells treated with 1-14 or 1 would revert the mRNA export block during influenza virus infection, cells were simultaneously subjected to oligo (dT) in situ hybridization to detect poly(A)+ RNA and immunofluorescence with antiinfluenza protein antibodies to label infected cells. Uninfected cells treated with 1-14 or 1 showed no effects on the intracellular distribution of mRNA, which was widely distributed in the cytoplasm and in the nucleus (Fig. 3, A and B; and Fig. S2, A and B). Infection with A/WSN/33 influenza virus resulted in poly(A)+ RNA retention in the nucleus, whereas infected cells that were also treated with 1-14 or 1 showed a normal distribution of mRNA in the nucleus and in the cytoplasm (Fig. 3, A and B; and Fig. S2, A and B). These results are consistent with the inhibition of viral replication by 1-14 or 1, which reduced NS1 levels and, therefore, prevented NS1-mediated mRNA export block. This release of mRNA export block is also consistent with a second mechanism in which effects of 1-14 on NS1 function in mRNA export allows expression of host mRNAs that encode antiviral factors (see Fig. 5 and Fig. S2). It should be noted that treatment of cells with 1-14 or 1 alone did not significantly alter the intensity of labeling of host poly(A)+ RNA. Although NS1 is known to inhibit mRNA export when expressed in mammalian cells (Nemeroff et al., 1998; Satterly et al., 2007), mRNA export has not been assessed in a virus lacking NS1. Here, we generated an A/WSN/33 lacking NS1 (WSN-ΔNS1) and showed that, in the absence of NS1, the virus does not inhibit mRNA export (Fig. 3, A and B). This result demonstrates the function of NS1 as an inhibitor of host mRNA export in the context of viral infection.
Figure 3.

Quinoline carboxylic acid releases mRNA export block induced by influenza virus. (A) HBECs were infected with A/WSN/1933 or A/WSN/1933-ΔNS1 at an MOI of 1 for 30 h in the absence or presence of 1 µM 1-14. Cells were subjected to oligo d(T) in situ hybridization and immunofluorescence using antibodies against all influenza virus proteins. Cells were visualized in an inverted microscope (Axiovert 200M). DAPI stained the nucleus. Bar, 20 µM. (B) Quantification of cells that presented nuclear retention of poly(A)+ RNA in A. The percentage of cells presenting nuclear retention of poly(A)+ RNA was calculated with respect to cells that showed normal distribution of poly(A)+ RNA—in the nucleus and in the cytoplasm. 500 cells were counted for each condition. Results represent mean values ± SD; **, P < 0.01.
Figure 5.

DHODH inhibitor induces nuclear export and expression of mRNAs encoding antiviral factors via increasing NXF1 levels. (A) 293T cells transfected with a plasmid encoding NS1 were untreated or treated with 1-14. RNA was isolated from nuclear and cytoplasmic (cyto) fractions, and the indicated mRNA species were quantified by real-time RT-PCR. Controls for fraction purity are shown by immunoblot analysis, as indicated. (B) 293T cells were transfected with a control plasmid or a plasmid encoding NS1 and untreated or treated with 1-14. Total cell extracts were subjected to immunoblot analysis with antibodies against the indicated proteins. (C) 293T cells were transfected with a control plasmid or a plasmid encoding NS1 and untreated or treated with 1 or 1-14. Total cell extracts were subjected to immunoblot analysis with antibodies against the indicated proteins. (D) 293T cells were cotransfected with a control plasmid or a plasmid encoding NS1 and control siRNA oligonucleotide (SCR) or siRNA that target NXF1. RNA was isolated from nuclear and cytoplasmic fractions, and the indicated mRNA species were quantified by real-time RT-PCR. Controls for NXF1 knockdown are shown by immunoblot analysis, as indicated. Results represent mean values ± SD; **, P < 0.01. N/C, nuclear/cytoplasmic.
Pyrimidine biosynthesis is required for NS1- and M protein–mediated mRNA export block
Because 1 was originally identified in the absence of the virus as a compound that reverted the block of host gene expression by NS1, we directly tested whether addition of uridine would reinstate NS1-mediated inhibition of gene expression in the presence of 1 or 1-14 and in the absence of virus. In fact, inhibition of luciferase activity by NS1 was reverted by 1 or 1-14, and addition of pyrimidines, uridine, or cytidine restored the ability of NS1 to block luciferase expression (Fig. 4 A). 1 or 1-14 alone did not affect luciferase expression or NS1 levels (Fig. 4 A). These results indicate that the contribution of DHODH to pyrimidine pools is required for the inhibition of host gene expression by NS1. We then investigated whether the reversal of NS1-mediated host gene expression block by 1-14 or 1, in the absence of virus, occurred at the mRNA export level, as NS1 inhibits nuclear export of host mRNAs (Nemeroff et al., 1998; Satterly et al., 2007). Cells were transfected with plasmid alone or plasmid encoding NS1, in the presence or absence of 1-14. Cells were then subjected to oligo (dT) in situ hybridization and quantification (Fig. 4, B and C). As shown in Fig. 4 (B and C), compound 1-14 alone did not have major effects on bulk mRNA distribution, and as expected, NS1 alone inhibited nuclear export of poly(A)+ RNA. This mRNA export block was released by 1-14, as poly(A)+ RNA was detected both in the nucleus and cytoplasm (Fig. 4, B and C). In contrast, the mRNA block was restored in the presence of uridine and 1-14 (Fig. 4, B and C). Because this effect occurred in the absence of virus, it is independent of virus replication or inhibition of the virus polymerase. Importantly, these findings establish a novel cross talk between the pyrimidine biosynthesis pathway and regulation of mRNA nuclear export by NS1.
Figure 4.

Pyrimidine biosynthesis regulates NS1-targeted host mRNA nuclear export. (A) A luciferase gene expression assay was performed in 293T cells by cotransfection of reporter plasmids and plasmids encoding NS1. Cells were treated with compounds 1 (5 µM) or 1-14 (1 µM) in the presence or absence of uridine or cytidine, as indicated, and luciferase activity was measured. Cell lysates as in A were subjected to immunoblot analysis with antibodies against the indicated proteins. (B) HeLa cells transfected with plasmid alone or plasmid expressing NS1 were incubated with DMSO, 1 µM compound 1-14 alone, or compound 1-14 in the presence of 500 µM uridine. Cells were then subjected to oligo d(T) in situ hybridization and immunofluorescence with anti-NS1 antibodies. Bar, 15 µM. (C) Quantification of cells that presented nuclear retention of poly(A)+ RNA in B. The percentage of cells presenting nuclear retention of poly(A)+ RNA was calculated with respect to cells that showed normal distribution of poly(A)+ RNA—in the nucleus and in the cytoplasm. 500 cells were counted for each condition. Results represent mean values ± SD; **, P < 0.01.
To further investigate the mRNAs that are released from the nucleus upon compound treatment, we performed genome-wide gene expression analysis using total cell extracts, nuclear fractions, and cytoplasmic fractions of cells transfected with NS1, untreated, or treated with 1 (Table S10). We then focused our analysis on mRNAs that did not have their levels altered by NS1 in the total cell extract but showed increased nuclear/cytoplasmic ratios in the presence of NS1 and reduced nuclear/cytoplasmic ratios upon compound treatment, indicating release of mRNA export block by the compound. These mRNAs were then subjected to gene set enrichment analysis. As shown in Fig. S2 D, a major response network of mRNAs released into the cytoplasm by 1 included the hypoxia-inducible factor 1 α (HIF1-α) pathway, which is involved in antiviral response. Changes in the nuclear/cytoplasmic ratios of HIF1-α and PDGF-α, which is connected to the HIF1-α pathway, were further confirmed by quantitative PCR (Fig. 5 A). In addition, expression of HIF1-α at the protein level was reduced in the presence of NS1 but was restored in the presence of NS1 and a compound (Fig. 5 B). HIF induction by the hypoxia mimetic cobalt chloride results in cellular resistance to virus infection, and inhibition of HIF expression by siRNAs or by a small molecule antagonist increases susceptibility to viral infection, enhancing virus-mediated cell death and replication (Zinkernagel et al., 2007). Furthermore, HIF1-α is an interferon-responsive gene (de Veer et al., 2001), and PDGF-α synergizes with interferon to regulate gene expression (Dhillon et al., 2007). Thus, these findings showed that the release of NS1-mediated nuclear export block by DHODH inhibition resulted in nuclear export and expression of mRNAs involved in antiviral response.
The reversal of the nuclear export block by 1-14 was also detected in cells expressing VSV M protein, which inhibits host mRNA nuclear export (Her et al., 1997; von Kobbe et al., 2000; Enninga et al., 2002; Faria et al., 2005), an effect that is antagonized by interferons (Enninga et al., 2002; Faria et al., 2005). We found that inhibition of gene expression by M protein is reverted by 1-14 (Fig. S2 E). In addition, 1-14 reverted the nuclear export block of mRNAs involved in antiviral response, such as CREBZF, PRDII-BF1, and HIF1-α (Fig. S2 F and Table S11). CREBZF is a transcription activator that suppresses expression of herpes simplex virus proteins (Lu and Misra, 2000; Akhova et al., 2005), and PRDII-BF1 is a DNA-binding protein that positively regulates interferon β expression (Fan and Maniatis, 1990). Thus, upon mRNA export block, DHODH inhibition induces nuclear export of mRNAs involved in antiviral response in the presence of M protein.
One key mechanism involved in NS1-mediated block of host gene expression is inhibition of nuclear mRNA processing and export, which occurs via interaction of NS1 with the polyadenylation factor CPSF30 and mRNA export factors, including NXF1 and NXT1/p15 (Nemeroff et al., 1998; Satterly et al., 2007). Overexpression of NXF1 and or NXT1 is known to promote mRNA export (Grüter et al., 1998; Braun et al., 2001; Satterly et al., 2007) and can blunt NS1 inhibition (Satterly et al., 2007). Thus, inhibition of pyrimidine biosynthesis may enhance the activity of these host factors, or affect their turnover, overcoming NS1 inhibition. In fact, we found that although DHODH inhibition did not alter NXF1 mRNA levels or intracellular distribution, it increased NXF1 protein levels in the presence of NS1 (Fig. 5 C). In addition, the DHODH inhibitor lost its activity upon NXF1 knockdown (Fig. 5 D). These results indicate that high levels of NXF1 induced by DHODH inhibition in the presence of NS1 promote mRNA export and that NXF1 is required for compound activity.
Thus, in addition to the known effect of pyrimidine levels on viral RNA synthesis, our findings demonstrate a novel role for pyrimidines as regulators of host mRNA nuclear export block induced by virulence factors of evolutionarily diverse viruses. Further understanding of pyrimidine-mediated regulation of virulence factor interaction with the mRNA export machinery may reveal additional antiviral strategies with broad spectrum.
Materials and methods
Reagents
MDCK cells were obtained from the American Type Culture Collection and cultured in DME (Invitrogen) containing 10% fetal bovine serum and 1% penicillin (Invitrogen). The immortalized HBECs (Ramirez et al., 2004) were obtained originally from J. Minna (University of Texas Southwestern Medical Center, Dallas, TX) and were cultured in keratinocyte serum-free medium (Invitrogen). The following antibodies were used for immunoblot analysis: influenza virus proteins (B65141G; Biodesign/Meridian Life Science), NP (influenza virus nucleoprotein; ab20343; Abcam), NS1 (Solórzano et al., 2005), M1 (Bourmakina and García-Sastre, 2005), PB1 (SC-17601; Santa Cruz Biotechnology, Inc.), β-actin (Sigma-Aldrich), NXF1/TAP (tip-associated protein; Proteintech), Sp1 (Millipore), tubulin (Sigma-Aldrich), HIF1-α polyclonal antibody (obtained from J. Brugarolas, University of Texas Southwestern Medical Center, Dallas, TX; Bethyl Laboratories, Inc.), Nup98 (Radu et al., 1995), and Rae1 (Pritchard et al., 1999). Antibodies against VSV G, N, and P proteins were a gift from G. Barber (University of Miami School of Medicine, Miami, FL; Balachandran and Barber, 2004). We generated the VSV M protein rabbit polyclonal antibody from full-length recombinant M protein. The plasmids pCMV-luciferase, expressing luciferase, and pCAGGS-NS1, expressing NS1, were used in the luciferase reporter gene assays. pEGFPN3-M-GFP was a gift from E. Izaurralde (Max Planck Institute for Developmental Biology, Tübingen, Germany). The NXF1 siRNA pool and control siRNA were obtained from Thermo Fisher Scientific.
Luciferase reporter gene assay
293T cells were transfected with a 10:1 ratio of plasmid pCMV-luciferase encoding luciferase and/or pCAGGS-NS1 encoding NS1 using Lipofectamine 2000 (Invitrogen). Cells were transfected with the luciferase plasmid alone and empty vector as a positive control. Luciferase activity was measured in a luminometer (Fluoroskan Ascent; Thermo Fisher Scientific; Mata et al., 2011).
Synthesis and structure of quinoline carboxylic acids
Reactions were performed under air or dry argon in oven-dried glassware. All fine chemicals were obtained from Sigma-Aldrich. 1H and 13C spectra were recorded on a spectrometer (500; Varian) in DMSO-d6 with tetramethylsilyl as the internal standard, chemical shifts (δ) are reported in parts per million downfield of tetramethylsilyl, and coupling constants (J) are expressed in hertz. All the compounds were synthesized after a modified literature protocol (Mueller and Stobaugh, 1950).
Synthesis of 6-chloro-2-(4-ethoxyphenyl)quinoline-4-carboxylic acid (1)
 |
Into a flame-dried round-bottomed flask fitted with a reflux condenser was weighed 501 mg 4-chloroisatin (2.76 mmol, 1.0 equivalents). 5.5 ml ethanol was added to the flask. An ethanolic solution of 474 mg 4-ethoxyacetophenone (2.90 mmol, 1.05 equivalents) was added into the flask followed by the gradual addition of 447 mg KOH (dissolved in 500 µl H2O; 8.0 mmol, 2.9 equivalents). The flask was refluxed under an atmosphere of argon for 48 h. It was then cooled to room temperature, and the ethanol was removed using a rotary evaporator (Buchi). Into the residue was added 1 M aqueous hydrochloride acid until the pH became 2.0. The precipitate was collected by filtration, washed with brine, and dried under a vacuum. The crude product was purified via recrystallization from acetic acid obtained as light yellow powder with a yield of 452.3 mg (50%). 1H nuclear magnetic resonance (NMR; 500 MHz; DMSO-d6) was calculated as 1.38 (doublet [d], J = 8.1 Hz, 3H), 4.14 (quadruplet [q], J = 8.3 Hz, 2H), 7.10 (d, J = 8.0 Hz, 2H), 7.84 (d, J = 9.1 Hz, 1H), 8.12 (d, J = 8.3 Hz, 1H), 8.25 (d, J = 8.3 Hz, 2H), 8.48 (singlet [s], 1H), and 8.76 (s, 1H); 13C NMR (125 MHz; DMSO-d6) was calculated as 15.3, 64.0, 115.5, 120.7, 124.8, 125.1, 129.4, 130.6, 131.3, 132.2, 132.4, 137.2, 147.6, 156.6, 161.0, and 168.0. High resolution mass spectrometry (MS; HRMS) electrospray ionization (ESI−) calculated for C18H13ClNO3 (mass of protonated molecule [MH]) was 326.0589; found HRMS was 326.0593.
Synthesis of 6-chloro-2-(4-fluorophenyl)quinoline-4-carboxylic acid (1-4)
 |
Into a flame-dried round-bottomed flask fitted with a reflux condenser was weighed 501 mg 4-chloroisatin (2.76 mmol, 1.0 equivalents). 5.5 ml ethanol was added to the flask. An ethanolic solution of 350 µl 4-fluoroacetophenone (2.90 mmol, 1.05 equivalents) was added into the flask followed by the gradual addition of 447 mg KOH (dissolved in 500 µl H2O; 8.0 mmol, 2.9 equivalents). The flask was refluxed under an atmosphere of argon for 48 h. It was then cooled to room temperature, and the ethanol was removed using a rotary evaporator. Into the residue was added 1 M aqueous hydrochloride acid until the pH became 2.0. The precipitate was collected by filtration, washed with brine, and dried under a vacuum. The crude product was purified via recrystallization from acetic acid obtained as light brown powder with a yield of 349 mg (42%). 1H NMR (500 MHz; DMSO-d6) was calculated as 7.40 (triplet [t], J = 8.8 Hz, 2H), 7.85 (dd, J = 9.1 and 2.3 Hz, 1H), 8.13 (d, J = 8.9 Hz, 1H), 8.34 (dd, J = 8.5 and 5.7 Hz, 2H), 8.50 (s, 1H), and 8.77 (s, 1H); 13C NMR (125 MHz; DMSO-d6) was calculated as 116.4 (d, J = 16.5 Hz), 120.7, 124.9, 125.2, 130.1 (d, J = 7.08 Hz), 131.1, 132.3, 132.8, 134.7, 138.0, 147.4, 155.8, 164.2 (d, J = 241 Hz), and 167.9. HRMS (ESI−) calculated for C16H8ClFNO2 (MH) was 300.0233; found HRMS was 300.0244.
Synthesis of 6-chloro-2-(4-(trifluoromethoxy)phenyl)quinoline-4-carboxylic acid (1-9)
 |
Into a flame-dried round-bottomed flask fitted with a reflux condenser was weighed 501 mg 4-chloroisatin (2.76 mmol, 1.0 equivalents). 5.5 ml ethanol was added to the flask. An ethanolic solution of 463 µl 4-trifluoromethoxyacetophenone (2.90 mmol, 1.05 equivalents) was added into the flask followed by the gradual addition of 447 mg KOH (dissolved in 500 µl H2O; 8.0 mmol, 2.9 equivalents). The flask was refluxed under an atmosphere of argon for 48 h. It was then cooled to room temperature, and the ethanol was removed using a rotary evaporator. Into the residue was added 1 M aqueous hydrochloride acid until the pH became 2.0. The precipitate was collected by filtration, washed with brine, and dried under a vacuum. The crude product was purified via recrystallization from acetic acid obtained as light pink powder with a yield of 416.1 mg (41%). 1H NMR (500 MHz; DMSO-d6) was calculated as 7.50 (d, J = 8.3 Hz, 2H), 7.71 (d, J = 9.1 Hz, 1H), 8.03 (d, J = 9.1 Hz, 1H), 8.29 (s, 1H), 8.35 (d, J = 8.4 Hz, 2H), and 8.98 (s, 1H); 13C NMR (125 MHz; DMSO-d6) was calculated as 23.0, 118.6, 121.8, 126.4, 127.1, 129.8, 130.4, 131.1, 131.8, 138.4, 147.4, 148.6, 150.0, 155.5, and 173.8. HRMS (ESI−) calculated for C17H8ClF3NO3 (MH) was 366.0150; found HRMS was 366.0154.
Synthesis of 6-chloro-2-p-tolylquinoline-4-carboxylic acid (1-10)
 |
Into a flame-dried round-bottomed flask fitted with a reflux condenser was weighed 501 mg 4-chloroisatin (2.76 mmol, 1.0 equivalents). 5.5 ml ethanol was added to the flask. An ethanolic solution of 388 mg 4-methylacetophenone (2.90 mmol, 1.05 equivalents) was added into the flask followed by the gradual addition of 447 mg KOH (dissolved in 500 µl H2O; 8.0 mmol, 2.9 equivalents). The flask was refluxed under an atmosphere of argon for 48 h. It was then cooled to room temperature, and the ethanol was removed using a rotary evaporator. Into the residue was added 1 M aqueous hydrochloride acid until the pH became 2.0. The precipitate was collected by filtration, washed with brine, and dried under a vacuum. The crude product was purified via recrystallization from acetic acid obtained as yellow powder with a yield of 434.5 mg (53%). 1H NMR (500 MHz; DMSO-d6) was calculated as 2.41 (s, 3H), 7.39 (d, J = 8.0 Hz, 2H), 7.86 (d, J = 9.0 Hz, 1H), 8.16 (d, J = 9.0 Hz, 1H), 8.20 (d, J = 8.5 and 5.7 Hz, 2H), 8.53 (s, 1H), and 8.77 (s, 1H); 13C NMR (125 MHz; DMSO-d6) was calculated as 21.6, 121.0, 124.8, 125.0, 127.8, 130.3, 131.2, 132.4, 132.8, 135.4, 136.5, 140.7, 147.6, 156.9, and 167.7. HRMS (ESI−) calculated for C17H11ClNO2 (MH) was 296.0484; found HRMS was 296.0498.
Synthesis of 6-fluoro-2-(4-phenoxyphenyl)quinoline-4-carboxylic acid (1-14)
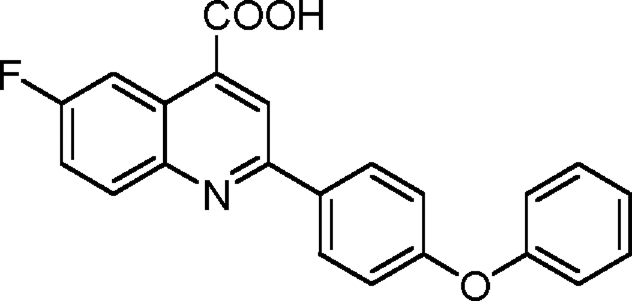 |
Into a flame-dried round-bottomed flask fitted with a reflux condenser was weighed 500 mg 4-fluoroisatin (3.03 mmol, 1.0 equivalents). 5.5 ml ethanol was added to the flask. An ethanolic solution of 675 mg 4-phenoxyacetophenone (3.18 mmol, 1.05 equivalents) was added into the flask followed by the gradual addition of 494 mg KOH (dissolved in 500 µl H2O; 8.8 mmol, 2.9 equivalents). The flask was refluxed under an atmosphere of argon for 48 h. It was then cooled to room temperature, and the ethanol was removed using a rotary evaporator. Into the residue was added 1 M aqueous hydrochloride acid until the pH became 2.0. The precipitate was collected by filtration, washed with brine, and dried under a vacuum. The crude product was purified via recrystallization from acetic acid obtained in light brown powder with a yield of 468.2 mg (43%). 1H NMR (500 MHz; DMSO-d6) was calculated as 7.13 (multiplet [m], 4H), 7.21 (triplet [t], J = 7.4 Hz, 1H), 7.44 (t, J = 7.7 Hz, 2H), 7.72 (dt, J = 8.5 and 2.8 Hz, 1H), 8.16 (dd, J = 9.3 and 5.9 Hz, 1H), 8.27 (d, J = 8.7 Hz, 2H), and 8.47 (m, 2H); 13C NMR (125 MHz; DMSO-d6) was calculated as 110.1 (d, J = 28.2 Hz), 119.0, 120.0, 120.5, 120.6 (d, J = 26.0 Hz), 125.1, 125.2 (d, J = 12.5 Hz), 129.6, 130.9, 132.9 (d, J = 12.1 Hz), 133.4, 146.4, 155.3, 156.6, 159.2, 160.9 (d, J = 244.3 Hz), and 168.3. HRMS (ESI−) calculated for C22H13FNO3 (MH) was 358.0885; found HRMS was 358.0891.
DHODH purification
The gene encoding an N-terminal truncation of human DHODH was amplified from a cDNA library derived from human pituitary gland (Takara Bio Inc.; Baldwin et al., 2002) and cloned into pET-28b (EMD) protein overexpression vector to generate a construct with a His6 C-terminal tag. Proteins were expressed in Terrific Broth medium containing 50 µg/ml kanamycin (pET28b). Cells were grown to 0.8 OD600 at 37°C, 0.2 mM IPTG was added to induce protein expression, and cells were grown overnight at 16°C. Cells were pelleted by centrifugation (4,000 g) and resuspended in lysis buffer (100 mM Hepes, pH 8.0, 150 mM NaCl, 10% glycerol, and 0.05% Thesit detergent [Fluka]), containing protease inhibitor cocktail for the His tag protein (Sigma-Aldrich). Cells were lysed by three passes through a high pressure homogenizer (EmulsiFlex-C5; Avestin, Inc.), the lysate was clarified by centrifugation (20,000 g), and the resulting supernatant was applied to a high performance purification column (HisTrap; GE Healthcare) precharged with Ni+2. The column was sequentially washed with lysis buffer and lysis buffer containing 20 mM imidazole. DHODH was eluted from the column using a linear gradient from 20 to 400 mM imidazole. Fractions containing DHODH were pooled, concentrated with a concentrator (Amicon Ultra; Millipore), and then purified by gel filtration column chromatography on a Superdex 200 column (HiLoad 16/60; GE Healthcare) equilibrated with crystallization buffer (10 mM Hepes, pH 7.8, 100 mM NaCl, 1 mM N,N-dimethyldodecylamine N-oxide [Fluka], 5% glycerol, and 10 mM DTT).
Enzyme assay and IC50 determination protocol
A dye-based assay that couples the oxidation of CoQ to the reduction of 2,6-dichloroindophenol (DCIP) was followed at 600 nm (molar extinction coefficient [e] = 18.8 mM−1cm−1). Enzyme stocks were diluted into an assay buffer (100 mM Hepes, pH 8.0, 150 mM NaCl, 10% glycerol, and 0.1% Triton X-100) containing 0.1 mM BSA to make a 100× working stock solution. Assays were initiated by adding enzyme into assay buffer containing substrates and inhibitors (final volume of 0. 5 ml) using the following conditions: DHODH (total enzyme concentration [ET] = 5–10 nM), substrates (0.2 mM l-dihydroorotate and 0.02 mM CoQD), 0.12 mM DCIP, and an inhibitor at 20°C. To determine half maximal inhibitory concentrations (IC50’s), the inhibitor concentration was varied in a threefold dilution series (0.01–100 µM). Data were collected on a spectrophotometer (DU 650; Beckman Coulter) using a six-cell auto sampler and an interval time of 12 s. The assay was followed for 6 min, and rate data (antibodies per minute) were extracted from the initial rates portion of the curve. Rate data (v) were converted to micromoles per minute using the molar extinction coefficient for DCIP. A77 1726 was a gift from P. Rathod (University of Washington, Seattle, WA).
Calculations.
The percentage of inhibition relative to the no inhibitor control was determined (vi/vo × 100), and data were fitted to the log[I] versus response (three parameters) equation in Prism (GraphPad Software) to determine the IC50. Reported error represents the 95% confidence interval of the fit.
Model of 1-14 bound to human DHODH generated by DOCK
The structure of 1-14 was drawn with Sketcher through the CCP4 suite (Collaborative Computational Project, Number 4, 1994) and then verified with COOT (Crystallographic Object-Oriented Toolkit; Emsley et al., 2010). The x-ray structure coordinates (2B0M; Hurt et al., 2006) of human DHODH bound to the brequinar derivative ABBA was used for the docking analysis. First, ABBA was removed from the coordinates, and the receptor file of 2B0M(-ABBA) and the ligand file of inhibitor were prepared using program Chimera (Pettersen et al., 2004). Then, the surface file of 2B0M(-ABBA) was generated with Chimera, and the sphere file around 2B0M(-ABBA) was generated by the program Sphgen under DOCK (University of California, San Francisco; Kuntz et al., 1982). Next, a subset of spheres (clusters) of 2B0M(-ABBA) representing the binding site were selected and ranked using the program Showsphere under DOCK. The first and largest cluster was selected, and a box around the active site was generated by Showbox. Files of the rapid score evaluation for contact and energy scoring were generated using Grid. The Flexible Ligand option was used to run DOCK generating the structure of 1-14 docked to human DHODH as displayed in Fig. 4 B. The structure was displayed using PyMol.
Measurements of cellular UMP, UDP, and UTP levels
Metabolites were extracted from HBECs using cold (−20°C) 50% methanol. Extracts were dried down, resuspended in 10 mM tributylamine/15 mM acetic acid, pH 5.0, and filtered through a 0.2-µm spin column. The liquid chromatography MS/MS instrumentation used for quantitation of glutamine was an HPLC (Prominence LC20/SIL-20AC; Shimadzu) coupled to a triple quadruple mass spectrometer (3200 QTRAP; AB SCIEX). Metabolites were separated chromatographically on a C18-based column with polar embedded groups (150 × 2.0 mm at 4 µm; Synergi Fusion; Phenomenex) using a tributylammonium acetate/methanol gradient and subjected to MS/MS analysis—flow rate was 0.5 ml/min using the following method: buffer A (10 mM tributylamine adjusted with 15 mM acetic acid to pH 5.0) and buffer B (100% methanol). At the following times, concentrations were as follows: t = 0 min, 0% buffer B; t = 2 min, 0% buffer B; t = 13 min, 100% buffer B; t = 15 min, 100% buffer B; t = 16 min, 0% buffer B, t = 20 min, 0% buffer B; and t = 20.1 min, stop. The best multiple reaction monitoring (MRM) transitions in negative mode for UMP, UDP, and UTP were identified through quantitative optimization and indicated in Fig. 1 F. UMP, UDP, and UTP standards were injected to confirm MRM transitions and elution time. Peaks were quantitated and normalized against the total ion count using Analyst 1.4 software (Applied Biosystems).
Influenza virus replication
MDCK or HBEC cells were infected with A/WSN/1933 at an MOI of 0.001 or an MOI of 0.01, respectively, for 48 h in the absence or presence of the depicted compounds. Compounds were added 1 h after infection. Virus titers were measured by plaque assays. Assays were performed in triplicate from independent infections.
VSV replication assay
MDCK or HBEC cells were infected with VSV-GFP (Indiana strain) at an MOI of 0.001 in the absence or presence of 1 or its analogues at concentrations depicted in the figures. At 48 h after infection, supernatants were used for titration on BHK cells.
Immunoblot analysis
Western blots were performed as we previously described (Chakraborty et al., 2008).
Oligo d(T) in situ hybridization
Poly(A)+ RNA distribution was analyzed in HeLa cells or HBECs. To perform oligo (dT) in situ hybridization simultaneously with immunofluorescence (Chakraborty et al., 2006), cells were fixed with paraformaldehyde, permeabilized with Triton X-100, and labeled with primary antibodies. The primary antibodies were diluted in PBS containing 0.2% Triton X-100, 1 mM DTT, and 200 U/ml RNasin (Promega). Cells were again fixed with paraformaldehyde and washed with PBS. Oligo (dT) in situ hybridization was then performed at 42°C overnight with a biotinylated oligo (dT) probe. Samples were washed with 2 and 0.5× SSC at 42°C. Cells were then fixed with formaldehyde, washed in PBS, and incubated for 30 min at room temperature with CY3-streptavidin (Sigma-Aldrich) and FITC-donkey anti–rabbit antibodies (Jackson ImmunoResearch Laboratories, Inc.), to detect NS1 protein, or FITC-donkey anti–goat antibodies (Jackson ImmunoResearch Laboratories, Inc.), to detect influenza proteins. Cells were washed in PBS, stained with DAPI, and mounted on glass slides using mounting medium (Dako). Images were acquired at room temperature with AxioVision 4.8.2.0 software on a camera (AxioCam MRm model 0445–554) in an inverted microscope (Axiovert 200M; Carl Zeiss). The Plan Neofluar 100×/1.30 NA objective oil lens was used. Images were processed using Photoshop and Illustrator (Adobe).
Generation of WSN:delNS1 virus
The NS1 segment carrying deletion of entire NS1 open reading frame (deletion of 58–516 nucleotides) was generated using fusion PCR and cloned into pDZ vector using the SapI site. WSN:del NS1 virus was generated using a reverse genetics system. In brief, 0.5 µg of each of eight pDZ plasmids representing the eight segments of the influenza A virus genome was transfected into 293T cells using Lipofectamine 2000. 24 h after transfection, the 293T cells were co-cultured with an NS1 complementing MDCK cells stably expressing NS1-GFP. The cell culture supernatants were passaged into fresh MDCK cells every 2 d and monitored for cytopathic effect. The successful rescue of virus was confirmed by performing a hemagglutination assay on the supernatants with chicken red blood cells. After three rounds of plaque purification and sequence confirmation, viral stocks were grown and titered in MDCK NS1-GFP cells.
NXF1 knockdown, nuclear/cytoplasmic fractionation, and quantitative PCR
293T cells were cotransfected with control siRNA and empty vector, control siRNA plasmids encoding NS1, NXF1 siRNA and empty vector, or NXF1 siRNA and plasmid encoding NS1 for 36 h. Then, cells were untreated or treated with 1 µM 1-14 for 24 h. RNA was purified from total cell extracts, nuclear fractions, and cytoplasmic fractions and subjected to real-time RT-PCR (Wang et al., 2006).
Cytotoxicity measurements
Compound 1 was dissolved in sterile DMSO (Sigma-Aldrich) at a stock concentration of 10 mM. Compound 1 was then diluted in MEM (Invitrogen) to final concentrations depicted in Fig. 1. MDCK cells were infected with A/WSN/1033 at an MOI of 0.001. 1 h after infection, compound 1 was added. After 48 h of compound addition, cells were lysed, and ATP levels were measured by luminescence using a cell viability kit (CellTiter-Glo; Promega) following the manufacturer’s instructions.
Minigenome assay
293T cells were seeded in 24-well plates 24 h before transfection. Cells were transfected using Lipofectamine 2000 according to the manufacturer’s instructions with 100 ng pCAGGS-PB1, -PB2, and -PA, 200 ng pCAGGS-NP (of A/WSN/1933 or A/Viet Nam/1203/2004, respectively), 200 ng pLuc-Firefly-spNP, and 100 ng pCMV-renilla-luciferase. Compounds were added immediately after transfection. Activity of the reconstituted WSN polymerase complex was determined by luciferase reporter activity 24 h after transfection by dual luciferase assay (Promega) according to the manufacturer’s instruction.
Human biochemical network (Tatebe et al., 2010)
We have constructed a hybrid Homo sapiens interaction and reaction network by combining protein–protein interactions with directional signal transduction and metabolic reactions. Interaction information from IntAct (Kerrien et al., 2007), NetworKin (Linding et al., 2007), the Human Protein Reference Database (Keshava Prasad et al., 2009), and from Palsson’s group have been used yielding a network of ∼21,000 nodes (genes, proteins, and small chemicals) as well as ∼132,000 interactions (gene–protein and protein–protein) and reactions (chemical, protein phosphorylation, etc.). The dataset was filtered to include only direct and physical interactions between human proteins, and all loops and duplicate edges were removed. Although, duplicate edges from different data sources and different property (e.g., an interaction identified as generic protein–protein interaction in one dataset and predicted as phosphorylation of a protein by a kinase in another dataset) were kept to emphasize the importance/validity of such interactions.
Microarray analysis
DHODH inhibitor did not alter bulk gene expression (Table S9).
HBECs were incubated with 5 µM compound 1 for 3, 6, or 12 h or with compound 1-14 for 6 or 12 h. RNA was isolated using the RNeasy Mini kit (Invitrogen) following the manufacturer’s instructions. cDNA was synthesized, labeled, and hybridized to a HumanRef-8 BeadChip 22K (Illumina). After baseline correction and normalization of the expression data from the Illumina bead array, we further filtered the expression profile by omitting entries with a p-value of 0.05 or greater. Fold changes between test and reference sets have been calculated. For genes with multiple oligonucleotide probes, fold changes have been calculated before the calculation of means. Only test and reference pairs for each probe were used when both p-values were at or below the 0.05 cutoff value. The results are presented in the attached table Excel (Microsoft) file. Microarray data were deposited in GEO Datasets under accession no. GSE35117.
DHODH inhibitor regulates nucleocytoplasmic distribution of subsets of mRNAs in the presence of virulence factors (Table S10 and Table S11).
Five million 293T cells were nontransfected or transfected with 6 µg pCAGGS-NS1 or pEGFPN3-M-GFP for 16 h. Then, cells were untreated or treated with 5 µM 1 for 24 h. RNA from total cell extracts or from nuclear or cytoplasmic fractions was obtained (Wang et al., 2006). cDNA was synthesized, labeled, and hybridized to HumanRef-8 BeadChip 22K. After baseline correction and normalization of the expression data from the Illumina bead array, we further filtered the expression profile by restricting entries to possess expression values within 10% of duplicate measurements. For genes with multiple oligonucleotide probes, ratios have been calculated before the calculation of means. Only test and reference pairs for each probe were used when duplicate measurements for both expression values were within 10%. We then focused our analysis on mRNAs that did not have their levels altered by NS1 in the total cell extract but showed increased nuclear/cytoplasmic ratios in the presence of NS1 and reduced nuclear/cytoplasmic ratios upon compound treatment, indicating release of mRNA export block. We then subjected the postprocessed gene expression data to Gene Set Enrichment Analysis (GSEA; Subramanian et al., 2005) using fold changes as ranks within the Prerank algorithm of the GSEA software with default parameters and 1,000 permutations. The curated C2/CP canonical pathways set v3.0 from the Molecular Signature Database at the Broad Institute has been used as reference gene sets for GSEA, consisting of sets of genes known to function in 880 pathways.
In parallel, we subjected highly responding genes for response network analysis. For this purpose, we have developed a computational method to identify response networks in large biological networks based on quantitative data (Cabusora et al., 2005; Mawuenyega et al., 2005). By superimposing gene expression data upon a large network, this method and the corresponding computer program NetworkExpress identifies k-shortest paths (Eppstein, 1998; Hershberger et al., 2007) between a set of seed genes, scoring the subnetwork spanned by the set of k-shortest paths that are shorter than a predefined maximum weighted length (l) and finding the enriched response networks. The initial seed genes have been selected from a list of genes with the highest (positive) fold release of mRNAs into the cytoplasm by compound treatment in cells transfected with NS1 as compared with cells untreated with compound and transfected with NS1. The fold release of mRNAs into the cytoplasm was calculated between nuclear/cytoplasmic ratios of mRNAs in both aforementioned conditions. Response networks have been calculated by restricting the human network to genes with fold release > 1 (no change in nuclear/cytoplasmic ratio upon compound treatment). All other genes and corresponding interactions have been deleted from the network, yielding 3,400 nodes and 9,400 interactions. We scored this network with fold release > 1 values and calculated a corresponding response network by using 100 genes with the highest fold release ratio.
X-ray structure of 1-14
Crystals grew as pale yellow prisms by slow evaporation from acetic acid. The data crystal was cut from a larger crystal and had approximate dimensions of 0.33 × 0.23 × 0.08 mm. The data were collected on a diffractometer (SCXmini; Rigaku) with a charge-coupled device (Mercury) using a graphite monochromator with MoK-α radiation (λ = 0.71073 Å). A total of 1,800 frames of data were collected using ω scans with a scan range of 0.5° and a counting time of 19 s per frame. The data were collected at 223 K using a low temperature device (Tech50; Rigaku). Details of crystal data, data collection, and structure refinement are listed in Tables S1, S2, S3, S4, S5, S6, and S7. Data reduction was performed using CrystalClear version 1.40 (Rigaku). The structure was solved by direct methods using SIR97 and refined by full-matrix least-squares on F2 with anisotropic displacement parameters for the non-H atoms using SHELXL-97. The hydrogen atoms on carbon were calculated in ideal positions with isotropic displacement parameters set to 1.2× equivalent isotopic value (Ueq) of the attached atom (1.5× Ueq for methyl hydrogen atoms). The acidic hydrogen atoms on O2 and O2a were observed in a ΔF amp and refined with isotropic displacement parameters. The function, Σw(|Fo|2 − |Fc|2)2, was minimized, in which w = 1/[(σ(Fo))2 + (0.0611 × P)2 + (0.5767 × P)] and P = (|Fo|2 + 2|Fc|2)/3. Rw(F2) refined to 0.167, with R(F) equal to 0.0626 and a goodness of fit (S) = 1.02. Definitions used for calculating R(F), Rw(F2), and the goodness of fit are given in this paragraph. The data were corrected for secondary extinction. The correction takes the form: Fcorr = kFc/[1 + (1.5(6) × 10−6) × Fc2 λ3/(sin2θ)]0.25, in which k is the overall scale factor. Neutral atom scattering factors and values used to calculate the linear absorption coefficient are from the International Tables for x-ray Crystallography. All figures were generated using SHELXTL/PC. Tables of positional and thermal parameters, bond lengths and angles, torsion angles, and figures are found in the supplemental material. Rw(F2) = {Σw(|Fo|2 − |Fc|2)2/Σw(|Fo|)4}1/2, in which w is the weight given each reflection. R(F) = {Σ(|Fo| − |Fc|)/Σ|Fo|} was used for reflections with Fo > 4(σ(Fo)). S = [Σw(|Fo|2 − |Fc|2)2/(n − p)]1/2, in which n is the number of reflections and p is the number of refined parameters. Fo is the observed structure factor, and Fc is the calculated structure factor.
Online supplemental material
Fig. S1 shows the effects of 1 on cytotoxicity, viral protein expression, viral replication, and virus polymerase activity. Fig. S2 demonstrates the effects of 1 on influenza virus–mediated mRNA export block. Fig. S3 depicts the x-ray structure of 1-14. Table S1 shows crystallographic data for 1-14. Table S2 shows fractional coordinates and equivalent isotropic thermal parameters for the nonhydrogen atoms of 1-14. Table S3 shows bond lengths and angles for the nonhydrogen atoms of 1-14. Table S4 shows anisotropic thermal parameters for the nonhydrogen atoms of 1-14. Table S5 shows fractional coordinates and isotropic thermal parameters for the hydrogen atoms of 1-14. Table S6 demonstrates torsion angles for the nonhydrogen atoms of 1-14. Table S7 shows hydrogen bond lengths and angles for 1-14. Table S8 shows structure activity relationship experiments of quinoline carboxylic acids with respect to virus replication. Table S9 shows that the DHODH inhibitor did not alter bulk gene expression. Table S10 shows that DHODH inhibitor regulates nucleocytoplasmic distribution of subsets of mRNAs in the presence of NS1 protein. Table S11 shows that DHODH inhibitor regulates nucleocytoplasmic distribution of subsets of mRNAs in the presence of M protein. Online supplemental material is available at http://www.jcb.org/cgi/content/full/jcb.201107058/DC1.
Acknowledgments
We thank F.E. Mazouni for conducting the DHODH assays, R. Cadagan and O. Lizardo for assistance, and J. Brugarolas and P. Rathod for reagents.
This work was supported by National Institutes of Health grant R01 GM07159 to B.M.A. Fontoura, grants R01 AI079110 and R01AI089539 to B.M.A. Fontoura and M.G. Roth, the Diane and Hal Brierley distinguished Chair in Biomedical research and C06-RR15437 from the National Center for Research Resources to M.G. Roth, and National Institutes of Health grant 2R56AI53680 and the Welch Foundation I1257 to M.A. Phillips. M.A. Phillips holds the Carolyn R. Bacon Professorship in Medical Science. This work was also supported by National Institutes of Health grants R01AI28900 and U54AI057158 to D.E. Levy and National Institutes of Health grants R01AI046954, P01AI058113, U54AI057158, and U19AI083025 and the Center for Research on Influenza Pathogenesis, a National Institute for Allergy and Infectious Diseases Center of Excellence for Influenza Research and Surveillance, grant HHSN266200700010C to A. García-Sastre.
Footnotes
Abbreviations used in this paper:
- ABBA
- 3-amido-5-biphenyl-benzolic acid
- DCIP
- 2,6-dichloroindophenol
- DHODH
- dihydroorotate dehydrogenase
- ESI
- electrospray ionization
- HBEC
- human bronchial epithelial cell
- HIF
- hypoxia-inducible factor
- HRMS
- high resolution MS
- MRM
- multiple reaction monitoring
- MS
- mass spectrometry
- NMR
- nuclear magnetic resonance
- VSV
- vesicular stomatitis virus
References
- Akhova O., Bainbridge M., Misra V. 2005. The neuronal host cell factor-binding protein Zhangfei inhibits herpes simplex virus replication. J. Virol. 79:14708–14718 10.1128/JVI.79.23.14708-14718.2005 [DOI] [PMC free article] [PubMed] [Google Scholar]
- Balachandran S., Barber G.N. 2004. Defective translational control facilitates vesicular stomatitis virus oncolysis. Cancer Cell. 5:51–65 10.1016/S1535-6108(03)00330-1 [DOI] [PubMed] [Google Scholar]
- Baldwin J., Farajallah A.M., Malmquist N.A., Rathod P.K., Phillips M.A. 2002. Malarial dihydroorotate dehydrogenase. Substrate and inhibitor specificity. J. Biol. Chem. 277:41827–41834 10.1074/jbc.M206854200 [DOI] [PubMed] [Google Scholar]
- Batt D.G., Copeland N.G., Dowling R.L., Gardner T.L., Jones E.A., Orwat M.J., Pinto D.J., Pitts W.J., Magolda R.L., Jaffee B.D. 1995. Immunosuppressive structure-activity relationships of Brequinar and related cinchoninic acid derivatives. Bioorg. Med. Chem. Lett. 5:1549–1554 10.1016/0960-894X(95)00252-O [DOI] [PubMed] [Google Scholar]
- Batt D.G., Petraitis J.J., Sherk S.R., Copeland R.A., Dowling R.L., Taylor T.L., Jones E.A., Magolda R.L., Jaffee B.D. 1998. Heteroatom- and carbon-linked biphenyl analogs of Brequinar as immunosuppressive agents. Bioorg. Med. Chem. Lett. 8:1745–1750 10.1016/S0960-894X(98)00308-4 [DOI] [PubMed] [Google Scholar]
- Bernhoff E., Tylden G.D., Kjerpeseth L.J., Gutteberg T.J., Hirsch H.H., Rinaldo C.H. 2010. Leflunomide inhibition of BK virus replication in renal tubular epithelial cells. J. Virol. 84:2150–2156 10.1128/JVI.01737-09 [DOI] [PMC free article] [PubMed] [Google Scholar]
- Bourmakina S.V., García-Sastre A. 2005. The morphology and composition of influenza A virus particles are not affected by low levels of M1 and M2 proteins in infected cells. J. Virol. 79:7926–7932 10.1128/JVI.79.12.7926-7932.2005 [DOI] [PMC free article] [PubMed] [Google Scholar]
- Brass A.L., Huang I.C., Benita Y., John S.P., Krishnan M.N., Feeley E.M., Ryan B.J., Weyer J.L., van der Weyden L., Fikrig E., et al. 2009. The IFITM proteins mediate cellular resistance to influenza A H1N1 virus, West Nile virus, and dengue virus. Cell. 139:1243–1254 10.1016/j.cell.2009.12.017 [DOI] [PMC free article] [PubMed] [Google Scholar]
- Braun I.C., Herold A., Rode M., Conti E., Izaurralde E. 2001. Overexpression of TAP/p15 heterodimers bypasses nuclear retention and stimulates nuclear mRNA export. J. Biol. Chem. 276:20536–20543 10.1074/jbc.M100400200 [DOI] [PubMed] [Google Scholar]
- Buchkovich N.J., Yu Y., Zampieri C.A., Alwine J.C. 2008. The TORrid affairs of viruses: effects of mammalian DNA viruses on the PI3K-Akt-mTOR signalling pathway. Nat. Rev. Microbiol. 6:266–275 10.1038/nrmicro1855 [DOI] [PMC free article] [PubMed] [Google Scholar]
- Cabusora L., Sutton E., Fulmer A., Forst C.V. 2005. Differential network expression during drug and stress response. Bioinformatics. 21:2898–2905 10.1093/bioinformatics/bti440 [DOI] [PubMed] [Google Scholar]
- Chakraborty P., Satterly N., Fontoura B.M. 2006. Nuclear export assays for poly(A) RNAs. Methods. 39:363–369 10.1016/j.ymeth.2006.07.002 [DOI] [PubMed] [Google Scholar]
- Chakraborty P., Wang Y., Wei J.H., van Deursen J., Yu H., Malureanu L., Dasso M., Forbes D.J., Levy D.E., Seemann J., Fontoura B.M. 2008. Nucleoporin levels regulate cell cycle progression and phase-specific gene expression. Dev. Cell. 15:657–667 10.1016/j.devcel.2008.08.020 [DOI] [PMC free article] [PubMed] [Google Scholar]
- Chen S.F., Ruben R.L., Dexter D.L. 1986. Mechanism of action of the novel anticancer agent 6-fluoro-2-(2′-fluoro-1,1′-biphenyl-4-yl)-3-methyl-4-quinolinecarbo xylic acid sodium salt (NSC 368390): inhibition of de novo pyrimidine nucleotide biosynthesis. Cancer Res. 46:5014–5019 [PubMed] [Google Scholar]
- Chen S.F., Perrella F.W., Behrens D.L., Papp L.M. 1992. Inhibition of dihydroorotate dehydrogenase activity by brequinar sodium. Cancer Res. 52:3521–3527 [PubMed] [Google Scholar]
- Collaborative Computational Project, Number 4 1994. The CCP4 suite: programs for protein crystallography. Acta Crystallogr. D Biol. Crystallogr. 50:760–763 10.1107/S0907444994003112 [DOI] [PubMed] [Google Scholar]
- Cooray S. 2004. The pivotal role of phosphatidylinositol 3-kinase-Akt signal transduction in virus survival. J. Gen. Virol. 85:1065–1076 10.1099/vir.0.19771-0 [DOI] [PubMed] [Google Scholar]
- de Veer M.J., Holko M., Frevel M., Walker E., Der S., Paranjape J.M., Silverman R.H., Williams B.R. 2001. Functional classification of interferon-stimulated genes identified using microarrays. J. Leukoc. Biol. 69:912–920 [PubMed] [Google Scholar]
- Dhillon N.K., Peng F., Ransohoff R.M., Buch S. 2007. PDGF synergistically enhances IFN-gamma-induced expression of CXCL10 in blood-derived macrophages: implications for HIV dementia. J. Immunol. 179:2722–2730 [DOI] [PubMed] [Google Scholar]
- Ehrhardt C., Wolff T., Pleschka S., Planz O., Beermann W., Bode J.G., Schmolke M., Ludwig S. 2007. Influenza A virus NS1 protein activates the PI3K/Akt pathway to mediate antiapoptotic signaling responses. J. Virol. 81:3058–3067 10.1128/JVI.02082-06 [DOI] [PMC free article] [PubMed] [Google Scholar]
- Emsley P., Lohkamp B., Scott W.G., Cowtan K. 2010. Features and development of Coot. Acta Crystallogr. D Biol. Crystallogr. 66:486–501 10.1107/S0907444910007493 [DOI] [PMC free article] [PubMed] [Google Scholar]
- Enninga J., Levy D.E., Blobel G., Fontoura B.M. 2002. Role of nucleoporin induction in releasing an mRNA nuclear export block. Science. 295:1523–1525 10.1126/science.1067861 [DOI] [PubMed] [Google Scholar]
- Eppstein D. 1998. Finding the k shortest paths. SIAM J. Comput. 28:652–673 10.1137/S0097539795290477 [DOI] [Google Scholar]
- Fan C.M., Maniatis T. 1990. A DNA-binding protein containing two widely separated zinc finger motifs that recognize the same DNA sequence. Genes Dev. 4:29–42 10.1101/gad.4.1.29 [DOI] [PubMed] [Google Scholar]
- Faria P.A., Chakraborty P., Levay A., Barber G.N., Ezelle H.J., Enninga J., Arana C., van Deursen J., Fontoura B.M. 2005. VSV disrupts the Rae1/mrnp41 mRNA nuclear export pathway. Mol. Cell. 17:93–102 10.1016/j.molcel.2004.11.023 [DOI] [PubMed] [Google Scholar]
- García-Sastre A., Egorov A., Matassov D., Brandt S., Levy D.E., Durbin J.E., Palese P., Muster T. 1998. Influenza A virus lacking the NS1 gene replicates in interferon-deficient systems. Virology. 252:324–330 10.1006/viro.1998.9508 [DOI] [PubMed] [Google Scholar]
- Goldenberg M.M. 1999. Leflunomide, a novel immunomodulator for the treatment of active rheumatoid arthritis. Clin. Ther. 21:1837–1852 10.1016/S0149-2918(00)86732-6 [DOI] [PubMed] [Google Scholar]
- Grüter P., Tabernero C., von Kobbe C., Schmitt C., Saavedra C., Bachi A., Wilm M., Felber B.K., Izaurralde E. 1998. TAP, the human homolog of Mex67p, mediates CTE-dependent RNA export from the nucleus. Mol. Cell. 1:649–659 10.1016/S1097-2765(00)80065-9 [DOI] [PubMed] [Google Scholar]
- Hale B.G., Jackson D., Chen Y.H., Lamb R.A., Randall R.E. 2006. Influenza A virus NS1 protein binds p85beta and activates phosphatidylinositol-3-kinase signaling. Proc. Natl. Acad. Sci. USA. 103:14194–14199 10.1073/pnas.0606109103 [DOI] [PMC free article] [PubMed] [Google Scholar]
- Her L.-S., Lund E., Dahlberg J.E. 1997. Inhibition of Ran guanosine triphosphatase-dependent nuclear transport by the matrix protein of vesicular stomatitis virus. Science. 276:1845–1848 10.1126/science.276.5320.1845 [DOI] [PubMed] [Google Scholar]
- Herrmann M.L., Schleyerbach R., Kirschbaum B.J. 2000. Leflunomide: an immunomodulatory drug for the treatment of rheumatoid arthritis and other autoimmune diseases. Immunopharmacology. 47:273–289 10.1016/S0162-3109(00)00191-0 [DOI] [PubMed] [Google Scholar]
- Hershberger J., Maxel M., Suri S. 2007. Finding the k shortest simple paths: A new algorithm and its implementation. ACM Transactions on Algorithms. 3:45–es 10.1145/1290672.1290682 [DOI] [Google Scholar]
- Hoffmann H.H., Kunz A., Simon V.A., Palese P., Shaw M.L. 2011. Broad-spectrum antiviral that interferes with de novo pyrimidine biosynthesis. Proc. Natl. Acad. Sci. USA. 108:5777–5782 10.1073/pnas.1101143108 [DOI] [PMC free article] [PubMed] [Google Scholar]
- Huang M., Graves L.M. 2003. De novo synthesis of pyrimidine nucleotides; emerging interfaces with signal transduction pathways. Cell. Mol. Life Sci. 60:321–336 10.1007/s000180300027 [DOI] [PMC free article] [PubMed] [Google Scholar]
- Hurt D.E., Sutton A.E., Clardy J. 2006. Brequinar derivatives and species-specific drug design for dihydroorotate dehydrogenase. Bioorg. Med. Chem. Lett. 16:1610–1615 10.1016/j.bmcl.2005.12.029 [DOI] [PubMed] [Google Scholar]
- Karlas A., Machuy N., Shin Y., Pleissner K.P., Artarini A., Heuer D., Becker D., Khalil H., Ogilvie L.A., Hess S., et al. 2010. Genome-wide RNAi screen identifies human host factors crucial for influenza virus replication. Nature. 463:818–822 10.1038/nature08760 [DOI] [PubMed] [Google Scholar]
- Kerrien S., Alam-Faruque Y., Aranda B., Bancarz I., Bridge A., Derow C., Dimmer E., Feuermann M., Friedrichsen A., Huntley R., et al. 2007. IntAct—open source resource for molecular interaction data. Nucleic Acids Res. 35:D561–D565 10.1093/nar/gkl958 [DOI] [PMC free article] [PubMed] [Google Scholar]
- Keshava Prasad T.S., Goel R., Kandasamy K., Keerthikumar S., Kumar S., Mathivanan S., Telikicherla D., Raju R., Shafreen B., Venugopal A., et al. 2009. Human Protein Reference Database—2009 update. Nucleic Acids Res. 37(Suppl. 1):D767–D772 10.1093/nar/gkn892 [DOI] [PMC free article] [PubMed] [Google Scholar]
- König R., Stertz S., Zhou Y., Inoue A., Hoffmann H.H., Bhattacharyya S., Alamares J.G., Tscherne D.M., Ortigoza M.B., Liang Y., et al. 2010. Human host factors required for influenza virus replication. Nature. 463:813–817 10.1038/nature08699 [DOI] [PMC free article] [PubMed] [Google Scholar]
- Kuntz I.D., Blaney J.M., Oatley S.J., Langridge R., Ferrin T.E. 1982. A geometric approach to macromolecule-ligand interactions. J. Mol. Biol. 161:269–288 10.1016/0022-2836(82)90153-X [DOI] [PubMed] [Google Scholar]
- Lin Y.H., Yadav P., Ravatn R., Stollar V. 2000. A mutant of Sindbis virus that is resistant to pyrazofurin encodes an altered RNA polymerase. Virology. 272:61–71 10.1006/viro.2000.0329 [DOI] [PubMed] [Google Scholar]
- Linding R., Jensen L.J., Ostheimer G.J., van Vugt M.A., Jørgensen C., Miron I.M., Diella F., Colwill K., Taylor L., Elder K., et al. 2007. Systematic discovery of in vivo phosphorylation networks. Cell. 129:1415–1426 10.1016/j.cell.2007.05.052 [DOI] [PMC free article] [PubMed] [Google Scholar]
- Lu R., Misra V. 2000. Zhangfei: a second cellular protein interacts with herpes simplex virus accessory factor HCF in a manner similar to Luman and VP16. Nucleic Acids Res. 28:2446–2454 10.1093/nar/28.12.2446 [DOI] [PMC free article] [PubMed] [Google Scholar]
- Mata M.A., Satterly N., Versteeg G.A., Frantz D., Wei S., Williams N., Schmolke M., Peña-Llopis S., Brugarolas J., Forst C.V., et al. 2011. Chemical inhibition of RNA viruses reveals REDD1 as a host defense factor. Nat. Chem. Biol. 7:712–719 10.1038/nchembio.645 [DOI] [PMC free article] [PubMed] [Google Scholar]
- Mawuenyega K.G., Forst C.V., Dobos K.M., Belisle J.T., Chen J., Bradbury E.M., Bradbury A.R., Chen X. 2005. Mycobacterium tuberculosis functional network analysis by global subcellular protein profiling. Mol. Biol. Cell. 16:396–404 10.1091/mbc.E04-04-0329 [DOI] [PMC free article] [PubMed] [Google Scholar]
- Mueller G.P., Stobaugh R.E. 1950. Steric hindrance in the pfitzinger reaction. J. Am. Chem. Soc. 72:1598–1599 10.1021/ja01160a047 [DOI] [Google Scholar]
- Nemeroff M.E., Barabino S.M., Li Y., Keller W., Krug R.M. 1998. Influenza virus NS1 protein interacts with the cellular 30 kDa subunit of CPSF and inhibits 3’end formation of cellular pre-mRNAs. Mol. Cell. 1:991–1000 10.1016/S1097-2765(00)80099-4 [DOI] [PubMed] [Google Scholar]
- Olsen N.J., Stein C.M. 2004. New drugs for rheumatoid arthritis. N. Engl. J. Med. 350:2167–2179 10.1056/NEJMra032906 [DOI] [PubMed] [Google Scholar]
- Peters G.J., Schwartsmann G., Nadal J.C., Laurensse E.J., van Groeningen C.J., van der Vijgh W.J., Pinedo H.M. 1990. In vivo inhibition of the pyrimidine de novo enzyme dihydroorotic acid dehydrogenase by brequinar sodium (DUP-785; NSC 368390) in mice and patients. Cancer Res. 50:4644–4649 [PubMed] [Google Scholar]
- Pettersen E.F., Goddard T.D., Huang C.C., Couch G.S., Greenblatt D.M., Meng E.C., Ferrin T.E. 2004. UCSF Chimera—a visualization system for exploratory research and analysis. J. Comput. Chem. 25:1605–1612 10.1002/jcc.20084 [DOI] [PubMed] [Google Scholar]
- Phillips M.A., Rathod P.K. 2010. Plasmodium dihydroorotate dehydrogenase: a promising target for novel anti-malarial chemotherapy. Infect. Disord. Drug Targets. 10:226–239 [DOI] [PMC free article] [PubMed] [Google Scholar]
- Pitts W.J., Jetter J.W., Pinto D.J., Orwat M.J., Batt D.G., Sherk S.R., Petraitis J.J., Jacobson I.C., Copeland R.A., Dowling R.L., et al. 1998. Structure-activity relationships (SAR) of some tetracyclic heterocycles related to the immunosuppressive agent Brequinar Sodium. Bioorg. Med. Chem. Lett. 8:307–312 10.1016/S0960-894X(98)00010-9 [DOI] [PubMed] [Google Scholar]
- Pritchard C.E., Fornerod M., Kasper L.H., van Deursen J.M. 1999. RAE1 is a shuttling mRNA export factor that binds to a GLEBS-like NUP98 motif at the nuclear pore complex through multiple domains. J. Cell Biol. 145:237–254 10.1083/jcb.145.2.237 [DOI] [PMC free article] [PubMed] [Google Scholar]
- Qing M., Zou G., Wang Q.Y., Xu H.Y., Dong H., Yuan Z., Shi P.Y. 2010. Characterization of dengue virus resistance to brequinar in cell culture. Antimicrob. Agents Chemother. 54:3686–3695 10.1128/AAC.00561-10 [DOI] [PMC free article] [PubMed] [Google Scholar]
- Radu A., Moore M.S., Blobel G. 1995. The peptide repeat domain of nucleoporin Nup98 functions as a docking site in transport across the nuclear pore complex. Cell. 81:215–222 10.1016/0092-8674(95)90331-3 [DOI] [PubMed] [Google Scholar]
- Ramirez R.D., Sheridan S., Girard L., Sato M., Kim Y., Pollack J., Peyton M., Zou Y., Kurie J.M., Dimaio J.M., et al. 2004. Immortalization of human bronchial epithelial cells in the absence of viral oncoproteins. Cancer Res. 64:9027–9034 10.1158/0008-5472.CAN-04-3703 [DOI] [PubMed] [Google Scholar]
- Satterly N., Tsai P.L., van Deursen J., Nussenzveig D.R., Wang Y., Faria P.A., Levay A., Levy D.E., Fontoura B.M. 2007. Influenza virus targets the mRNA export machinery and the nuclear pore complex. Proc. Natl. Acad. Sci. USA. 104:1853–1858 10.1073/pnas.0610977104 [DOI] [PMC free article] [PubMed] [Google Scholar]
- Shapira S.D., Gat-Viks I., Shum B.O., Dricot A., de Grace M.M., Wu L., Gupta P.B., Hao T., Silver S.J., Root D.E., et al. 2009. A physical and regulatory map of host-influenza interactions reveals pathways in H1N1 infection. Cell. 139:1255–1267 10.1016/j.cell.2009.12.018 [DOI] [PMC free article] [PubMed] [Google Scholar]
- Shin Y.K., Liu Q., Tikoo S.K., Babiuk L.A., Zhou Y. 2007. Influenza A virus NS1 protein activates the phosphatidylinositol 3-kinase (PI3K)/Akt pathway by direct interaction with the p85 subunit of PI3K. J. Gen. Virol. 88:13–18 10.1099/vir.0.82419-0 [DOI] [PubMed] [Google Scholar]
- Smith D.J., Lapedes A.S., de Jong J.C., Bestebroer T.M., Rimmelzwaan G.F., Osterhaus A.D., Fouchier R.A. 2004. Mapping the antigenic and genetic evolution of influenza virus. Science. 305:371–376 10.1126/science.1097211 [DOI] [PubMed] [Google Scholar]
- Solórzano A., Webby R.J., Lager K.M., Janke B.H., García-Sastre A., Richt J.A. 2005. Mutations in the NS1 protein of swine influenza virus impair anti-interferon activity and confer attenuation in pigs. J. Virol. 79:7535–7543 10.1128/JVI.79.12.7535-7543.2005 [DOI] [PMC free article] [PubMed] [Google Scholar]
- Subramanian A., Tamayo P., Mootha V.K., Mukherjee S., Ebert B.L., Gillette M.A., Paulovich A., Pomeroy S.L., Golub T.R., Lander E.S., Mesirov J.P. 2005. Gene set enrichment analysis: a knowledge-based approach for interpreting genome-wide expression profiles. Proc. Natl. Acad. Sci. USA. 102:15545–15550 10.1073/pnas.0506580102 [DOI] [PMC free article] [PubMed] [Google Scholar]
- Tatebe K., Zeytun A., Ribeiro R.M., Hoffmann R., Harrod K.S., Forst C.V. 2010. Response network analysis of differential gene expression in human epithelial lung cells during avian influenza infections. BMC Bioinformatics. 11:170 10.1186/1471-2105-11-170 [DOI] [PMC free article] [PubMed] [Google Scholar]
- Versteeg G.A., García-Sastre A. 2010. Viral tricks to grid-lock the type I interferon system. Curr. Opin. Microbiol. 13:508–516 10.1016/j.mib.2010.05.009 [DOI] [PMC free article] [PubMed] [Google Scholar]
- von Kobbe C., van Deursen J.M., Rodrigues J.P., Sitterlin D., Bachi A., Wu X., Wilm M., Carmo-Fonseca M., Izaurralde E. 2000. Vesicular stomatitis virus matrix protein inhibits host cell gene expression by targeting the nucleoporin Nup98. Mol. Cell. 6:1243–1252 10.1016/S1097-2765(00)00120-9 [DOI] [PubMed] [Google Scholar]
- Waldman W.J., Knight D.A., Blinder L., Shen J., Lurain N.S., Miller D.M., Sedmak D.D., Williams J.W., Chong A.S. 1999. Inhibition of cytomegalovirus in vitro and in vivo by the experimental immunosuppressive agent leflunomide. Intervirology. 42:412–418 10.1159/000053979 [DOI] [PubMed] [Google Scholar]
- Wang Y., Zhu W., Levy D.E. 2006. Nuclear and cytoplasmic mRNA quantification by SYBR green based real-time RT-PCR. Methods. 39:356–362 10.1016/j.ymeth.2006.06.010 [DOI] [PubMed] [Google Scholar]
- Watanabe T., Watanabe S., Kawaoka Y. 2010. Cellular networks involved in the influenza virus life cycle. Cell Host Microbe. 7:427–439 10.1016/j.chom.2010.05.008 [DOI] [PMC free article] [PubMed] [Google Scholar]
- Zhirnov O.P., Klenk H.D. 2007. Control of apoptosis in influenza virus-infected cells by up-regulation of Akt and p53 signaling. Apoptosis. 12:1419–1432 10.1007/s10495-007-0071-y [DOI] [PubMed] [Google Scholar]
- Zinkernagel A.S., Johnson R.S., Nizet V. 2007. Hypoxia inducible factor (HIF) function in innate immunity and infection. J. Mol. Med. 85:1339–1346 10.1007/s00109-007-0282-2 [DOI] [PubMed] [Google Scholar]