Abstract
Nausea is a commonly occurring symptom typified by epigastric discomfort with the urge to vomit. To date, the brain circuitry underlying the autonomic nervous system response to nausea has not been fully understood. Functional MRI (fMRI), together with a point process adaptive recursive algorithm for computation of the high-frequency (HF) index of heart rate variability (HRV) was combined to evaluate the brain circuitry underlying autonomic nervous system response to nausea. Alone, the point process analysis revealed increasing sympathetic and decreasing parasympathetic response during nausea with significant increased heart rate (HR) and decreased HF. The combined HRV-fMRI analysis demonstrated that the fMRI signal in the medial prefrontal cortex (MPFC) and pregenual anterior cingulate cortex (pgACC), regions of higher cortical functions and emotion showed a negative correlation at the baseline and a positive correlation during nausea. Overall, our findings confirm a sympathovagal shift (toward sympathetic) during nausea, which was related to brain activity in regions associated with emotion and higher cognitive function.
I. Introduction
Nausea is a commonly occurring symptom typified by epigastric discomfort with the urge to vomit. It can arise from a variety of causes, for example as a side effect of pharmacotherapy and general anesthesia, or as a consequence of visual/vestibular sensory discordance. The latter cause, termed motion sickness, has been commonly adopted in experimental settings to study physiological responses to nausea [1–6].
Autonomic nervous system (ANS) outflow is critical in mediating the multiple organs’ response to nausea. Prior studies have monitored cardio-autonomic modulation by measures of heart rate (HR) and heart rate variability (HRV). Increased HR during motion sickness has been a consistent result [2–4], generally interpreted as an increased sympathetic response, while discrepancies in the HRV response to motion sickness have also been reported. In particular, high frequency (HF) HRV power has been found to decrease during motion sickness in one study [3], and increase in another [5]. In our previous results, we found that increasing nausea perception was associated with increase in both HR and low frequency (LF) HRV, and decrease in HF HRV power [7,8]. Our analysis used temporal windows, comparing the initial 5 minutes of baseline with 1-minute periods immediately following self-reported increasing levels of nausea.
While ANS response to nausea has been widely studied, the human brain circuitry underlying this ANS response has, to our knowledge, never been evaluated.
In this study, we hypothesize that interceptive, cognitive, and affective brain areas would be correlated with cardiovagal modulation (HF-HRV) during nausea. Our main goal is to reveal the brain circuitry underlying the ANS response (specifically cardiovagal modulation) to nausea. Hence, we have adapted our previously developed combined HRV-fMRI approach [12] to data collected during the induction of nausea.
II. Methods
A. Subjects
Twenty-one healthy right-handed subjects (all female) with a mean age of 28.4 years (s.d.=8.5) were recruited through advertisement and prescreened using previously tested screening methods as well as a mock MRI behavioral session that included exposure to the nauseagenic stimulus. Subjects advanced to the MRI session if they had increased susceptibility to motion sickness, as indicated by a score greater than 60 on the Motion Sickness Susceptibility Questionnaire [9], and sufficiently high levels of nausea (>2 on a scale from 0 to 4, see below) during the behavioral session. Informed consent was obtained from all participants, and the protocol was approved by the Human Research Committee of Massachusetts General Hospital.
B. Nauseagenic visual stimulation
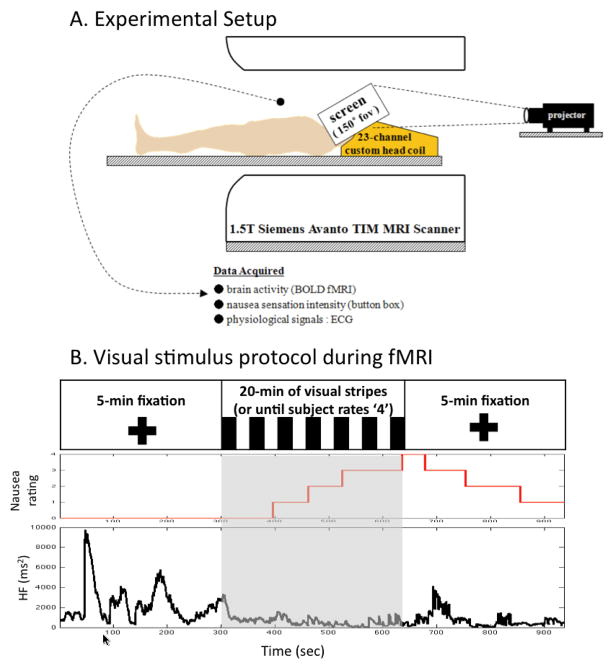
We have developed a novel approach to induce nausea inside an fMRI scanner which was a standardized visual presentation of alternating black (1.2cm, 6.9° viewing angle) and white stripes (1.85cm, 10.6° viewing angle) with left-to-right linear motion 62.5 °/sec. This stimulus was projected with a 150° field of view screen positioned to fill the subject’s full visual field. Subjects were asked to lie and stare ahead at a screen. After 5-minute baseline fixation on a black cross, the stimulus was presented for a maximum of 20 minutes, or stopped when subjects rated a nausea intensity of 4. The black cross for fixation was presented for 5 minutes after the visual stripes stimulus terminated. During and after the nausea stimulus subjects used a botton box to rate their overall nausea level ranging from “0” to “4” (“0” indicated no nausea, “1” indicated “mild” nausea, “2” “moderate” nausea, “3” “strong” nausea, and “4” indicated “severe” nausea approaching vomiting).
C. Physiological monitoring and scanning protocol
The electrocardiogram (ECG) was collected with an MRI-compatible Patient Monitoring system (Model 3150, Invivo Research Inc., Orlando, FL) through MRI-compatible electrodes (VerMed, Bellows Falls, VT) on the chest. During the experiment, skin conductance level and respiration was also measured. All physiological signals were collected at 400Hz using Chart Data Acquisition Software on a laptop using the Powerlab System (ADInstruments, Colorado Springs, CO). Functional MRI (fMRI) data were collected using a 1.5T Siemens Avanto Scanner with concurrent autonomic monitoring (Siemens Medical, Erlangen, Germany).
Whole brain Blood Oxygenation Level Dependent (BOLD) functional imaging was performed using a gradient echo T2*-weighted pulse sequence (TR/TE=3s/30ms, 43 slices, slice thickness = 3.6mm, matrix = 64 × 64, FOV = 200mm, FA=90) with our multi-channel coil. High-resolution T1-weighted structural imaging was completed with the MPRAGE pulse sequence (TR/TE/TI = 2730/3.39/1000 ms, slice thickness = 1.33 mm, FOV = 256mm, FA=7°). The general experimental setup is portrayed in Figure 1.
Figure 1.
Experimental protocol and representative subject response. (A) A customized 23-channels head coil and screen, allowing for a full field of view were used in the MRI scanner, (B) Subjects rated their nausea sensation using a button box while moving stripes were presented visually. A representative subject’s response, including HF-HRV, a nausea level of ‘4’ in this figure was reached at 363 sec after the visual stimulation began.
D. Data Analysis
BOLD data analysis was performed using a combination of analysis packages including FSL (FMRIB’s Software Library) and AFNI, and included fieldmap correction, brain extraction, motion correction, high pass filtering (f>0.007Hz), spatial smoothing (FWHM=5mm), and spatial normalization.
Waveform Database software library 10.3.11 (WFDB, PhysioNet, MIT, Cambridge, MA) was used to annotate ECG traces (R-R series). An adaptive recursive algorithm was applied to the R–R series to compute instantaneous estimates of heart rate and heart rate variability from electrocardiogram recordings of R-wave events. This approach is based on the point-process methods already used to develop both local likelihood [10] and adaptive [11] heart rate estimation algorithms. Such instantaneous assessment of heart rate variability has been validated successfully in conjunction with fMRI recordings to characterize brain correlates of autonomic modulation [12]. The stochastic structure in the R–R intervals is modeled as an inverse Gaussian renewal process. The inverse Gaussian probability density is derived directly from an elementary, physiologically-based integrate- and-fire model [10,11]. The model also represents the dependence of the R–R interval length on the recent history of parasympathetic and sympathetic inputs to the SA node by modeling the mean as a linear function of the last p R–R intervals. This set of p coefficients allows for estimation of the spectral power (HRV) and further decomposition into classic low frequency (LF, 0.04-0.15 Hz) and high frequency (HF, 0.15-0.5 Hz) spectral components.
The point-process recursive algorithm is able to estimate the dynamics of the model parameters, and consequently the time-varying behavior of each spectral index, at any time resolution. This statistical model for deriving the HRV timeseries has been cross-validated with standard time- frequency domain approaches for HRV analysis [10]. The dynamic response for the point-process method was found to provide a significant improvement in tracking fast dynamic changes when compared to the more conventional RLS algorithm [11]. A fixed order p=8 was chosen for the analysis. Indices were updated every 10 ms and then resampled at 2 Hz. The point processed HF was used to evaluate the brain areas controlling autonomic outflow response to nausea.
Physiological data and BOLD data were analyzed within the 5 minutes baseline period, as well as within the 5 minutes interval before the visual stimulation terminated, which was expected to comprise the most severe nausea experienced.
In order to evaluate the brain regions controlling autonomic outflow to nausea, a subject level fixed-effect analysis evaluated voxel-wise linear regression using subject’s HF-HRV as regressor. At the second stage, a mixed effects modeling approach was used to calculate group maps, these maps were corrected for multiple comparisons with a voxel-wise threshold Z>2.3 and cluster forming at p<0.05.
III. Results
Of the 21 subjects who completed the MRI session, 12 data sets were acceptable for analysis. ECG data from three subjects were not suitable due to MRI-associated artifacts. One subject was disqualified due to significant nausea perception at baseline, while another subject was disqualified due to a nausea level 4 reached too soon (195 sec) after initiation of visual stimulation (thus limiting the time window in which moderate/strong nausea could be assessed). Three subjects were not included because of excessive motion artifacts.
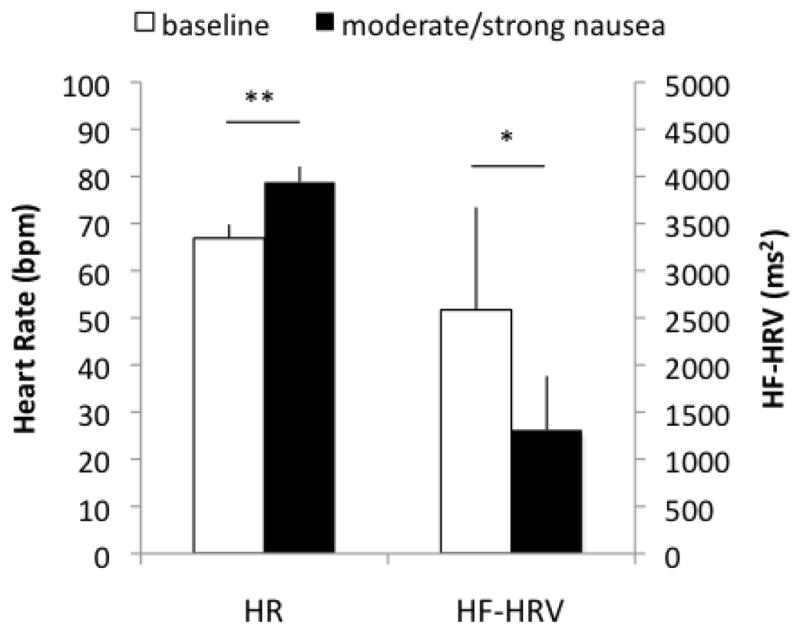
All 12 subjects reported a nausea sensation greater than 2 out of 4 (moderate/strong) during the final 5 minutes of stimulation. Increased HR (baseline: 66.9±2.9; nausea: 78.8±3.3 bpm, mean±SE) and decreased HF power (baseline: 2584.0±1089.6; nausea: 1310.3±572.8 ms2) were observed during nausea compared to baseline (Figure 2).
Figure 2.

Average across subjects (mean±SE) of heart rate (HR) and high frequency in heart rate variability (HF-HRV) for 5-min baseline and 5-min moderate/strong nausea. When comparing HR and HF-HRV during nausea with that baseline, there was increased HR and decreased HF-HRV. (**: p<0.01; *: p<0.05)
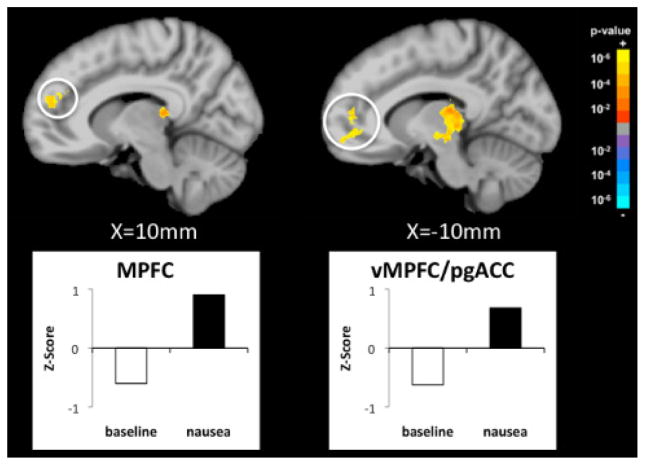
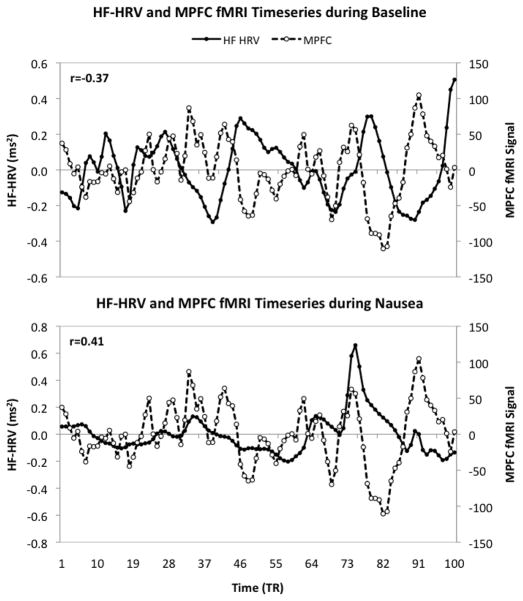
The combined HF HRV-fMRI analysis revealed specific brain areas associated with parasympathetic outflow, namely the medial prefrontal cortex (MPFC) and ventromedial prefrontal cortex/pregenual anterior cingulate cortex (vmPFC/pgACC) (Figure 3). FMRI signal in these brain areas was negatively correlated with HF-HRV during baseline, while a positive correlation was observed in MPFC and vmPFC/pgACC during moderate/strong nausea. This trend is demonstrated explicitly for a representative subject in Figure 4 by superimposing the HF-HRV and the MPFC fMRI timeseries during baseline and moderate/strong nausea.
Figure 3.
Changes in correlation between HF-HRV and fMRI signal (nausea – baseline). The medial prontal cortex (MPFC) and ventromedial prefrontal cortex/pregenual cingulate cortex (vmPFC/pgACC) show significant anti-correlation during baseline, while a positive correlation is found during moderate/strong nausea
Figure 4.
Correlation between fMRI signal in the medial prefrontal cortex (MPFC) and parasympathetic modulation (HF-HRV) during baseline and moderate/strong nausea for a representative subject. The MPFC showed anti-correlation with HF-HRV during baseline, while a positive correlation was found during nausea.
IV. Discussion & Conclusion
Our study presents a combined HRV-fMRI method assessing the central neural correlates of a continuous and causal estimate of cardiovagal activity as elicited by nausea. The brain areas of MPFC and vmPFC/pgACC were positively correlated with HF-HRV during moderate/strong nausea, while anti-correlation was found during resting baseline. One possible interpretation to this finding is that nausea is associated with a switch from inhibitory to excitatory influence on cardiovagal outflow by prefrontal cortical areas underlying higher cognitive integration (MPFC) [13], and emotion (pgACC) [14, 15].
MPFC is known to have projections to autonomic modulatory regions, such as midbrain PAG [16,17] and hypothalamus [18]. During nausea sensation, this higher cortical region may provide excitatory influence to these autonomic control regions and potentially cardiovagal premotor areas such as the nucleus ambiguous, which, while, not visualized here, may require a more brainstem-focused approach [12] to observe.
Previous studies have reported variable HRV response to nausea – e.g. decreased HF in the presence of a nauseagenic stimulation as compared to control baseline conditions [5], an increased in HF [3] or no change [6]. A possible explanation could be that the adopted experimental settings to induce motion sickness and the measurement techniques used to find HRV response to motion sickness have varied, potentially leading to these inconsistent findings. Results may have also been biased by presence of nonstationarity due to abrupt changes in autonomic tone. By considering the point-process instantaneous HF-HRV estimates, we found significantly increased HR and decreased HF-HRV during nausea stimulation.
Future studies should confirm our results in a larger sample of subjects, as well as explore how different therapies might affect this brain-autonomic integration.
In conclusion, our results indicate a significant decrease in cardiovagal activity during moderate/strong nausea using point-process estimates for HF-HRV. A shift in correlation with cardiovagal modulation was seen for fMRI signal localized to several higher cortical brain regions (e.g. MPFC and pgACC), supporting the importance of cognitive and emotional control of nausea sensation and cardiovagal modulation in humans.
Acknowledgments
This work was supported in part by the NCCAM, NIH (P01-AT002048, R01-AT004714) and NCRR (P41RR14075, CRC 1 UL1 RR025758-01).
Contributor Information
J Kim, Email: seesaw@nmr.mgh.harvard.edu, Massachusetts General Hospital, Department of Radiology, Charlestown, MA USA (phone: 617-643-0424).
V Napadow, Email: vitaly@nmr.mgh.harvard.edu, Massachusetts General Hospital, Department of Radiology, Charlestown, MA USA.
B Kuo, Email: BKUO@PARTNERS.ORG, Massachusetts General Hospital, Department of Gastroenterology Unit, Boston, MA USA.
R Barbieri, Email: barbieri@neurostat.mit.edu, Massachusetts General Hospital – Harvard Medical School, Department of Anesthesia, Critical Care and Pain Medicine, Boston, and Massachusetts Institute of Technology, Department of Brain and Cognitive Science, Cambridge, MA USA.
References
- 1.Koch KL. Illusory self-motion and motion sickness: a model for brain-gut interactions and nausea. Dig Dis Sci. 1999;44(8 Suppl):53S–57S. [PubMed] [Google Scholar]
- 2.Stout CS, Toscano WB, Cowings PS. Reliability of psychophysiological responses across multiple motion sickness stimulation tests. J Vestib Res. 1995 Jan–Feb;5(1):25–33. [PubMed] [Google Scholar]
- 3.Kim YY, Kim HJ, Kim EN, Ko HD, Kim HT. Characteristic changes in the physiological components of cybersickness. Psychophysiology. 2005 Sep;42(5):616–625. doi: 10.1111/j.1469-8986.2005.00349.x. [DOI] [PubMed] [Google Scholar]
- 4.Cowings PS, Suter S, Toscano WB, Kamiya J, Naifeh K. General autonomic components of motion sickness. Psychophysiology. 1986 Sep;23(5):542–551. doi: 10.1111/j.1469-8986.1986.tb00671.x. [DOI] [PubMed] [Google Scholar]
- 5.Doweck I, Gordon CR, Shlitner A, Spitzer O, Gonen A, Binah O, Melamed Y, Shupak A. Alterations in R-R variability associated with experimental motion sickness. J Auton Nerv Syst. 1997 Dec;67(1–2):31–37. doi: 10.1016/s0165-1838(97)00090-8. [DOI] [PubMed] [Google Scholar]
- 6.Ohyama S, Nishiike S, Watanabe H, Matsuoka K, Akizuki H, Takeda N, Harada T. Autonomic responses during motion sickness induced by virtual reality. Auris Naaus Larynx. 2007 Sep;34(3):303–306. doi: 10.1016/j.anl.2007.01.002. [DOI] [PubMed] [Google Scholar]
- 7.LaCount LT. Static and Dynamic Autonomic Response with Increasing Nausea Perception. Aviat Space Environ Med. doi: 10.3357/asem.2932.2011. submitted for publication. [DOI] [PMC free article] [PubMed] [Google Scholar]
- 8.LaCount LT, Napadow V, Kuo B, Park K, Kim J, Brown EN, Barbieri R. Dynamic Cardiovagal Response to Motion Sickness: A Point-Process Heart Rate Variability Study. Comput Cardiol. 2009 Jan;1(36):49–52. [PMC free article] [PubMed] [Google Scholar]
- 9.Golding JF. Motion sickness susceptibility questionnaire revised and its relationship to other forms of sickness. Brain Res Bull. 1998 Nov;47(5):507–516. doi: 10.1016/s0361-9230(98)00091-4. [DOI] [PubMed] [Google Scholar]
- 10.Barbieri R, Matten EC, Alabi AA, Brown EN. A point-process model of human heartbeat intervals: new definitions of heart rate and heart rate variability. Am J Physiol Heart Circ Physiol. 2005 Jan;288(1):H424–H434. doi: 10.1152/ajpheart.00482.2003. [DOI] [PubMed] [Google Scholar]
- 11.Barbieri R, Brown EN. Analysis of heartbeat dynamics by point process adaptive filtering. IEEE Trans Biomed Eng. 2006 Jan;53(1):4–12. doi: 10.1109/tbme.2005.859779. [DOI] [PubMed] [Google Scholar]
- 12.Napadow V, Dhond R, Conti G, Makris N, Brown EN, Barbieri R. Brain correlates of autonomic modulation: combining heart rate variability with fMRI. Neuroimage. 2008 Aug;42(1):169–177. doi: 10.1016/j.neuroimage.2008.04.238. [DOI] [PMC free article] [PubMed] [Google Scholar]
- 13.Amodio DM, Frith CD. Meeting of Minds: The Medial Frontal Cortex and Social Cognition. Nat Rev Neurosci. 2006 Apr;7(4):268–277. doi: 10.1038/nrn1884. [DOI] [PubMed] [Google Scholar]
- 14.Vogt BA. Pain and emotion interactions in subregions of the cingulate gyrus. Nat Rev Neurosci. 2005 Jul;6:533–544. doi: 10.1038/nrn1704. [DOI] [PMC free article] [PubMed] [Google Scholar]
- 15.Critchley HD. Neural mechanisms of autonomic, affective and cognitive integreation. J Comp Neurol. 2005 Dec;493(1):154–166. doi: 10.1002/cne.20749. [DOI] [PubMed] [Google Scholar]
- 16.An X, Bandler R, Ongü D, Price JL. Prefrontal cortical projections to longitudinal columns in the midbrain periaqueductal gray in macaque monkeys. J Comp Neurol. 1998 Nov;401(4):455–479. [PubMed] [Google Scholar]
- 17.Wager T, van Ast V, Hughes B, Davidson M, Lindquist M, Ochsner K. Brain mediators of cardiovascular respones to social threat, Part II: Prefrontal-subcortical pathways and relationship with anxiety. NeuroImage. 2009 Sep;47(3):836–851. doi: 10.1016/j.neuroimage.2009.05.044. [DOI] [PMC free article] [PubMed] [Google Scholar]
- 18.Ongür D, An X, Price JL. Prefrontal cortical projections to the hypothalamus in macaque monkeys. J Comp Neurol. 1998 Nov;401(4):480–505. [PubMed] [Google Scholar]


