Abstract
Obesity is a growing problem in the United States and throughout the world. It is a risk factor for many chronic diseases. The BMI has been used to assess body fat for almost 200 years. BMI is known to be of limited accuracy, and is different for males and females with similar %body adiposity. Here, we define an alternative parameter, the body adiposity index (BAI = ((hip circumference)/((height)1.5) − 18)). The BAI can be used to reflect %body fat for adult men and women of differing ethnicities without numerical correction. We used a population study, the “BetaGene” study, to develop the new index of body adiposity. %Body fat, as measured by the dual-energy X-ray absorptiometry (DXA), was used as a “gold standard” for validation. Hip circumference (R = 0.602) and height (R = −0.524) are strongly correlated with %body fat and therefore chosen as principal anthropometric measures on which we base BAI. The BAI measure was validated in the “Triglyceride and Cardiovascular Risk in African-Americans (TARA)” study of African Americans. Correlation between DXA-derived %adiposity and the BAI was R = 0.85 for TARA with a concordance of C_b = 0.95. BAI can be measured without weighing, which may render it useful in settings where measuring accurate body weight is problematic. In summary, we have defined a new parameter, the BAI, which can be calculated from hip circumference and height only. It can be used in the clinical setting even in remote locations with very limited access to reliable scales. The BAI estimates %adiposity directly.
INTRODUCTION
Alarming increases in adiposity have been identified in the United States and in other affluent countries (1–3). Obesity is a risk factor for many diseases, including type 2 diabetes mellitus, cardiovascular disease, hypertension, and cancer (4,5). Worldwide increases in diabetes and other chronic diseases will cause great suffering, and overwhelm medical treatment systems. Thus, there have been heroic efforts to attempt to reverse the increase in obesity, although such reversal has proved intractable in many situations (6).
It is important to target efforts to reduce adiposity for groups most at-risk for obesity-related chronic diseases. Various methods have been developed to assess adiposity. Underwater weighing and dual-energy X-ray absorption (DXA) are most accurate for quantifying body fat, and computed tomography scans and magnetic resonance imaging can assess body fat distribution. However, such technologically complex methods are too costly and time consuming to be applied routinely in clinical settings. Surrogate methods such as impedance analysis and skin-fold thickness can also be used, but are notoriously inaccurate (7,8).
Other than simple measurement of body weight, the BMI is by far the most commonly applied approach to characterize obesity in individual subjects. This measure was introduced in the 19th century by Quetelet (9), who recognized that it is necessary to correct for differences in body size when comparing adiposity among patients. Because growth is linear, weight cannot increase as the cube of height, but as the square, and the human represents a cylinder more than a sphere. Quetelet’s index, renamed the BMI by Ancel Keys (10), is the ratio of weight to height squared. The BMI is now routinely applied to estimate body fat, not only in epidemiological studies, but also in clinical practice, despite warnings that it is not a very accurate measure of adiposity in individual patients (11). The BMI is particularly inaccurate in subjects with elevated lean body mass, such as athletes, and cannot be generalized among different ethnic groups (12,13). It is likely that individuals are often misdiagnosed as having inappropriate body fat due to variation in muscle mass, and that certain subjects with significant adiposity are overlooked. Determining adiposity in children is particularly difficult. In children, the most prevalent approach of determining body composition is to use BMI normalized by age (14). This in turn leads to complex mathematical calculations which require access to calculation software or the use of charts and tables which may not be available to those working in the health and nutrition field. Large cohorts are required to estimate the normalization factors that later are to be used by the practitioners. Furthermore, the BMI cannot be calculated in settings where accurate measures of body weight cannot be obtained (e.g., in fieldwork or in underdeveloped countries).
METHODS AND PROCEDURES
Identification of the index: The BetaGene study
To define a measure of adiposity we initially queried a single, large study in which a variety of body measures were made. The “BetaGene” study was performed by three of the coauthors (T.A.B., R.M.W., and A.H.X.). Recruitment has been described in detail previously (15). Briefly, 1,733 subjects are Mexican American (Table 1, both parents and ≥3 grandparents Mexican or of Mexican descent) who are either probands with gestational diabetes mellitus (GDM) diagnosed within the previous 5 years (16) and their siblings and cousins, or probands with normal glucose levels in pregnancy in the past 5 years. All probands were identified from the patient populations at Los Angeles County/USC Medical Center, the Kaiser Permanente Southern California health plan membership, and OB/GYN clinics at local hospitals in Los Angeles. GDM probands were required to have glucose levels associated with poor pancreatic β-cell function and a high risk of diabetes when not pregnant (17), have no evidence of β-cell autoimmunity by GAD-65 testing, and have at least two siblings available for study. Non-GDM probands were recruited if they had a 2-h 50 g glucose screening result <130 mg/dl (7.2 mmol/l) during their most recent pregnancy, had no family history of diabetes, and had normal glucose tolerance. The non-GDM probands are frequency-matched to GDM probands by age, BMI, and parity categories. Body characteristics of the BetaGene population are in Table 1. Participants were 61% female, with a average BMI of 29.5 ± 6.1 kg/m2, but with a wide range of values (17.1–71.5).
Table 1.
Characteristics of subjects in the BetaGene and the TARA studies
| BetaGene
|
TARA
|
|
|---|---|---|
| Mexican-American adults | African-American adults | |
| Sex (M/F) | 675/1,058 | 97/126 |
| Age at recruitment | 35 (18–67) | 35 (20–50) |
| Height (m) | 1.62 (1.04–1.97) | 1.70 (1.48–1.97) |
| Weight (kg) | 77.9 (39.3–180.0) | 87.3 (49.1–164.9) |
| BMI | 29.5 (17.1–71.5) | 30.0 (18.5–54.7) |
| %Fat (DXA, %) | 33.2 (8.7–61.2) | 29.7 (7.5–52.9) |
| Waist (cm) | 94.7 (54.2–163.0) | 96.1 (67.2–172.5) |
| Hip (cm) | 105.7 (41.5–169.0) | 109.5 (82.0–162.8) |
The number in parentheses are the actual range for a given variable.
DXA, dual-energy X-ray absorptiometry; TARA, Triglyceride and Cardiovascular Risk in African-Americans.
Approach
Among the BetaGene participants, we examined the relationship between adiposity, measured by DXA (Hologic QDR4500A scanner; Hologic, Bedford, MA; array mode; software version 12.6.1) and specific subject characteristics (e.g., sex, age, height, weight, waist, or hip circumference). The goal was to find a specific trait or combination of traits, which would most strongly correlate with DXA-measured adiposity. We also examined the covariance among variables to select a combination of variables, which independently correlated with the adiposity measured.
Validation
To examine the generalizability of an identified index (see below), we applied said index to a separate study, the Triglyceride and Cardiovascular Risk in African-Americans (TARA), a cross-sectional study done by Dr A.E.S. at the National Institutes of Health (Bethesda, MD). The TARA study included only African Americans. The index emerging from the BetaGene study was examined in the TARA study to determine if it more accurately reflected adiposity than the BMI itself.
TARA
Body characteristics for participants in the TARA study are shown in Table 1. Subjects were 223 African Americans (Table 1, 43.5% male), age 35 years (34.8 ± 7.7), range 20–50 years, BMI 30.0 ± 7.7, range 18.5–54.7 kg/m2. The BMI range of TARA participants was similar to that of the BetaGene subjects. Data from the TARA subjects have been previously reported (18,19). Subjects were born in the United States and each subject reported that both parents were African-American. Oral glucose tolerance tests revealed previously unknown impaired glucose tolerance in 25% and diabetes in 2%. Twenty percent were hypertensive. Women were premenopausal; 41% of the females were obese. Recruitment was accomplished through flyers, newsletters, and websites. The institutional review board of National Institute of Diabetes and Digestive and Kidney Disease (NIDDK) approved the study, and all subjects gave informed consent.
Hip circumference in all TARA participants was measured by a single observer (N.G.S.) over nonrestrictive underwear or light-weight shorts, at the level of the maximum extension of the buttocks posteriorly in a horizontal plane. The mean of the three determinations was recorded. Similar to the BetaGene study, whole-body composition measurements were performed with a Hologic QDR4500A dual-energy X-ray absorptiometer (Hologic) in the array mode using software version 5.71A.
Concordance analysis
To assess the concordance between the novel index of body adiposity and DXA, we used Lin’s concordance correlation coefficient. Lin’s concordance correlation coefficient is a measure of the agreement between two methods or persons and it combines measures of precision and accuracy to determine how far the observed data deviate from perfect agreement (20). The Pearson’s correlation coefficient (R) is measure of precision and bias correction factor (C_b) is a measure of accuracy. The product of R and C_b is the concordance correlation coefficient. Since the C_b coefficient, which is the ratio of the concordance correlation and correlation coefficient, is a measure of accuracy, we use it as a surrogate measure for concordance.
Bland–Altman plots
In effort to illustrate the concordance of the novel index of body adiposity with the DXA methodology we used the Bland–Altman plot, which is also known as Tukey mean-difference plot (21). The plot is designed to visually compare the difference of two methods (y axes) that measure the same parameter over a wide range of values (mean value for the two methodologies, x axes). Thus, the Bland–Altman plot can provide useful information in regards to the ranges of values for which the two methods are most concordant/discordant.
RESULTS
Design of the adiposity index
To select an optimal surrogate for adiposity, we examined for the BetaGene population the correlation between %total adiposity as measured by DXA, and several easily measured variables: height, weight, age, hip and waist circumference, and BMI (Table 2). Interestingly, correlations ranged from a high of 0.602 for hip to a low value of 0.158 for age. Adiposity was negatively correlated with height in this group (R = −0.524, P < 0.001). Correlation of %adiposity with weight was only 0.226 in this population; of course this correlation was improved when weight was corrected for the square of height; correlation with BMI was 0.569.
Table 2.
Correlation matrix among %fat from DXA, hip, waist, BMI, weight, age, and height
| Pfat | Hip | Waist | BMI | Weight | Study age | Height | |
|---|---|---|---|---|---|---|---|
| Pfata | 1 | ||||||
| Hipb | 0.602 | 1 | |||||
| P value | 0.000 | ||||||
| Waistc | 0.375 | 0.807 | 1 | ||||
| P value | 0.000 | 0.000 | |||||
| BMI | 0.569 | 0.837 | 0.815 | 1 | |||
| P value | 0.000 | 0.000 | 0.000 | ||||
| weight | 0.226 | 0.741 | 0.827 | 0.838 | 1 | ||
| P value | 0.000 | 0.000 | 0.000 | 0.000 | |||
| Study aged | 0.158 | 0.119 | 0.215 | 0.118 | 0.045 | 1 | |
| P value | 0.000 | 0.000 | 0.000 | 0.000 | 0.632 | ||
| height | −0.524 | 0.005 | 0.190 | −0.085 | 0.463 | −0.107 | 1 |
| P value | 0.000 | 1.000 | 0.000 | 0.001 | 0.000 | 0.000 |
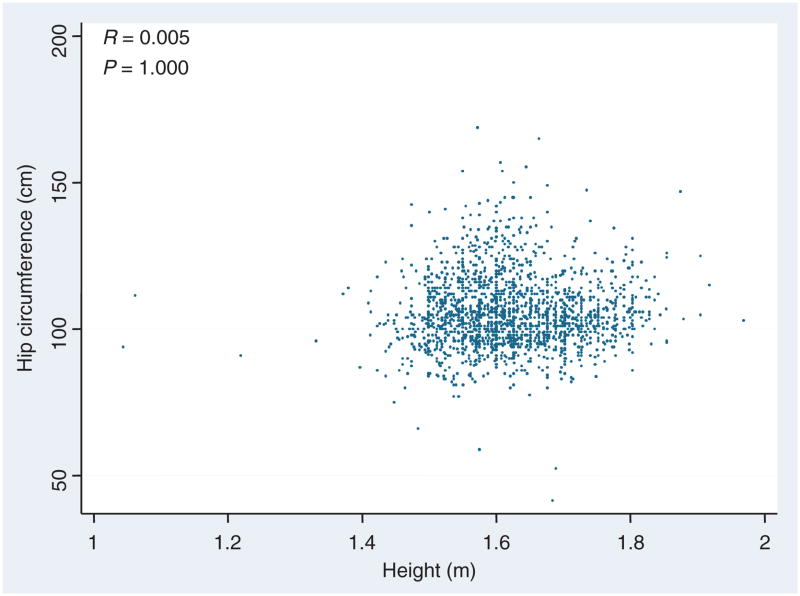
Note that the highest correlations with %adiposity were hip and height, however these correlates were uncorrelated with each other (R = 0.005, P = 1.0).
DXA, dual-energy X-ray absorptiometry.
%Fat as identified by the DXA methodology.
Hip circumference.
Waist circumference.
Age of subject.
We considered two characteristics to choose those parameters, which should be considered for a new index of adiposity. First, it was reasonable to utilize those values with the strongest correlation with %adiposity: hip circumference (R = 0.602, P < 0.001) and height (R = −0.524, P < 0.001). Thus, we expected that our putative surrogate index would be related in some way with the ratio of hip circumference to height, as the correlation was positive to the first and negative to the latter value. The second consideration was one of independence. Clearly if there is little absolute correlation between the chosen variables, including both of them in the overall index would glean significant information from each. In fact, there is no significant correlation between hip and height (R = 0.005, P = NS, Figure 1), suggesting that they may each contribute independent information to the prediction of %adiposity.
Figure 1.
Relation between hip circumference (cm) and height (m). Note the overall lack of correlation (R = 0.005, P = 1.0) suggests that each can contribute independently to a adiposity index.
As was originally surmised by Quetelet, and shown many times since, the relationship between body fat and height is nonlinear. Thus, similar to the BMI itself, we assumed that %body fat would depend upon hip according to the following relationship:
| (1) |
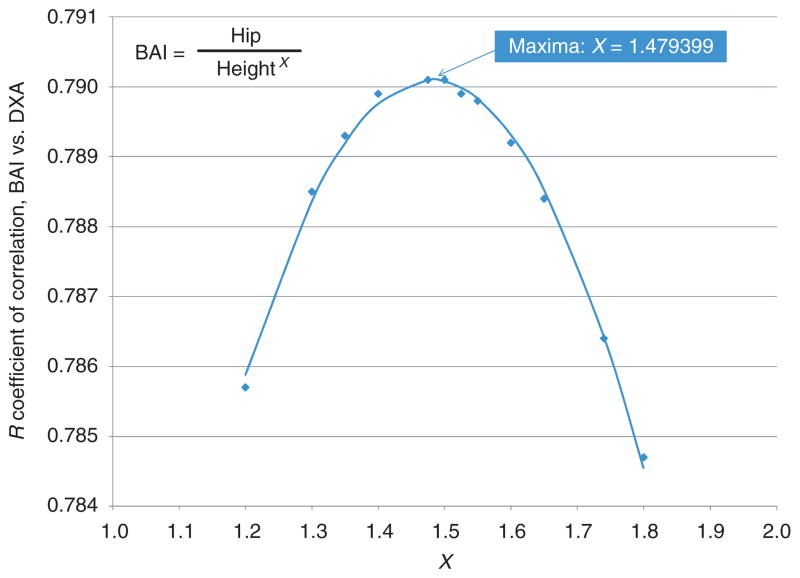
In which hip reflects hip circumference (in cm), height is measured in meters, and X a unitless power term. Figure 2 shows the ability of calculated values of the BAI in Equation (1) to reflect known %adiposity from the BetaGene study. In this study, for all participants the correlation was calculated between %adiposity and the suggested index (Eq. 1) for a range of values of X from 1.2 to 1.8. Note that the correlation between BAI and %adiposity maximizes at a value of R = 0.790, when the value of the exponent lies between X = 1.47 and 1.5. To determine the exact value of the exponent at which the correlation was maximized, we fitted a parabola to the range of exponent values and the observed correlation between the %body fat and the BAI. Using derivation we identified that the parabolic function had one maximum at X = 1.479, which was very close to 1.5. Additionally, BAI with exponent of 1.5 retained the correlation of R = 0.790. Therefore, we initially defined the suggested BAI as
Figure 2.
Calculated suggested body adiposity index values with varying values of power (x axes). Note the maximum at X = 1.48. BAI, body adiposity index; DXA, dual-energy X-ray absorptiometry.
| (2) |
Behavior of the BAI; comparison with the BMI
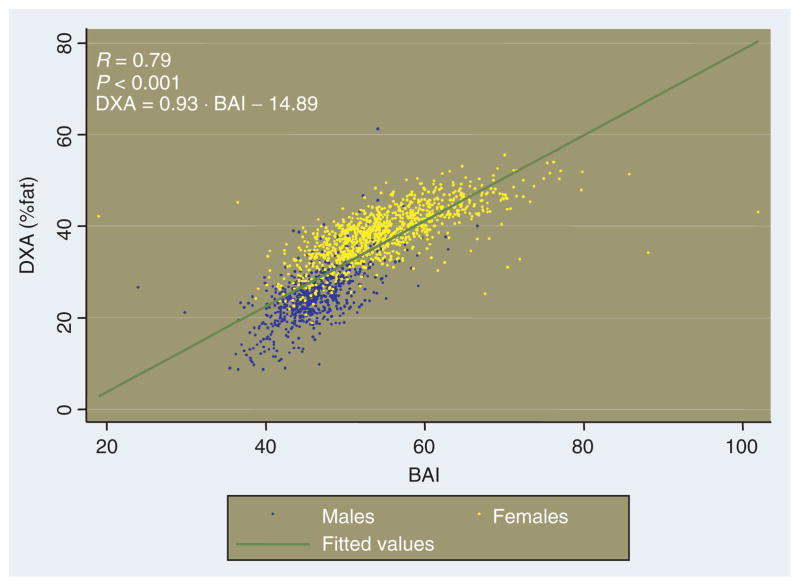
The ability of the BAI to predict %adiposity in the BetaGene population is shown in Figure 3. Although the relationship between BAI and %fat is not exactly linear, all subjects (men and women) can be approximately represented by a single monotonic relationship, for which
Figure 3.
%Body fat (from dual-energy X-ray absorptiometry (DXA)) vs. body adiposity index (BAI); blue for males and yellow for females from the BetaGene study. Relationship between body adiposity index and %body fat, and measured by DXA is represented by the green line. Note that the slope of the relationship (0.93) is fortuitously not different from unity, such that an estimate of %fat can be obtained by calculating BAI and subtracting 15.
| (3) |
Interestingly and fortuitously, the relationship between DXA-derived %adiposity and adiposity quantified by the BAI has a slope similar to 1.0. Therefore, calculating the BAI according to Equation (2), and subtracting 15 will yield a good estimate of %fat.
Figure 3 plots the relationship between BAI and %fat, showing males and females separately. As expected, males are localized on the lower end of the curve, because males in the BetaGene population tend to have a lower adiposity compared to females, and this is also reflected in a lower BAI. In addition, it is noted that for a similar value of the index, males and females tend to have similar values of relative adiposity. Different mean of BAI for males (46.2 ± 4.3) vs. females (54.7 ± 7.1) reflects different relative adiposity of the two sexes.
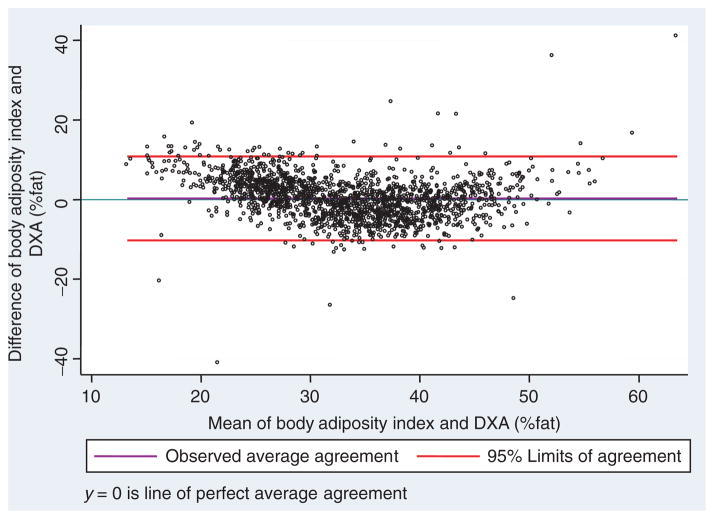
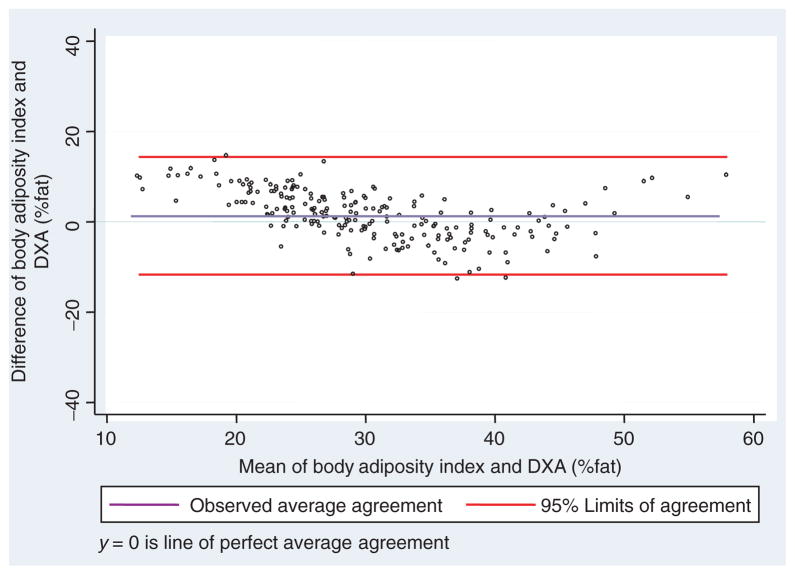
The similar relationships between BAI and DXA-derived %adiposity allowed for definition of a single “best-fit” linear relationship between the index and %adiposity which could apply to both genders. We decided to use a slope of 1 because the relationship between %body adiposity and BAI had a slope of 0.934, which was marginally different from 1.0. We used the concordance comparison between %body adiposity and BAI to identify the best intercept which will maximize the concordance between the two indexes (Figure 4). Based on the newly identified intercept of 18, the concordance between %body adiposity and BAI-18 was C_b = 0.986, P < 0.001. Using this simplification, the %adiposity can be estimated as
Figure 4.
Bland and Altman’s limits-of-agreement plot between %body adiposity and BAI-18 for the BetaGene cohort. BAI, body adiposity index; DXA, dual-energy X-ray absorptiometry.
| (4) |
Therefore, we define a final BAI, which reflects %adiposity,
or
| (5) |
Figure 4 shows that the formula for BAI does in fact reflect %adiposity for the BetaGene participants.
BMI and gender
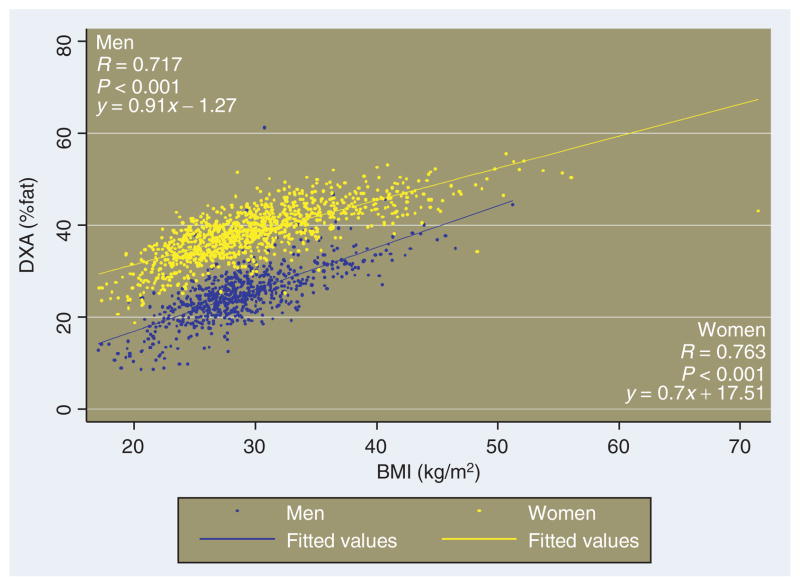
In contrast to the newly defined BAI, the relationships between %fat and the BMI itself for males and females lie on very different linear representations, as has been reported previously (Figure 5). For example, the BMI value defined for obesity, BMI in the range between 27 and 28 kg/m2 in this population, corresponds to a %adiposity of 23.6 ± 3.7 for men, vs. 34.3 ± 2.9 for women.
Figure 5.
Relationship between DXA-measured %body fat and BMI in the BetaGene study, for males vs. females. DXA, dual-energy X-ray absorptiometry.
Validation
We addressed whether the BAI could be used in two different ethnic groups: African-Americans vs. the Mexican-American population of the BetaGene study. To address this, we accessed the database from the TARA study. We divided the cohorts of both studies according to the DXA-derived %body fat (Table 3). For a specific range of %body adiposity, we generated the BAI values for the BetaGene and TARA studies separately. Finally, we calculated the percent difference between the mean estimates for the two studies. As can be seen, the BAI predicts the %adiposity best above a %adiposity >20%. At a measured %adiposity of 20–25%, BAI is 26–27% in the BetaGene and TARA populations. The ability of the BAI to predict %adiposity is accurate up to and including %adiposity >50%. Also, the prediction of %adiposity for the Mexican-American BetaGene study and the TARA African-American study were similar, only differing at a %adiposity <10%, where the difference was 17.4%. Additionally, for the TARA study the correlation between %body adiposity and the BAI was R = 0.849 (P < 0.001), and the concordance was C_b = 0.947.
Table 3.
Ability of the BAI to predict %fat for the BetaGene (Mexican-American) and TARA (African-American) studies
| %Adiposity | Predicted %adiposity (±s.d.)
|
%Difference | |
|---|---|---|---|
| BetaGene | TARA | ||
| 0–10 | 21.9 (4.1) | 18.4 (1.8) | 17.4 |
| 10–15 | 22.3 (2.4) | 22.5 (2.6) | −0.9 |
| 15–20 | 25.2 (2.8) | 24.9 (1.8) | 1.2 |
| 20–25 | 27.1 (3.0) | 26.8 (2.4) | 1.1 |
| 25–30 | 28.9 (3.5) | 28.9 (3.0) | 0.0 |
| 30–35 | 32.4 (4.9) | 31.4 (3.3) | 3.1 |
| 35–40 | 35.0 (3.9) | 33.7 (3.8) | 3.8 |
| 40–45 | 40.0 (5.8) | 38.4 (4.8) | 4.1 |
| 45–50 | 44.9 (5.7) | 46.1 (7.1) | −2.6 |
| 50–55 | 52.6 (7.1) | 54.9 (9.8) | −4.3 |
Note that there is a difference between the two studies only in the very low ranges of adiposity.
BAI, body adiposity index; DXA, dual-energy X-ray absorptiometry; TARA, Trig-lyceride and Cardiovascular Risk in African-Americans.
DISCUSSION
In this article, we introduce a new method to estimate adiposity of individuals. The “BAI” is a direct estimate of %body fat. The applicability of the BAI to two ethnic groups, Mexican American and African American, is demonstrated. Unlike the BMI, the BAI provides %body fat in both males and females without statistical correction. Calculating BAI does not require a measurement of body weight.
In the present study, we were able to access the BetaGene study of relatives of Mexican-American individuals with gestational diabetes. While this population has an elevated risk for type 2 diabetes overall, the range of fat deposition in this population, ranging from 8.7 to 61.2% made it particularly attractive to examine a new measure of body fat. Because DXA-measured %fat was available to us, we considered this to be the “gold standard” that would indicate to a physician the adiposity of the patient. We then asked how to best estimate the %fat from easily accessible variables. In this population, %fat was positively correlated with hip circumference, and negatively correlated with height. Surprisingly, there was a weaker correlation with body weight. Therefore, we defined a body fat index in terms of a nonlinear ratio of hip circumference to height. The selected relationship, hip size divided by height to the power of 1.5, yielded the strongest correlation with DXA-derived %fat estimates. In fact, we observed a quasi-linear relationship between the BAI and %body fat, and suggested it as a preliminary adiposity index.
Observing all the BetaGene subjects, two interesting points emerged. One was that the relationship between BAI and %adiposity was not different between men and women. Thus, if one proposes cutoffs of risk in terms of adiposity, one does not have to propose separate parameters for the two sexes. The second and purely fortuitous point was that the slope of the relationships between the BAI and %adiposity had a slope close to 1.0. Because the intercept of the relationship between adiposity and the preliminary index had a negative intercept, we were able to define the final adiposity index, the BAI as
Of course, it may not be trivial for all individuals to calculate the value of BAI, but the computation can be made easily with a calculator or a computer program (c.f., for example: ba-index.org).
There are, of course other procedures that could be used to define a simple-to-use estimate of adiposity. One approach which is often used is the multiple regression approach. Using this approach one assumes a linear relationship between the primary outcome variable (in this case, %body adiposity) and known determining variables. For example, it is possible to calculate this relationship for the BetaGene data:
(in this expression, sex term is 1 for males and 0 for females.)
An important question is whether such a complex equation would be useful for the practicing clinician. A different set of parameters could be calculated for different ethnic groups. We suggest that it is extremely unlikely that a multiple regression approach will be accepted and used clinically. The strongest evidence is that, regardless of its known faults, the BMI is still in wide use because of its simplicity; it has not yet been supplanted by a more cumbersome (if accurate) approach. In fact, PubMed reveals over 45,000 references using the BMI as of this writing.
In this study, the BAI was developed and validated from studies of non-Caucasian subjects, and thus the utility of this index has not yet been confirmed in Caucasian subjects. Many population studies have focused on white populations (Framingham (22), Inter99 (23), Botnia (24), FUSION (17)). Thus, it might be expected that our index would be developed in whites. However, most of the world population is nonwhite. Thus, it is equally reasonable to develop an index in a “non-Caucasian” population. We have used the Mexican-American population, which is prevalent in Los Angeles. It is possible that our results could be extrapolated to several populations in Central and South America. We also compared the behavior of the BAI in an African-American population in the Washington, D.C. area, and found that the behavior of the index in Mexican-Americans and African-Americans is quite similar (Figures 4 and 6). In addition, there is some evidence in our paper that the BAI is useful in whites, but the latter requires further investigation. Thus, we believe that we have presented evidence of accuracy at least in two ethnic populations, and further research on the generalizability of BAI to other groups is underway.
Figure 6.
Bland and Altman’s limits-of-agreement plot between %body adiposity and BAI-18 for the TARA cohort. BAI, body adiposity index; DXA, dual-energy X-ray absorptiometry.
One underlying assumption in this work is that %adiposity per se is the physiological characteristic of obese and overweight individuals, which puts such individuals at-risk for cardiovascular disease. The relationship between %fat and risk for cardiovascular disease is well documented (25,26). However, there is compelling evidence that visceral (27) or hepatic (28) fat content may be a stronger predictor of cardiovascular risk than overall adiposity. Hip size in this study must reflect both visceral as well as subcutaneous (thigh) adiposity, as it reflects overall %fat in men and women. We do not have individual measurements of visceral and subcutaneous fat deposition for the BetaGene study, so it is not possible at this time to determine whether the BAI might reflect the presumably more detrimental visceral or hepatic compartments, but it will be of interest in the future to compare the BAI to selected fat depots.
It was important to validate the BAI in a separate ethnic group. We were able to access the TARA study, for which %fat, hip size, and height had been assessed. It was interesting that in the TARA study of African-American participants, the ability of the BAI to predict %fat was very similar to the Mexican-American participants of the BetaGene study. While comparing two ethnic groups is encouraging, it remains unknown at this time if the BAI will have this predictive property of %adiposity in other ethnic groups. Of course, a Caucasian population should be studied, as well as other ethnic groups such as Chinese, Koreans, Japanese, and those from the Indian subcontinent. Because of the increasing importance of childhood obesity, it is critical to examine the behavior of the BAI in pre-pubertal and postpubertal children of both sexes, and different ethnicities. Questions to be addressed include whether the BAI can predict %adiposity in children, and the extent to which such prediction can be associated with risk of disease such as diabetes and cardiovascular disease.
One of the surprising results in this analysis was that %adiposity could be well estimated without using a mechanical or electronic assessment of body weight. Thus, even in remote environments where only the simplest and least expensive tools are available (a tape measure), a reliable estimate of adiposity may be obtained. While the height of mature individuals is relatively constant, it is the measurement of hip circumference that potentially may introduce error to the estimation of BAI. Considering the fact that hip circumference is the numerator of the fraction defining BAI, a 10% change in hip circumference will result in a similar error in the estimation of BAI. Nevertheless, a 10% difference for an average value of BAI of 33 will result in error in the estimation of ±3 in the value of BAI, which likely has little significance relative to risk. This provides hope for providing important information to practitioners and patients in a very wide variety of environments. It will be important to examine the application of this method in widely diverse populations.
In summary, we have defined a new parameter of adiposity. We used the DXA measured %body fat as our “gold standard,” and asked which easily measured anthropomorphic parameters could be combined to obtain an easy measure related to %adiposity. Because of the particularly strong correlation of both hip size and height, the resultant parameter, the BAI, is a strong predictor of %fat in Mexican-American subjects of widely varying adiposity. The result was confirmed in a study of African-Americans. After further validation, this measure can be proposed as a useful measure of %fat, which is very easy to obtain. However, it remains to be seen if the BAI is a more useful predictor of health outcome, in both males and females, than other indexes of body adiposity, including the BMI itself.
Acknowledgments
R.N.B. is supported by the NIH DK27619 (M.E.R.I.T) and DK29867, and by two Mentor Awards from the American Diabetes Association. R.N.B. had full access to all of the data in the study and takes responsibility for the integrity of the data and the accuracy of the data analysis. T.A.B. and R.M.W. are supported by the NIH (DKR01-61628), and T.A.B. is also supported with the ADA Distinguished Clinical Science Award (7-04-DCS). We thank the families who participated in the BetaGene Study, the recruitment and technical staff, and the support of the USC GCRC (M01-RR-0043). A.E.S. was supported by the Intramural Program of NIDDK at the NIH. We are indebted to Drs. Marilyn Ader and Viorica Ionut for improving the manuscript prior to publication.
Footnotes
DISCLOSURE
The authors declared no conflict of interest.
References
- 1.Flegal KM, Carroll MD, Ogden CL, Curtin LR. Prevalence and trends in obesity among US adults, 1999–2008. JAMA. 2010;303:235–241. doi: 10.1001/jama.2009.2014. [DOI] [PubMed] [Google Scholar]
- 2.Park J, Hilmers DC, Mendoza JA, et al. Prevalence of metabolic syndrome and obesity in adolescents aged 12 to 19 years: comparison between the United States and Korea. J Korean Med Sci. 2010;25:75–82. doi: 10.3346/jkms.2010.25.1.75. [DOI] [PMC free article] [PubMed] [Google Scholar]
- 3.Stamatakis E, Zaninotto P, Falaschetti E, Mindell J, Head J. Time trends in childhood and adolescent obesity in England from 1995 to 2007 and projections of prevalence to 2015. J Epidemiol Community Health. 2010;64:167–174. doi: 10.1136/jech.2009.098723. [DOI] [PubMed] [Google Scholar]
- 4.Gade W, Schmit J, Collins M, Gade J. Beyond obesity: the diagnosis and pathophysiology of metabolic syndrome. Clin Lab Sci. 2010;23:51–61. quiz 62. [PubMed] [Google Scholar]
- 5.Donohoe CL, Pidgeon GP, Lysaght J, Reynolds JV. Obesity and gastrointestinal cancer. Br J Surg. 2010;97:628–642. doi: 10.1002/bjs.7079. [DOI] [PubMed] [Google Scholar]
- 6.Flynn MA, McNeil DA, Maloff B, et al. Reducing obesity and related chronic disease risk in children and youth: a synthesis of evidence with ‘best practice’ recommendations. Obes Rev. 2006;7 (Suppl 1):7–66. doi: 10.1111/j.1467-789X.2006.00242.x. [DOI] [PubMed] [Google Scholar]
- 7.Goran MI, Driscoll P, Johnson R, Nagy TR, Hunter G. Cross-calibration of body-composition techniques against dual-energy X-ray absorptiometry in young children. Am J Clin Nutr. 1996;63:299–305. doi: 10.1093/ajcn/63.3.299. [DOI] [PubMed] [Google Scholar]
- 8.Piers LS, Soares MJ, Frandsen SL, O’Dea K. Indirect estimates of body composition are useful for groups but unreliable in individuals. Int J Obes Relat Metab Disord. 2000;24:1145–1152. doi: 10.1038/sj.ijo.0801387. [DOI] [PubMed] [Google Scholar]
- 9.Eknoyan G. Adolphe Quetelet (1796–1874)–the average man and indices of obesity. Nephrol Dial Transplant. 2008;23:47–51. doi: 10.1093/ndt/gfm517. [DOI] [PubMed] [Google Scholar]
- 10.Keys A, Fidanza F, Karvonen MJ, Kimura N, Taylor HL. Indices of relative weight and obesity. J Chronic Dis. 1972;25:329–343. doi: 10.1016/0021-9681(72)90027-6. [DOI] [PubMed] [Google Scholar]
- 11.McCarthy HD. Body fat measurements in children as predictors for the metabolic syndrome: focus on waist circumference. Proc Nutr Soc. 2006;65:385–392. doi: 10.1017/s0029665106005143. [DOI] [PubMed] [Google Scholar]
- 12.Rahman M, Berenson AB. Accuracy of current body mass index obesity classification for white, black, and Hispanic reproductive-age women. Obstet Gynecol. 2010;115:982–988. doi: 10.1097/AOG.0b013e3181da9423. [DOI] [PMC free article] [PubMed] [Google Scholar]
- 13.Garrido-Chamorro RP, Sirvent-Belando JE, Gonzalez-Lorenzo M, Martin-Carratala ML, Roche E. Correlation between body mass index and body composition in elite athletes. J Sports Med Phys Fitness. 2009;49:278–284. [PubMed] [Google Scholar]
- 14.Duggan MB. Anthropometry as a tool for measuring malnutrition: impact of the new WHO growth standards and reference. Ann Trop Paediatr. 2010;30:1–17. doi: 10.1179/146532810X12637745451834. [DOI] [PubMed] [Google Scholar]
- 15.Buchanan TA, Xiang A, Kjos SL, et al. Gestational diabetes: antepartum characteristics that predict postpartum glucose intolerance and type 2 diabetes in Latino women. Diabetes. 1998;47:1302–1310. doi: 10.2337/diab.47.8.1302. [DOI] [PubMed] [Google Scholar]
- 16.Metzger BE. Summary and recommendations of the Third International Workshop-Conference on Gestational Diabetes Mellitus. Diabetes. 1991;40 (Suppl 2):197–201. doi: 10.2337/diab.40.2.s197. [DOI] [PubMed] [Google Scholar]
- 17.Watanabe RM, Allayee H, Xiang AH, et al. Transcription factor 7-like 2 (TCF7L2) is associated with gestational diabetes mellitus and interacts with adiposity to alter insulin secretion in Mexican Americans. Diabetes. 2007;56:1481–1485. doi: 10.2337/db06-1682. [DOI] [PMC free article] [PubMed] [Google Scholar]
- 18.Sumner AE, Farmer NM, Tulloch-Reid MK, et al. Sex differences in visceral adipose tissue volume among African Americans. Am J Clin Nutr. 2002;76:975–979. doi: 10.1093/ajcn/76.5.975. [DOI] [PubMed] [Google Scholar]
- 19.Sumner AE, Sen S, Ricks M, et al. Determining the waist circumference in african americans which best predicts insulin resistance. Obesity (Silver Spring) 2008;16:841–846. doi: 10.1038/oby.2008.11. [DOI] [PubMed] [Google Scholar]
- 20.Lin LI. A concordance correlation coefficient to evaluate reproducibility. Biometrics. 1989;45:255–268. [PubMed] [Google Scholar]
- 21.Bland JM, Altman DG. Statistical methods for assessing agreement between two methods of clinical measurement. Lancet. 1986;1:307–310. [PubMed] [Google Scholar]
- 22.Dawber TR, Meadors GF, Moore FE. Epidemiological approaches to heart disease: the Framingham Study. Am J Public Health Nations Health. 1951;41:279–281. doi: 10.2105/ajph.41.3.279. [DOI] [PMC free article] [PubMed] [Google Scholar]
- 23.Urdea M, Kolberg J, Wilber J, et al. Validation of a multimarker model for assessing risk of type 2 diabetes from a five-year prospective study of 6784 Danish people (Inter99) J Diabetes Sci Technol. 2009;3:748–755. doi: 10.1177/193229680900300422. [DOI] [PMC free article] [PubMed] [Google Scholar]
- 24.Ylönen K, Saloranta C, Kronberg-Kippilä C, et al. Botnia Dietary Study. Associations of dietary fiber with glucose metabolism in nondiabetic relatives of subjects with type 2 diabetes: the Botnia Dietary Study. Diabetes Care. 2003;26:1979–1985. doi: 10.2337/diacare.26.7.1979. [DOI] [PubMed] [Google Scholar]
- 25.Tanaka H, Clevenger CM, Jones PP, Seals DR, DeSouza CA. Influence of body fatness on the coronary risk profile of physically active postmenopausal women. Metab Clin Exp. 1998;47:1112–1120. doi: 10.1016/s0026-0495(98)90286-4. [DOI] [PubMed] [Google Scholar]
- 26.Katzmarzyk PT, Gagnon J, Leon AS, et al. Fitness, fatness, and estimated coronary heart disease risk: the HERITAGE Family Study. Med Sci Sports Exerc. 2001;33:585–590. doi: 10.1097/00005768-200104000-00012. [DOI] [PubMed] [Google Scholar]
- 27.Canoy D. Coronary heart disease and body fat distribution. Curr Atheroscler Rep. 2010;12:125–133. doi: 10.1007/s11883-010-0092-9. [DOI] [PubMed] [Google Scholar]
- 28.Edens MA, Kuipers F, Stolk RP. Non-alcoholic fatty liver disease is associated with cardiovascular disease risk markers. Obes Rev. 2009;10:412–419. doi: 10.1111/j.1467-789X.2009.00594.x. [DOI] [PubMed] [Google Scholar]


