

Abstract
Background
A history of diabetes is associated with an increased risk of several types of cancers. Whether diabetes is a risk factor for head and neck cancer (HNC) has received little attention.
Methods
We pooled data from 12 case-control studies including 6,448 cases and 13,747 controls, and estimated odds ratios (OR) and 95% confidence intervals (CI) for the associations between diabetes and HNC, adjusted for age, education level, sex, race/ethnicity, study center, cigarette smoking, alcohol use and body mass index (BMI).
Results
We observed a weak association between diabetes and the incidence of HNC overall (OR, 1.09; 95% CI, 0.95–1.24). However, we observed a modest association among never smokers (OR, 1.59; 95% CI, 1.22–2.07), and no association among ever smokers (OR, 0.96; 95% CI, 0.83–1.11); likelihood ratio test for interaction p=0.001.
Conclusions
A history of diabetes was weakly associated with HNC overall, but we observed evidence of effect modification by smoking status, with a positive association among those who never smoked cigarettes.
Impact
This study suggests that glucose metabolism abnormalities may be a HNC risk factor in subgroups of the population. Prospective studies incorporating biomarkers are needed to improve our understanding of the relationship between diabetes and HNC risk, possibly providing new strategies in the prevention of HNC.
Keywords: head and neck cancer, head and neck squamous cell carcinoma, diabetes, INHANCE
Introduction
Diabetes and/or abnormal glucose metabolism are associated with an increased risk of various types of cancers, including colorectal (1), pancreatic (2), breast (3), liver (4) and endometrial cancer (5). There are several mechanisms through which diabetes may drive the carcinogenic process. Neoplasms have an inherently high need for glucose to fuel proliferation, raising the possibility that untreated hyperglycemia may contribute to tumor growth (6). Diabetics also exhibit increased generation of reactive oxygen species and greater oxidative damage to DNA (7,8). Exposure to high levels of insulin and insulin-like growth factors (IGFs), a hallmark of type II diabetes, results in increased cellular proliferation. The IGF receptor additionally activates the oncogenic epidermal growth factor receptor (EGFR) (9). In addition, IGFs also appear to exert anti-apoptotic effects (10–12).
Head and neck cancers (HNC) are among the most common worldwide, with an estimated nearly 400,000 new cases and approximately 200,000 deaths in 2008 worldwide (13). While tobacco, alcohol use and, infection with oncogenic HPV are established risk factors for HNC (14,15), emerging evidence suggests that abnormalities of glucose metabolism and diabetes may also play a role (16–19). Several studies have reported that diabetics have an increased prevalence of oral lesions such as erythroplakia and leukoplakia that predispose to oral cancer (17–19). A Danish population-based study comparing individuals hospitalized with a diagnosis of diabetes to the general population observed an increased risk of mouth/pharynx cancer associated with diabetes in subjects less than 50 years old but not in older persons (20); however, these results were based on only 30 cases. A hospital-based case-control study of 2,660 patients and 2,980 controls observed that elevated fasting glucose was strongly associated with oral cancer in females but not males (16).
We used pooled data from multiple studies from different countries to investigate whether a history of diabetes is associated with HNC overall, as well as within subgroups defined by known HNC risk factors.
Methods
Overview and Design
We conducted a pooled analysis of case-control studies participating in the International Head and Neck Cancer Epidemiology (INHANCE) Consortium. Data pooling methods for the INHANCE consortium have been previously described (21). The following 12 INHANCE studies collected data on diabetic status: Milan (22), Aviano (23), Italy Multicenter (24), Switzerland-Vaud (25), Germany-Saarland (26), Seattle (OralGen) (27), Seattle (LEO) (28), Tampa (29), Los Angeles (30), Rome (31), Japan (32), and North Carolina (33). The 12 studies comprised 6,448 cases and 13,747 controls for which data on diabetic status, as well as on HNC risk factors and other characteristics were available.
Study Population
Cases were patients with tumors classified by the original studies as invasive tumors of the (1) oral cavity, (2) oropharynx, (3) hypopharynx, (4) larynx, (5) oral cavity or pharynx not otherwise specified or (6) HNC unspecified, as defined previously (21). The pooled studies were all hospital-based, except for both Seattle studies, the North Carolina study and the Los Angeles study. For these four studies, cases were identified from population-based cancer registries. For all of the included studies, controls were frequency-matched on age and sex, with the exception of the Los Angeles study, for which controls were individually matched on age, sex and neighborhood. The Italy Multicenter study additionally matched on center, and the Tampa and North Carolina study additionally matched on race/ethnicity. The date of reference was defined as the date of diagnosis for cases and the date of selection for controls, except for the Seattle (OralGen) study (27)where the reference date for a particular control subject was assigned at random from among the possible case subject diagnosis dates (27). The North Carolina, Tampa and Rome studies restricted eligibility to case subjects with squamous cell carcinomas (SCC). For the other studies, SCC was identified by ICD-O-2 or ICD-0-1 histologic codes, with the exception of the Milan, Aviano and Italy Multicenter study, for which no data were available on histologic type. We excluded all known non-SCC cases (n=205).
Measures and Data Collection
Data collection procedures regarding the data pooling and harmonization have been described in detail (21). All interviews for the studies used in this pooled analysis were face-to-face interviews, with the exception of the Germany-Saarland study, for which a self-administered questionnaire was used. Blank questionnaires were collected from the studies to assess comparability and wording of interview questions. Data from each study were received at the INHANCE Data Coordination Center with personal identifiers removed. Each data item was checked for illogical or missing values and queries were sent to the investigators to resolve inconsistencies.
We classified diabetic status as a binary variable (yes/no). Studies from Tampa, Los Angeles, Rome, North Carolina, Seattle (OralGen) (27), Seattle (LEO) (28), Germany, and Japan had a specific question in the interview that asked whether the subject had ever been diagnosed with diabetes (yes/no). The interview from the Milan, Aviano, Italy, and Switzerland-Vaud studies asked for the age at diabetes, coded as zero for no history of diabetes. Nine out of 12 studies had data on age or date at diagnosis, and this variable was used to estimate duration of diabetes (continuous). Only the Rome study collected information on whether subjects with a history of diabetes were diagnosed with type I or type II diabetes, or had used insulin or oral hypoglycemic agents.
Other relevant subject characteristics, including ethnicity, education, tumor site and histology, cigarette smoking, other tobacco habits, alcohol consumption, height, and weight were harmonized across studies, as described previously (21). Pack-years of cigarette smoking was calculated by multiplying packs (defined as 20 cigarettes) of cigarettes per day and number of years smoking. Alcohol consumption was standardized across studies by first converting beverage-specific number of drinks to ethanol volume in milliliters. The average daily number of ethanol-standardized drinks was then calculated as frequency of consumption of each alcoholic beverage type weighted by the corresponding duration, with the exception of the Tampa, Rome and Germany-Saarland studies in which the average of the frequency of all alcoholic beverage type was used (due to missing data for duration) (34).
Body mass index (BMI) was calculated as weight (in kilograms) divided by height squared (in square meters). Height and weight at the reference date were self-reported. One study also collected data on height and weight 2–5 years prior to diagnosis, and three studies collected data on height and weight between ages 20–30 years. In a previous INHANCE study on the relationship between BMI and HNC, results were similar for analyses using BMI at these differing time periods (35). We thus used BMI at reference date in the analyses for simplicity and completeness.
A number of subjects were missing data on education level (13% of cases and 26% of controls) and BMI (10% of cases and 5% of controls). There were also a small amount of missing data for smoking (1.8% of cases and 1.6% of controls) and alcohol use (3.5% of cases and 2.0% of controls). We thus imputed data on these characteristics conditional upon covariates by using a ‘MICE’ procedure (multiple imputation by chained equations), developed for use in STATA as ‘ICE’ (36). This algorithm uses a sequence of regression equations to impute missing data conditional on other predictors, cycling through the equations until all variables have complete data. We used age, sex, race/ethnicity, study, case/control status, education level, BMI, smoking status, pack years of smoking, alcohol drinking status, and alcohol drinks per day (excluding the variable to be imputed) to impute the missing data.
Statistical Analyses
We estimated adjusted odds ratios (OR) and 95% CI using unconditional logistic regression models. We performed three levels of covariate adjustment: (1) a minimally adjusted model that controlled for age (categorical), sex, education level (categorical), race/ethnicity (categorical), and study center; (2) a model that adjusted for age, sex, education level, race/ethnicity, study center, pack-years of cigarette smoking (continuous), and alcohol drinks per day (continuous); and (3) a model controlling for all the previously listed covariates as well as BMI (continuous). We did not adjust for pipe or cigar smoking because of a substantial amount of missing data for these covariates. Based on previous research that suggested an association between diabetic status and oral cancer risk among women, but not among men (16), we calculated adjusted odds ratios for men and women separately in all primary analyses.
To determine whether a history of diabetes is a risk factor for HNC for those cases not associated with excess tobacco/alcohol, we stratified by cigarette smoking and alcohol drinking status. To statistically assess departures from multiplicative effects on the odds scale we included product terms in these stratified analyses, and used a log-likelihood ratio test to compare logistic models with and without the product terms.
To attempt to disentangle the effects of obesity and diabetes on HNC risk and to explore possible interactions, we also stratified by BMI using categories recommended by the World Health Organization (obese ≥ 30; overweight ≥ 25 and < 30; normal, ≥ 18.5 and < 25; and underweight, < 18.5). The previous INHANCE study on the relationship between BMI and HNC reported effect modification by tobacco alone and by tobacco/alcohol (35). We therefore stratified by BMI in analyses that additionally dichotomized subjects according to tobacco use (ever/never).
To determine whether duration of diabetes is associated with HNC risk, we estimated adjusted ORs for the following exposure categories: (1) no history of diabetes; (2) duration of diabetes less than 10 years; and (3) duration of diabetes greater than 10 years. Based on a previous study showing differential results according to age at diabetes diagnosis (20), we estimated adjusted ORs for the categories: (1) no history of diabetes; (2) diabetes diagnosis before age 50; and (3) diabetes diagnosis after age 50. We additionally examined diabetes diagnosis before or after age 50 stratified by duration of diabetes.
To address possible selection bias due to control participants being systematically healthier than non-participants, we repeated the main analyses after dichotomizing the pooled studies according to participation proportions (<90% (five studies) vs, *≥90% (five studies)). These participation rate percentages were available for all studies, with the exception of the Germany-Saarland study.
We categorized cases by tumor site and performed polytomous logistic regression to assess how the association with diabetes varied across tumor sites. We derived study-specific and summary estimates and evaluated the extent of between-study heterogeneity using the Stata “Metan” command for random effects meta-analyses (37). Finally, we used the “Metainf” module (38) for “leave-one-out” influence analyses to determine whether the associations were dependent on any one study. We used Stata statistical software (version 10.0, Stata Corp.) for all analyses.
Results
Cases were more likely to be male, non-Hispanic White, cigarette smokers, alcohol drinkers, and to have lower BMI compared to controls (Table 1). Of the cases, 18.9% had cancer of the oral cavity, 26.3% had oropharyngeal cancer, and 33.1% had cancer of the larynx. The majority of cases (64.4%) were known to be squamous cell carcinomas, with a sizeable proportion of cases having unknown histologic type (32.5%).
Table 1.
Characteristics of cases and controls with data on history of diabetes, INHANCE Pooled Case-Control Study of Head and Neck Cancer.a
| Characteristic | Cases (n=6,448) | Controls (n=13,747) | ||
|---|---|---|---|---|
| N | % | n | % | |
| Age (years) | ||||
| 17–39 | 237 | 3.7 | 920 | 6.7 |
| 40–44 | 300 | 4.7 | 787 | 5.7 |
| 45–49 | 641 | 9.9 | 1235 | 9.0 |
| 50–54 | 1024 | 15.9 | 2089 | 15.2 |
| 55–59 | 1253 | 19.4 | 2408 | 17.5 |
| 60–64 | 1222 | 19.0 | 2314 | 16.8 |
| 65–69 | 953 | 14.8 | 1946 | 14.2 |
| 70–74 | 596 | 9.2 | 1464 | 10.7 |
| 75–93 | 222 | 3.4 | 584 | 4.3 |
| Sex | ||||
| Men | 5152 | 79.9 | 9810 | 71.4 |
| Women | 1296 | 20.1 | 3937 | 28.6 |
| Race | ||||
| Non-Hispanic White | 5417 | 84.0 | 9805 | 71.3 |
| Black | 445 | 6.9 | 479 | 3.5 |
| Hispanic | 82 | 1.3 | 255 | 1.9 |
| Asian | 471 | 7.3 | 3179 | 23.1 |
| Other | 33 | 0.5 | 29 | 0.2 |
| Study center | ||||
| Milan | 416 | 6.5 | 1531 | 11.1 |
| Aviano | 470 | 7.3 | 821 | 6.0 |
| Italy Multicenter | 1208 | 18.7 | 2545 | 18.5 |
| Switzerland-Vaud | 560 | 8.7 | 820 | 6.0 |
| Seattle (OralGen) | 381 | 5.9 | 607 | 4.4 |
| Tampa | 203 | 3.2 | 893 | 6.5 |
| Los Angeles | 414 | 6.4 | 1005 | 7.3 |
| Rome | 321 | 5.0 | 389 | 2.8 |
| Seattle (LEO) | 587 | 9.1 | 546 | 4.0 |
| Germany-Saarland | 92 | 1.4 | 92 | 0.7 |
| Japan | 433 | 6.7 | 3102 | 22.6 |
| North Carolina | 1363 | 21.1 | 1396 | 10.2 |
| Study design | ||||
| Hospital-based | 3611 | 56.0 | 10101 | 73.5 |
| Population-based | 2837 | 44.0 | 3646 | 26.5 |
| Pack-years of cigarette smokingb | ||||
| Never | 779 | 12.1 | 5429 | 39.5 |
| 1–10 | 351 | 5.4 | 1830 | 13.3 |
| 11–20 | 579 | 9.0 | 1560 | 11.4 |
| 21–30 | 888 | 13.8 | 1420 | 10.3 |
| 31–40 | 975 | 15.1 | 1212 | 8.8 |
| 41–50 | 873 | 13.5 | 835 | 6.1 |
| >50 | 2003 | 31.1 | 1461 | 10.6 |
| Number of alcohol drinks per dayb | ||||
| Never | 710 | 11.0 | 3352 | 24.4 |
| >0 to <1 | 1077 | 16.7 | 3752 | 27.3 |
| 1 to <3 | 1260 | 19.5 | 3244 | 23.6 |
| 3 to <5 | 896 | 13.9 | 1645 | 12.0 |
| ≥5 | 2505 | 38.9 | 1754 | 12.8 |
| Body mass index (in kg/m2) | ||||
| <18.5 | 299 | 4.6 | 287 | 2.1 |
| 18.5 to <25 | 3233 | 50.1 | 6396 | 46.5 |
| 25 to <30 | 2109 | 32.7 | 5208 | 37.9 |
| ≥30 | 807 | 12.5 | 1856 | 13.5 |
| Tumor site | ||||
| Oral cavity | 1218 | 18.9 | ||
| Oropharynx | 1693 | 26.3 | ||
| Hypopharynx | 558 | 8.7 | ||
| Oral cavity/pharynx NOS | 838 | 13.0 | ||
| Larynx | 2135 | 33.1 | ||
| Overlapping head and neck sites | 6 | 0.1 | ||
| Tumor histology | ||||
| Squamous cell | 4287 | 64.4 | ||
| Unknown | 2161 | 32.5 | ||
Percentages have been rounded and may not total 100.
Data from first imputed dataset (out of 4 imputations) used for missing data.
Diabetes was not associated with HNC overall in models adjusted for age, race, sex, study center, education level, pack-years of cigarette smoking, and alcohol drinks per day (OR, 0.95; 95% CI, 0.83–1.08; Table 2) and was weakly associated in models that additionally adjusted for BMI (OR, 1.09; 95% CI, 0.95–1.24). Results for minimally adjusted models were similar to results obtained with adjustment for age, race, sex, study center, education level, pack-years of cigarette smoking, and alcohol drinks per day. ORs were slightly higher for women than for men (Table 2), but a comparison of models with and without a product term for sex and diabetes yielded p=0.09. Adjustment for BMI reported at age 20 to 30, versus BMI reported at the reference date, did not materially affect the estimates (results not shown).
Table 2.
Adjusted odds ratios (OR) and 95% confidence intervals (CI) for the association between head and neck cancer and diabetes (yes/no), INHANCE Pooled Case-Control Study of Head and Neck Cancer
| Diabetes (yes/no) | Cases exposed/unexposed | Controls exposed/unexposed | Covariate Set 1a | Covariate Set 2b,c | ||
|---|---|---|---|---|---|---|
| N | N | OR | (95% CI) | OR | (95% CI) | |
| All | 533/5915 | 1024/12723 | 0.95 | (0.83–1.08) | 1.09 | (0.95–1.24) |
| Women | 118/1178 | 249/3688 | 1.06 | (0.82–1.38) | 1.33 | (1.02–1.73) |
| Men | 415/4737 | 775/9035 | 0.91 | (0.79–1.06) | 1.03 | (0.89–1.19) |
Adjusted for age, race, sex, study center, education level, pack-years of cigarette smoking, and alcohol drinks per day.
Adjusted for age, race, sex, study center, education level, pack-years of cigarette smoking, alcohol drinks per day, and BMI.
Likelihood ratio test for interaction by sex: p=0.09.
The adjusted association between diabetes and HNC was stronger among never smokers (fully adjusted OR, 1.59; 95% CI, 1.22–2.07) than among ever smokers (fully adjusted OR, 0.96; 95% CI, 0.83–1.11; p=0.001 for homogeneity of the OR; Table 3). The pattern of results among never smokers and never alcohol drinkers versus ever smokers and drinkers was similar to those obtained by stratification on smoking status alone, but ORs were not as high in the never smoking-drinking category as those obtained in the never smoking category. There was an interaction by smoking status in comparisons of models that did and did not include a product interaction term for smoking and diabetes (likelihood ratio p=0.001), but not in models with and without an interaction term for alcohol and diabetes (p=0.36). In analyses that classified smoking status as never, former or current, the OR’s were highest for never smokers (fully adjusted OR, 1.61; 95% CI, 1.24–2.10; Supplemental Table 1), lower for former smokers (fully adjusted OR, 1.14; 95% CI, 0.94–1.39) and lowest for current smokers (fully adjusted OR, 0.91; 95% CI, 0.73–1.12).
Table 3.
Adjusted odds ratios (OR) and 95% confidence intervals (CI) for the association between head and neck cancer and diabetes (yes/no) by cigarette smoking and alcohol drinking status,a INHANCE Pooled Case-Control Study of Head and Neck Cancer
| Diabetes (yes/no) | Cases exposed/unexposed | Controls exposed/unexposed | Covariate Set 1b | Covariate Set 2c,d | ||
|---|---|---|---|---|---|---|
| N | N | OR | (95% CI) | OR | (95% CI) | |
| Never cigarette smokers | ||||||
| All | 82/694 | 366/5047 | 1.38 | (1.06–1.79) | 1.59 | (1.22–2.07) |
| Women | 39/309 | 164/2370 | 1.39 | (1.02–1.89) | 1.70 | (1.25–2.32) |
| Men | 43/385 | 202/2677 | 1.36 | (1.00–1.84) | 1.49 | (1.10–2.03) |
| Ever cigarette smokers | ||||||
| All | 451/5221 | 658/7676 | 0.85 | (0.73–0.98) | 0.96 | (0.83–1.11) |
| Women | 79/869 | 85/1318 | 0.86 | (0.64–1.16) | 1.07 | (0.79–1.45) |
| Men | 372/4352 | 573/6358 | 0.84 | (0.73–0.98) | 0.94 | (0.81–1.10) |
| Never cigarette smokers and never alcohol drinkers | ||||||
| All | 33/242 | 172/1827 | 1.04 | (0.69–1.56) | 1.26 | (0.83–1.91) |
| Women | 22/162 | 103/1157 | 1.00 | (0.65–1.54) | 1.26 | (0.81–1.96) |
| Men | 11/80 | 69/670 | 1.12 | (0.68–1.83) | 1.26 | (0.76–2.06) |
| Ever cigarette smokers and ever alcohol drinkers | ||||||
| All | 398/4866 | 534/6516 | 0.84 | (0.72–0.98) | 0.98 | (0.84–1.14) |
| Women | 57/732 | 54/933 | 0.76 | (0.52–1.12) | 0.98 | (0.66–1.45) |
| Men | 341/4134 | 480/5583 | 0.85 | (0.73–1.00) | 0.98 | (0.83–1.15) |
Numbers of never smokers/drinkers do not match numbers for zero pack years/drinks per day because missing data for these variables were simultaneously imputed.
Adjusted for age, race, sex, study centers, education level, pack-years of cigarette smoking (if ever smoker), and alcohol drinks per day (if ever drinker).
Adjusted for age, race, sex, study centers, education level, pack-years of cigarette smoking (if ever smoker), alcohol drinks per day (if ever drinker), and BMI.
Likelihood ratio test for interaction by smoking status: p=0.001; and by alcohol drinking status: p=0.36.
We observed little departure from multiplicativity of effects for diabetes and BMI (likelihood ratio p=0.25), and there was no discernable pattern in the results of analyses stratified by BMI, either overall or dichotomized by sex (results not shown). Among never smokers, there was a slight indication of an elevated risk of HNC associated with diabetes among normal weight and overweight subjects (fully adjusted OR, 1.64; 95% CI, 0.92–2.93 and fully adjusted OR, 1.42, 95% CI, 0.86–2.33 respectively), but not underweight or obese subjects (fully adjusted OR, 1.13; 95% CI, 0.37–3.49 and fully adjusted OR, 1.12, 95% CI, 0.66–1.92 respectively).
There was no strong evidence of heterogeneity by tumor site in the association between diabetes and HNC (Supplemental Table 2). In sex-specific strata, results for women were close to unity for all sites except the hypopharynx; however, wide confidence intervals limit interpretation. There was some indication of heterogeneity by tumor site when analyses were stratified by smoking status (Supplemental Table 3). Among never smokers, ORs appeared to be greatest for oral cavity and larynx cancers, with null results for oropharyngeal cancers. However, small sample sizes within strata limited our ability to draw meaningful conclusions. In a fully-adjusted polytomous logistic regression model, we did not observe associations between history of diabetes and HNC risk across tumor sites.
Compared to subjects with no history of diabetes, those with diabetes for less than 10 years had a small elevated OR (fully adjusted OR, 1.15; 95% CI, 0.95–1.39; Supplemental Table 4), with similar results obtained for those with diabetes greater than 10 years (fully adjusted OR, 1.16; 95% CI, 0.90–1.49). Compared to non-diabetics, we observed an elevated association between HNC and diabetes diagnosed before age 50 (fully adjusted OR, 1.37; 95% CI, 1.07–1.74), and no association for those diagnosed after age 50 (fully adjusted OR, 1.00; 95% CI, 0.83–1.20). We observed the same pattern for men, but ORs for women diagnosed before and after age 50 were both similarly elevated. An analysis of diabetes diagnosis before or after age 50 stratified by duration of diabetes did not provide meaningful results due to small stratum specific numbers, and did not yield evidence of a particularly unique subgroup (results not shown).
Among the eleven studies with information on control participation proportions, the fully adjusted OR was 1.09 (95% CI, 0.96–1.24). The estimate from five studies with control participation rates below 90% (OR=1.11; 95% CI, 0.89–1.38) was similar to the estimate from six studies with control participation rates above 90% (OR=1.09; 95% CI, 0.92–1.29).
There was evidence of heterogeneity in a meta-analyses of the study-specific ORs (chi-squared p=0.002; Figure 1). “Leave-one-out” influence analyses indicated that the North Carolina study had a large impact on results, due to its unique inverse relationship between diabetes and HNC (Figure 2). The association between history of diabetes and HNC in fully adjusted models was greater when the North Carolina study was excluded (OR=1.19; 95% CI, 1.02–1.38). Similarly, the association among never smokers was appreciably increased after exclusion of the North Carolina study (OR=1.91; 95% CI, 1.39–2.62); with the association among ever smokers increasing slightly after exclusion, but remaining close to unity (OR=1.07; 95% CI, 0.90–1.26).
Figure 1. Forest plot of study-specific ORs and 95% CIs for the association between history of diabetes and HNC risk, INHANCE Pooled Case-Control Study of Head and Neck Cancer.
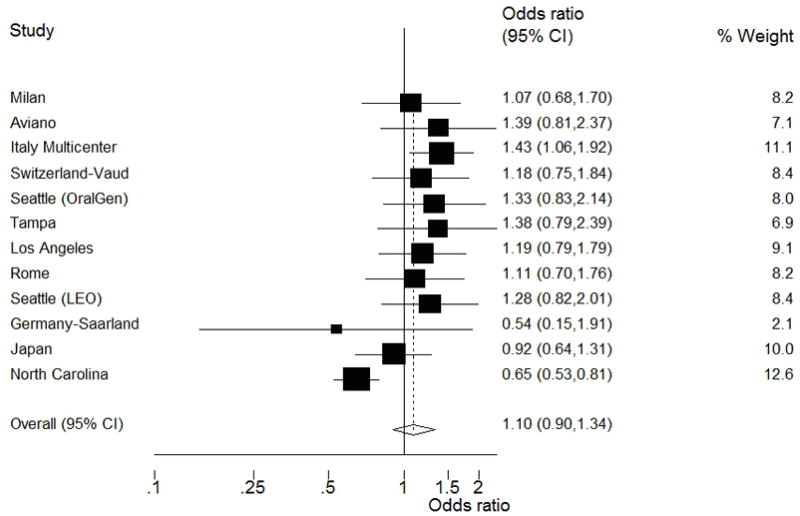
The squares represent the OR estimates and the horizontal lines represent the 95% CIs for each study. The area of the square reflects the weight that the study contributes. This random-effects model incorporates an estimate of between-study heterogeneity in the weighting. The diamond at the center indicates the random-effects estimate and the width of the diamond indicates the 95% CI.
Figure 2. Influence analyses of single studies on the overall estimate for the association between history of diabetes and HNC risk, INHANCE Pooled Case-Control Study of Head and Neck Cancer.
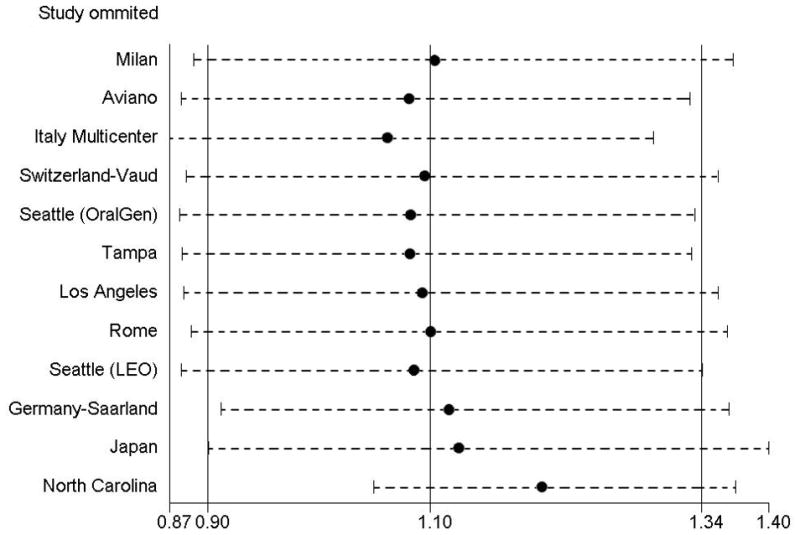
The circle for each study represents the OR estimate and the horizontal line represents the 95% CI from the pooled data after excluding that study. The three vertical lines represent the random-effects pooled point estimate and associated 95% CI.
Discussion
In this large pooled analysis of 12 international studies, we observed a weak association between history of diabetes and risk of HNC overall. However, we observed a stronger association between history of diabetes and HNC in never smokers. In addition, we observed a positive association between diabetes diagnosed before age 50 and HNC.
An association between history of diabetes and HNC only in never smokers may exist if the diabetic condition affects an, as yet, unknown causal pathway for HNC among never smokers. Alternatively, a substantial proportion of people who are both heavy smokers and diabetic and who would have developed HNC in the future, may be at particular risk for early death or illness, and may have died before developing HNC. A third possibility is that adjustment for pack years of smoking is not sufficient to remove all confounding among smokers, and that examining the association between a history of diabetes and HNC among never smokers circumvents this source of residual confounding. This possibility is supported by results from studies on the association between HNC and BMI, which is strongly associated with diabetes (39,40). A recent INHANCE pooled analysis observed an etiologically improbable reduced risk of HNC associated with overweight and obesity even after adjustment for duration and intensity of smoking (35). However, when analyses were confined to never smokers, the reduced risk associated with overweight and obesity was attenuated to the null.
We observed a positive association between HNC and diabetes diagnosed before age 50, and no association for those diagnosed after age 50. Only 5 cases and 9 controls were diagnosed with diabetes before age 20, making it unlikely that these results were due to the inclusion of type I diabetics. Cases diagnosed as diabetic before age 50 had a mean age of 55 at HNC diagnosis and a mean duration of diabetes of 15 years, while cases with a diabetes diagnosis over age 50 had a mean age of 64 at HNC diagnosis and a mean diabetes duration of 6 years. These data suggest that a younger age of type II diabetes onset may confer particular risk for subsequent development of HNC, and that these cancers may develop at a relatively young age. The difference according to age may partly be explained by the observation that younger HNC patients are less likely to have extensive histories of tobacco and alcohol use (41,42). The longer duration of exposure to the diabetic condition could also explain the increased risk for younger patients. In addition, it has been suggested that adults diagnosed with diabetes at a younger age may represent a more aggressive phenotype than people diagnosed late in life (43), and thus the diabetic condition in older people may not predispose to HNC to the same degree as in younger diabetics. The exclusion of several studies due to lack of diabetes diagnosis age data and the small numbers in each of the strata limit interpretation of these results.
Results from the majority of studies in these pooled analyses indicated a positive relationship between history of diabetes and HNC, with the notable exception of the North Carolina study, for which an inverse relationship was observed. Subjects from the North Carolina study made up 14% of the total pooled sample, resulting in a relatively heavy influence of this study on the overall results. A notable difference in the North Carolina study is the high prevalence of diabetes among controls (17%) (44) compared with controls from other US studies and other countries (mean prevalence of 6% in controls for all other studies). The North Carolina study population had a larger proportion of African Americans than other studies; however race is unlikely to play a role because cases and controls were frequency matched on race and estimates were adjusted for race.
Our results support previous research suggesting involvement of abnormal glucose metabolism in HNC. Suba et al. conducted a hospital-based case-control study in Hungary in 2,660 in-patients with confirmed OSCC and 2,980 “complaint-free” controls who volunteered to participate in oral cancer screenings during the same period, and observed that repeatedly elevated (>5.5 mmol/l) fasting glucose over a period of 4 days was strongly associated with oral cancer in females (OR, 1.61; no 95% CI reported; p<0.05), but that no such association existed in males (OR, 0.97; p>0.05) (16). Cases and controls were matched on age, but no adjustment was made for, or effect modification examined with, known OSCC risk factors. In a study on the risk of multiple cancers in a nationwide cohort of diabetics in Denmark, Wideroff et al. reported increased risk of mouth/pharynx cancer associated with diabetes (20). However, there were only 30 cases in those analyses. Additionally, the association was only observed in subjects less than 50 years old at diabetes diagnosis (standardized incidence ratios (SIR) based on age, sex and calendar year, 1.8; 95% CI, 1.2–2.6). The estimates were similar for males and females.
In a previous pooled INHANCE study, it was observed that HNC risk is elevated among lean people and reduced among overweight or obese people (35). If overweight and obesity are negatively associated with HNC, it could be argued that this makes a positive association between diabetes and HNC less likely since obesity is strongly associated with conditions such as metabolic syndrome, and an increased risk of developing insulin resistance, followed by glucose intolerance and type II diabetes (45,46). However, glucose intolerance can also occur independently of insulin resistance (46–48).
Diabetes is emerging as more of a heterogeneous disease than initially thought, with subtypes of people who are classified as type II diabetics, but who exhibit defects in insulin secretion with no evidence of insulin resistance. Examples include maturity-onset diabetes of the young (MODY) (49) and mitochondrial diabetes (50). There are also populations that have type II diabetes, especially in Asia, who are not overweight or obese by Western criteria. For example, in a study of type II diabetics in Taiwan, only 43% of women and 48% of men had a BMI greater than 25 kg/m2 (51). These observations suggest that, although there is an association of overweight with diabetes, the diabetic condition is a distinct disease state that frequently also develops in people who are not overweight.
Hyperglycemia and associated biochemical consequences, independent of obesity-linked characteristics of diabetes, may be a mechanism by which diabetes increases the risk of cancer. Interestingly, several prospective cohort studies indicate that cancer risk starts to increase at blood glucose levels even below the diabetic range. Studies in Korea (52), Austria (53) and Sweden (54)found a linear increase in risk for multiple cancers across the entire spectrum of glucose values, regardless of weight.
A limitation of this study is that we were only able to examine self-reported diabetic status, which may have resulted in exposure misclassification. In the United States, it is estimated that one third of type II diabetics are undiagnosed (55). However, we have no reason to believe that this misclassification would differ between cases and controls; thus any error from this source is most likely to bias results toward the null. The heterogeneity of HNC may also hinder the ability to adequately examine whether diabetes is a risk factor. Weak or inconsistent associations with all HNC may result if the subtypes of HNC are etiologically distinct. Although we performed analyses for separate sites (larynx, hypopharynx, oropharynx, oral cavity, and non-specific pharynx), small sample sizes prevented meaningful interpretation of the results. The inability to control for HPV infection is a further limitation. However, cancers occurring in the oropharynx, as opposed to other HNC sites, are most strongly associated with HPV infection (27,56,57), and we are not aware of any studies that suggest that diabetics are more likely to be infected with HPV.
We did not have sufficient data to adjust for factors such as diabetic medication use or extent of glycemic control in this study. Many diabetics are able to maintain good glycemic control and/or lowered insulin levels by oral hypoglycemic agents, diet, appropriate use of exogenous insulin, etc. In addition, recent evidence suggests that some oral hypoglycemic agents used to treat diabetes, such as metformin, may reduce incidence of a wide variety of cancers (58). Researchers have observed an association of use of exogenous insulin with increased risk of cancer of the breast, colon, pancreas, prostate, or any solid tumor (59), and increased risk of death from any type of cancer (60). Among 710 subjects who reported a history of diabetes and who had data on insulin use in the present study, 33% were insulin users. Between the years 1997 to 2008 in the United States, the proportion of diabetics aged 65–74 using any diabetes medication (pills, insulin or both) ranged from 83.2% to 90.0% (61). Even if rates of medication use are not this high in our international pooled data, it is nonetheless likely that a large percentage of diabetics were taking oral hypoglycemic agents. Thus, the diabetes effect in the absence of treatment might be stronger than the association observed in our study.
Selection bias may have influenced results in a positive or negative direction. Diabetics are more likely to have multiple hospitalizations than non-diabetics (62,63), creating a selection bias when controls are recruited in hospital-based studies. The possible influence of bias due to controls in hospital-based studies was difficult to evaluate because exclusion of the hospital-based studies increased the proportional influence of the North Carolina study on the results, attenuating the odds ratio toward the null. An alternative source of selection bias may occur if control participants are systematically healthier than control non-participants, thus spuriously raising the OR. However, this source of bias is unlikely because the pooled OR for studies with control participation rates less than 90% was almost identical to the OR for studies with control participation above 90%.
Conclusion
In this large pooled analysis of 12 case-control studies, we observed a weak association between diabetes and HNC in all subjects, adjusting for several potential confounders; however, we did find a modest association among never smokers. Prospective studies, with data that more accurately captures potential confounding relationships, may provide insight into a possible relationship between glucose metabolism abnormalities and HNC.
Supplementary Material
Acknowledgments
INHANCE Pooled Data Project: NCI R03CA113157;
Aviano and Italy multicentre studies: Italian Association for Research on Cancer (AIRC), Italian League Against Cancer and Italian Ministry of Research;
Germany-Saarland study: Ministry of Science, Research and Arts Baden-Württemberg;
Japan: Scientific Research grant from the Ministry of Education, Science, Sports, Culture and Technology of Japan (17015052) and grant for the Third-Term Comprehensive 10-Year Strategy for Cancer Control from the Ministry of Health, Labor and Welfare of Japan (H20-002);
Los Angeles study: National Institute of Health (NIH) US [P50CA090388, R01DA011386, R03CA077954, T32CA009142, U01CA096134, R21ES011667] and the Alper Research Program for Environmental Genomics of the UCLA Jonsson Comprehensive Cancer Center;
Milan study: Italian Association for Research on Cancer (AIRC);
North Carolina study: National Institutes of Health (NIH) US [R01CA061188], and in part by a grant from the National Institute of Environmental Health Sciences [P30ES010126];
Rome study: AIRC (Italian Agency for Research on Cancer);
Swiss study: Swiss League against Cancer and the Swiss Research against Cancer/Oncosuisse [KFS-700, OCS-1633];
Seattle-LEO study: (NIH) US [R01CA030022];
Seattle-OralGen study: National Institutes of Health (NIH) US [R01CA048896, R01DE012609];
Tampa study: National Institutes of Health (NIH) US [P01CA068384, K07CA104231, R01DE013158].
Footnotes
CONFLICTS OF INTEREST: No potential conflicts of interest.
References
- 1.Nilsen TI, Vatten LJ. Prospective study of colorectal cancer risk and physical activity, diabetes, blood glucose and BMI: exploring the hyperinsulinaemia hypothesis. Br J Cancer. 2001;84:417–22. doi: 10.1054/bjoc.2000.1582. [DOI] [PMC free article] [PubMed] [Google Scholar]
- 2.Gapstur SM, Gann PH, Lowe W, Liu K, Colangelo L, Dyer A. Abnormal glucose metabolism and pancreatic cancer mortality. JAMA. 2000;283:2552–8. doi: 10.1001/jama.283.19.2552. [DOI] [PubMed] [Google Scholar]
- 3.Michels KB, Solomon CG, Hu FB, Rosner BA, Hankinson SE, Colditz GA, et al. Type 2 diabetes and subsequent incidence of breast cancer in the Nurses’ Health Study. Diabetes Care. 2003;26:1752–8. doi: 10.2337/diacare.26.6.1752. [DOI] [PubMed] [Google Scholar]
- 4.Jee SH, Ohrr H, Sull JW, Yun JE, Ji M, Samet JM. Fasting serum glucose level and cancer risk in Korean men and women. JAMA. 2005;293:194–202. doi: 10.1001/jama.293.2.194. [DOI] [PubMed] [Google Scholar]
- 5.Stattin P, Bjor O, Ferrari P, Lukanova A, Lenner P, Lindahl B, et al. Prospective study of hyperglycemia and cancer risk. Diabetes Care. 2007;30:561–7. doi: 10.2337/dc06-0922. [DOI] [PubMed] [Google Scholar]
- 6.Giovannucci E, Harlan DM, Archer MC, Bergenstal RM, Gapstur SM, Habel LA, et al. Diabetes and cancer: a consensus report. CA Cancer J Clin. 2010;60(4):207–21. doi: 10.3322/caac.20078. [DOI] [PubMed] [Google Scholar]
- 7.Brownlee M. Biochemistry and molecular cell biology of diabetic complications. Nature. 2001;414:813–20. doi: 10.1038/414813a. [DOI] [PubMed] [Google Scholar]
- 8.Basta G, Schmidt AM, De Caterina R. Advanced glycation end products and vascular inflammation: implications for accelerated atherosclerosis in diabetes. Cardiovasc Res. 2004;63:582–92. doi: 10.1016/j.cardiores.2004.05.001. [DOI] [PubMed] [Google Scholar]
- 9.Adams TE, McKern NM, Ward CW. Signalling by the type 1 insulin-like growth factor receptor: interplay with the epidermal growth factor receptor. Growth Factors. 2004;22(2):89–95. doi: 10.1080/08977190410001700998. [DOI] [PubMed] [Google Scholar]
- 10.Grimberg A, Cohen P. Role of insulin-like growth factors and their binding proteins in growth control and carcinogenesis. J Cell Physiol. 2000;183:1–9. doi: 10.1002/(SICI)1097-4652(200004)183:1<1::AID-JCP1>3.0.CO;2-J. [DOI] [PMC free article] [PubMed] [Google Scholar]
- 11.Renehan AG, Zwahlen M, Minder C, O’Dwyer ST, Shalet SM, Egger M. Insulin-like growth factor (IGF)-I, IGF binding protein-3, and cancer risk: systematic review and meta-regression analysis. Lancet. 2004;363:1346–53. doi: 10.1016/S0140-6736(04)16044-3. [DOI] [PubMed] [Google Scholar]
- 12.Valentinis B, Baserga R. IGF-I receptor signalling in transformation and differentiation. Mol Pathol. 2001;54:133–7. doi: 10.1136/mp.54.3.133. [DOI] [PMC free article] [PubMed] [Google Scholar]
- 13.Ferlay J, Shin HR, Bray F, Forman D, Mathers C, Parkin DM. Estimates of worldwide burden of cancer in 2008: GLOBOCAN 2008. Int J Cancer. 2010 doi: 10.1002/ijc.25516. [DOI] [PubMed] [Google Scholar]
- 14.Hennessey PT, Westra WH, Califano JA. Human papillomavirus and head and neck squamous cell carcinoma: recent evidence and clinical implications. J Dent Res. 2009;88:300–6. doi: 10.1177/0022034509333371. [DOI] [PMC free article] [PubMed] [Google Scholar]
- 15.Mork J, Lie AK, Glattre E, Hallmans G, Jellum E, Koskela P, et al. Human papillomavirus infection as a risk factor for squamous-cell carcinoma of the head and neck. N Engl J Med. 2001;344:1125–9. doi: 10.1056/NEJM200104123441503. [DOI] [PubMed] [Google Scholar]
- 16.Suba Z. Gender-related hormonal risk factors for oral cancer. Pathol Oncol Res. 2007;13(3):195–202. doi: 10.1007/BF02893499. [DOI] [PubMed] [Google Scholar]
- 17.Dietrich T, Reichart PA, Scheifele C. Clinical risk factors of oral leukoplakia in a representative sample of the US population. Oral Oncology. 2004;40:158–63. doi: 10.1016/s1368-8375(03)00145-3. [DOI] [PubMed] [Google Scholar]
- 18.Dikshit RP, Ramadas K, Hashibe M, Thomas G, Somanathan T, Sankaranarayanan R. Association between diabetes mellitus and pre-malignant oral diseases: A cross sectional study in Kerala, India. Int J Cancer. 2006;118:453–7. doi: 10.1002/ijc.21345. [DOI] [PubMed] [Google Scholar]
- 19.Albrecht M, Bánóczy J, Dinya E, Tamás G., Jr Occurrence of oral leukoplakia and lichen planus in diabetes mellitus. J Oral Pathol Med. 1992;21(8):364–6. doi: 10.1111/j.1600-0714.1992.tb01366.x. [DOI] [PubMed] [Google Scholar]
- 20.Wideroff L, Gridley G, Mellemkjaer L, Chow WH, Linet M, Keehn S, et al. Cancer incidence in a population-based cohort of patients hospitalized with diabetes mellitus in Denmark. J Natl Cancer Inst. 1997;89(18):1360–5. doi: 10.1093/jnci/89.18.1360. [DOI] [PubMed] [Google Scholar]
- 21.Hashibe M, Brennan P, Benhamou S, Castellsague X, Chen C, Curado MP, et al. Alcohol drinking in never users of tobacco, cigarette smoking in never drinkers, and the risk of head and neck cancer: pooled analysis in the International Head and Neck Cancer Epidemiology Consortium. J Natl Cancer Inst. 2007;99:777–89. doi: 10.1093/jnci/djk179. [DOI] [PubMed] [Google Scholar]
- 22.Bosetti C, Gallus S, Trichopoulou A, Talamini R, Franceschi S, Negri E, et al. Influence of the Mediterranean diet on the risk of cancers of the upper aerodigestive tract. Cancer Epidemiol Biomarkers Prev. 2003;12(10):1091–4. [PubMed] [Google Scholar]
- 23.Franceschi S, Talamini R, Barra S, Barón AE, Negri E, Bidoli E, et al. Smoking and drinking in relation to cancers of the oral cavity, pharynx, larynx, and esophagus in northern Italy. Cancer Res. 1990;50(20):6502–7. [PubMed] [Google Scholar]
- 24.Baron AE, Franceschi S, Barra S, Talamini R, La Vecchia C. A comparison of the joint effects of alcohol and smoking on the risk of cancer across sites in the upper aerodigestive tract. Cancer Epidemiol Biomarkers Prev. 1993;2(6):519–23. [PubMed] [Google Scholar]
- 25.Levi F, Pasche C, La Vecchia C, Lucchini F, Franceschi S, Monnier P. Food groups and risk of oral and pharyngeal cancer. Int J Cancer. 1998;77(5):705–9. doi: 10.1002/(sici)1097-0215(19980831)77:5<705::aid-ijc8>3.0.co;2-z. [DOI] [PubMed] [Google Scholar]
- 26.Haug U, Hillebrand T, Bendzko P, Löw M, Rothenbacher D, Stegmaier C, et al. Mutant-enriched PCR and allele-specific hybridization reaction to detect K-ras mutations in stool DNA: high prevalence in a large sample of older adults. Clin Chem. 2007;53(4):787–90. doi: 10.1373/clinchem.2006.078188. [DOI] [PubMed] [Google Scholar]
- 27.Schwartz SM, Daling JR, Doody DR, Wipf GC, Carter JJ, Madeleine MM, et al. Oral cancer risk in relation to sexual history and evidence of human papillomavirus infection. J Natl Cancer Inst. 1998;90:1626–36. doi: 10.1093/jnci/90.21.1626. [DOI] [PubMed] [Google Scholar]
- 28.Vaughan TL, Stewart PA, Davis S, Thomas DB. Work in dry cleaning and the incidence of cancer of the oral cavity, larynx, and oesophagus. Occup Environ Med. 1997;54(9):692–5. doi: 10.1136/oem.54.9.692. [DOI] [PMC free article] [PubMed] [Google Scholar]
- 29.Elahi A, Zheng Z, Park J, Eyring K, McCaffrey T, Lazarus P. The human OGG1 DNA repair enzyme and its association with orolaryngeal cancer risk. Carcinogenesis. 2002;23(7):1229–34. doi: 10.1093/carcin/23.7.1229. [DOI] [PubMed] [Google Scholar]
- 30.Cui Y, Morgenstern H, Greenland S, Tashkin DP, Mao J, Cao W, et al. Polymorphism of Xeroderma Pigmentosum group G and the risk of lung cancer and squamous cell carcinomas of the oropharynx, larynx and esophagus. Int J Cancer. 2006;118(3):714–20. doi: 10.1002/ijc.21413. [DOI] [PubMed] [Google Scholar]
- 31.Boccia S, Cadoni G, Sayed-Tabatabaei FA, Volante M, Arzani D, De Lauretis A, et al. CYP1A1, CYP2E1, GSTM1, GSTT1, EPHX1 exons 3 and 4, and NAT2 polymorphisms, smoking, consumption of alcohol and fruit and vegetables and risk of head and neck cancer. J Cancer Res Clin Oncol. 2008;134(1):93–100. doi: 10.1007/s00432-007-0254-5. [DOI] [PubMed] [Google Scholar]
- 32.Sugimura T, Kumimoto H, Tohnai I, Fukui T, Matsuo K, Tsurusako S, et al. Gene-environment interaction involved in oral carcinogenesis: molecular epidemiological study for metabolic and DNA repair gene polymorphisms. J Oral Pathol Med. 2006;35(1):11–8. doi: 10.1111/j.1600-0714.2005.00364.x. [DOI] [PubMed] [Google Scholar]
- 33.Divaris K, Olshan AF, Smith J, Bell ME, Weissler MC, Funkhouser WK, et al. Oral health and risk for head and neck squamous cell carcinoma: the Carolina Head and Neck Cancer Study. Cancer Causes Control. 2010;21(4):567–75. doi: 10.1007/s10552-009-9486-9. [DOI] [PMC free article] [PubMed] [Google Scholar]
- 34.Purdue MP, Hashibe M, Berthiller J, La Vecchia C, Dal Maso L, Herrero R, et al. Type of alcoholic beverage and risk of head and neck cancer--a pooled analysis within the INHANCE Consortium. Am J Epidemiol. 2009;169(2):132–42. doi: 10.1093/aje/kwn306. [DOI] [PMC free article] [PubMed] [Google Scholar]
- 35.Gaudet MM, Olshan AF, Chuang SC, Berthiller J, Zhang ZF, Lissowska J, et al. Body mass index and risk of head and neck cancer in a pooled analysis of case-control studies in the International Head and Neck Cancer Epidemiology (INHANCE) Consortium. Int J Epidemiol. 2010;39(4):1091–102. doi: 10.1093/ije/dyp380. [DOI] [PMC free article] [PubMed] [Google Scholar]
- 36.Royston P. Multiple imputation of missing values. Stata J. 2004;4:227–241. [Google Scholar]
- 37.Harris R, Deeks J, Altman DG, Bradburn MJ, Harbord R, Sterne JAC. Metan: fixed and random effects meta-analysis. Stata J. 2008;8:3. [Google Scholar]
- 38.Tobias A. sbe26: assessing the influence of a single study in the meta-analysis estimate. Stata Tech Bull. 1999;47:15–17. [Google Scholar]
- 39.Ford ES, Williamson DF, Liu S. Weight change and diabetes incidence: findings from a national cohort of US adults. Am J Epidemiol. 1997;146:214–222. doi: 10.1093/oxfordjournals.aje.a009256. [DOI] [PubMed] [Google Scholar]
- 40.Narayan KM, Boyle JP, Thompson TJ, Gregg EW, Williamson DF. Effect of BMI on lifetime risk for diabetes in the U. S Diabetes Care. 2007;30(6):1562–6. doi: 10.2337/dc06-2544. [DOI] [PubMed] [Google Scholar]
- 41.Hashibe M, Brennan P, Chuang SC, Boccia S, Castellsague X, Chen C, et al. Interaction between tobacco and alcohol use and the risk of head and neck cancer: pooled analysis in the International Head and Neck Cancer Epidemiology Consortium. Cancer Epidemiol Biomarkers Prev. 2009;18(2):541–50. doi: 10.1158/1055-9965.EPI-08-0347. [DOI] [PMC free article] [PubMed] [Google Scholar]
- 42.Llewellyn CD, Johnson NW, Warnakulasuriya KA. Risk factors for squamous cell carcinoma of the oral cavity in young people–a comprehensive literature review. Oral Oncol. 2001;37(5):401–18. doi: 10.1016/s1368-8375(00)00135-4. [DOI] [PubMed] [Google Scholar]
- 43.Hillier TA, Pedula KL. Complications in young adults with early-onset type 2 diabetes: losing the relative protection of youth. Diabetes Care. 2003;26(11):2999–3005. doi: 10.2337/diacare.26.11.2999. [DOI] [PubMed] [Google Scholar]
- 44. [Accessed June 8, 2011.];North Carolina Diabetes Prevention and Control Fact Sheet. 2009 Sep; http://www.ncdiabetes.org/factsFigures/index.aspx.
- 45.Kahn SE, Hull RL, Utzschneider KM. Mechanisms linking obesity to insulin resistance and type 2 diabetes. Nature. 2006;444(7121):840–6. doi: 10.1038/nature05482. [DOI] [PubMed] [Google Scholar]
- 46.Stumvoll M, Goldstein BJ, van Haeften TW. Type 2 diabetes: principles of pathogenesis and therapy. Lancet. 2005;365(9467):1333–46. doi: 10.1016/S0140-6736(05)61032-X. [DOI] [PubMed] [Google Scholar]
- 47.Gerich JE. The genetic basis of type 2 diabetes mellitus: impaired insulin secretion versus impaired insulin sensitivity. Endocr Rev. 1998;19(4):491–503. doi: 10.1210/edrv.19.4.0338. [DOI] [PubMed] [Google Scholar]
- 48.Arner P, Pollare T, Lithell H. Different aetiologies of type 2 (noninsulin-dependent) diabetes mellitus in obese and nonobese subjects. Diabetologia. 1991;34:483–487. doi: 10.1007/BF00403284. [DOI] [PubMed] [Google Scholar]
- 49.Fajans SS, Bell GI, Polonsky KS. Molecular mechanisms and clinical pathophysiology of maturity-onset diabetes of the young. N Engl J Med. 2001;345(13):971–80. doi: 10.1056/NEJMra002168. [DOI] [PubMed] [Google Scholar]
- 50.Maassen JA, ‘T Hart LM, Van Essen E, Heine RJ, Nijpels G, Jahangir Tafrechi RS, et al. Mitochondrial diabetes: molecular mechanisms and clinical presentation. Diabetes. 2004;53 (Suppl 1):S103–9. doi: 10.2337/diabetes.53.2007.s103. [DOI] [PubMed] [Google Scholar]
- 51.Tseng CH. Body mass index and waist circumference as determinants of coronary artery disease in Taiwanese adults with type 2 diabetes mellitus. Int J Obes (Lond) 2006;30:816–21. doi: 10.1038/sj.ijo.0803218. [DOI] [PubMed] [Google Scholar]
- 52.Jee SH, Ohrr H, Sull JW, Yun JE, Ji M, Samet JM. Fasting serum glucose level and cancer risk in Korean men and women. JAMA. 2005;293(2):194–202. doi: 10.1001/jama.293.2.194. [DOI] [PubMed] [Google Scholar]
- 53.Rapp K, Schroeder J, Klenk J, Ulmer H, Concin H, Diem G, et al. Fasting blood glucose and cancer risk in a cohort of more than 140,000 adults in Austria. Diabetologia. 2006;49(5):945–52. doi: 10.1007/s00125-006-0207-6. [DOI] [PubMed] [Google Scholar]
- 54.Stattin P, Björ O, Ferrari P, Lukanova A, Lenner P, Lindahl B, et al. Prospective study of hyperglycemia and cancer risk. Diabetes Care. 2007;30(3):561–7. doi: 10.2337/dc06-0922. [DOI] [PubMed] [Google Scholar]
- 55.Harris MI, Eastman RC. Early detection of undiagnosed diabetes mellitus: a US perspective. Diabetes Metab Res Rev. 2000;16(4):230–6. doi: 10.1002/1520-7560(2000)9999:9999<::aid-dmrr122>3.0.co;2-w. [DOI] [PubMed] [Google Scholar]
- 56.Mork J, Lie AK, Glattre E, Hallmans G, Jellum E, Koskela P, et al. Human papillomavirus infection as a risk factor for squamous-cell carcinoma of the head and neck. N Engl J Med. 2001;344:1125–9. doi: 10.1056/NEJM200104123441503. [DOI] [PubMed] [Google Scholar]
- 57.D’Souza G, Kreimer AR, Viscidi R, Pawlita M, Fakhry C, Koch WM, et al. Case-control study of human papillomavirus and oropharyngeal cancer. N Engl J Med. 2007;356:1944–56. doi: 10.1056/NEJMoa065497. [DOI] [PubMed] [Google Scholar]
- 58.Decensi A, Puntoni M, Goodwin P, Cazzaniga M, Gennari A, Bonanni B, et al. Metformin and cancer risk in diabetic patients: a systematic review and meta-analysis. Cancer Prev Res (Phila) 2010;3(11):1451–61. doi: 10.1158/1940-6207.CAPR-10-0157. [DOI] [PubMed] [Google Scholar]
- 59.Currie CJ, Poole CD, Gale EA. The influence of glucose-lowering therapies on cancer risk in type 2 diabetes. Diabetologia. 2009;52(9):1766–77. doi: 10.1007/s00125-009-1440-6. [DOI] [PubMed] [Google Scholar]
- 60.Bowker SL, Majumdar SR, Veugelers P, Johnson JA. Increased cancer-related mortality for patients with type 2 diabetes who use sulfonylureas or insulin. Diabetes Care. 2006;29:254–8. doi: 10.2337/diacare.29.02.06.dc05-1558. [DOI] [PubMed] [Google Scholar]
- 61.Centers for Disease Control and Prevention. [Accessed June 8, 2011.];Diabetes Data and Trends. http://www.cdc.gov/diabetes/statistics/treating_national.htm.
- 62.Jiang HJ, Stryer D, Friedman B, Andrews R. Multiple hospitalizations for patients with diabetes. Diabetes Care. 2003;26(5):1421–6. doi: 10.2337/diacare.26.5.1421. [DOI] [PubMed] [Google Scholar]
- 63.American Diabetes Association. Economic costs of diabetes in the U.S 2007. Diabetes Care. 2008;31(3):596–615. doi: 10.2337/dc08-9017. [DOI] [PubMed] [Google Scholar]
Associated Data
This section collects any data citations, data availability statements, or supplementary materials included in this article.