

Abstract
The stiffness of a tendon, which influences muscular force transfer to the skeleton and increases during childhood, is dependent on its material properties and dimensions, both of which are influenced by chronic loading. The aims of this study were to: (i) determine the independent contributions of body mass, force production capabilities and tendon dimensions to tendon stiffness during childhood; and (ii) descriptively document age-related changes in tendon mechanical properties and dimensions. Achilles tendon mechanical and material properties were determined in 52 children (5–12 years) and 19 adults. Tendon stiffness and Young's modulus (YM) were calculated as the slopes of the force–elongation and stress-strain curves, respectively. Relationships between stiffness vs. age, mass and force, and between YM vs. age, mass and stress were determined by means of polynomial fits and multiple regression analyses. Mass was found to be the best predictor of stiffness, whilst stress was best related to YM (< 75 and 51% explained variance, respectively). Combined, mass and force accounted for up to 78% of stiffness variation. Up to 61% of YM variability could be explained using a combination of mass, stress and age. These results demonstrate that age-related increases in tendon stiffness are largely attributable to increased tendon loading from weight-bearing tasks and increased plantarflexor force production, as well as tendon growth. Moreover, our results suggest that chronic increases in tendon loading during childhood result in microstructural changes which increase the tendon's YM. Regarding the second aim, peak stress increased from childhood to adulthood due to greater increases in strength than tendon cross-sectional area. Peak strain remained constant as a result of parallel increases in tendon length and peak elongation. The differences in Achilles tendon properties found between adults and children are likely to influence force production, and ultimately movement characteristics, which should be explicitly examined in future research.
Keywords: children, muscle force, stiffness, tendon excursion, Young's modulus
Introduction
Tendons are spring-like structures that play an integral role in movement by transferring muscular forces across joints to bones. Their mechanical properties, and in particular their stiffness, affect force production and complex movement performance (Bojsen-Moller et al. 2005; Arampatzis et al. 2006). Importantly, tendon mechanical properties adapt in response to chronic increases (Kubo et al. 2001a; Wu et al. 2010) or decreases (Reeves et al. 2003; Maganaris et al. 2006) in mechanical loading.
During childhood, the stiffness of weight-bearing tendons has been shown to increase with age from 9 years to adulthood in humans (Kubo et al. 2001b; O'Brien et al. 2010). These findings are consistent with those relating to load-bearing animal tendons (Woo et al. 1982; Shadwick, 1990). Age-related increases in body mass and force production capabilities have been postulated to contribute to these observed increases in tendon stiffness (O'Brien et al. 2010); however, they have not been previously examined as potential underlying mechanisms. Body mass increases substantially from childhood to adulthood (Malina & Bouchard, 1991), requiring the weight-bearing tendons to tolerate higher loads. In addition, muscle mass, which is directly associated with force production capacity, increases considerably during childhood (Fomon et al. 1982; Malina & Bouchard, 1991; Maynard et al. 2001). Whilst increases in muscular strength are partly due to increases in muscle physiological cross-sectional area (Ikai & Fukunaga, 1968; Morse et al. 2008), they are also influenced by improvements in an individual's ability to recruit and coordinate the available muscle mass for force production (Belanger & McComas, 1989; Falk et al. 2009). As a result, strength does not increase in direct proportion with body mass (Asmussen & Heeboll-Nielsen, 1955; Blimkie, 1989) and thus both body mass and force production capacity may contribute independently to age-related increases in chronic loading (Proske & Morgan, 1987). Consequently, tendons should adapt based on their requirement to transmit higher forces from the muscle to the skeletal system safely and effectively.
In addition to a requirement to tolerate greater loads, a tendon's stiffness is also dependent on its dimensions (Proske & Morgan, 1987). Because these dimensions change with age (Jozsa & Kannus, 1997; O'Brien et al. 2010), increases in the tendon's stiffness must also be set in the context of its growth, e.g. by calculating the Young's modulus (YM), which is the tendon's stiffness normalised by its length and cross-sectional area (CSA). Accounting for dimensional differences between individuals provides an insight into the tendon's material properties. For example, previous research has shown that YM increases with age (O'Brien et al. 2010), suggesting that the tendon's intrinsic material properties undergo a maturational process in addition to dimensional growth. In animals, this is caused by a number of processes acting to increase collagen density and continuity in addition to extracellular matrix integrity within the tendon (Elliott, 1965; Parry et al. 1978; Curwin et al. 1988; Bailey et al. 1998; Bayer et al. 2010), initiated by mechanical loading (Kjaer, 2004). Increases in tendon stiffness with age have therefore been attributed to both maturational and dimensional tendon adaptations (O'Brien et al. 2010). Nonetheless, such changes have not been documented in younger children (< 9 years), so the development of tendon properties throughout childhood is not yet known.
Given the above, the first purpose of the present research was to partition out the contributions of age, body mass and muscular strength on prepubertal developmental increases in tendon stiffness of the functionally important Achilles tendon. Within this context, the influence of age, body mass and peak stress on tendon stiffness irrespective of tendon size (i.e. YM) was also examined. This allowed the determination of the relative importance of tendon size and YM on age-related changes in tendon stiffness to be examined. The second purpose of this study was to document the development of the tendon's mechanical properties (including the tendon's dimensions, elongation due to peak force and mechanical stress and strain) in order to better understand the mechanisms underpinning age-related changes in tendon stiffness and YM. Understanding such changes may help to provide an explanation for differences in movement performance (Asai & Aoki, 1996; Chao et al. 2002; Ganley & Powers, 2005; Grosset et al. 2005; Korff & Jensen, 2007; Falk et al. 2009) and movement efficiency (DeJaeger et al. 2001; Schepens et al. 2001, 2004) between children and adults.
Materials and methods
Ethics and participant information
Fifty-three prepubertal children between the ages of 5 and 12 years (27 boys, 26 girls; mean age 8.1 ± 1.7 years), 10 men (27.0 ± 2.0) and nine women (24.8 ± 3.2) volunteered to participate in this study (Table 1). Peak height velocity (PHV), as an indicator of maturational offset (Malina & Bouchard, 1991), was estimated in children over 8 years of age to confirm their prepubertal status (Mirwald et al. 2002). All children were free from neuromuscular or musculoskeletal disorders and were not involved in any competitive sports. The study was approved by the Research Ethics Committee at Brunel University. Testing conformed to the guidelines set out in the Declaration of Helsinki. Children provided written assent to participate in the study and parents/guardians provided written informed consent.
Table 1.
Participant characteristics for groups (mean ± SD). There were no between-sex differences, so data have been pooled for analysis
| Group | n | Age (years)*,** | Height (cm)*,** | Mass (kg)*,**,*** |
|---|---|---|---|---|
| CG5–7 | 21 | 6.4 ± 0.8 | 123.7 ± 6.8 | 22.7 ± 3.7 |
| CG8–10 | 29 | 9.1 ± 0.5 | 137.1 ± 5.4 | 31.2 ± 6.3 |
| Adult men | 10 | 27.0 ± 2.0 | 179.6 ± 6.5 | 78.6 ± 11.7 |
| Adult women | 9 | 24.8 ± 3.2 | 167.6 ± 5.6 | 64.3 ± 7.8 |
CG5–7 and CG8–10 represent children aged 5–7 and 8–10 years, respectively. Significant difference (P < 0.05) between
adults (M and W) and all child age groups
CG5–7 and CG8–10
adult men (M) and women (W).
Familiarisation
The participants visited the laboratory on one occasion, during which a familiarisation of the procedures preceded data collection. Standing and sitting height (for determining PHV) and body mass were measured before familiarisation. Participants performed five to eight sub-maximal isometric plantarflexion contractions, followed by three to five further contractions with maximal effort to ensure their maximum moment was identified. These contractions acted as a task-specific warm-up and tendon pre-conditioning exercise (Rigby et al. 1959; Viidik et al. 1982; Schatzmann et al. 1998; Maganaris & Paul, 1999). A 30-s rest period separated two consecutive contractions. A 5-min passive rest period was imposed between the familiarisation period and the testing protocol to minimise fatigue.
Measurement of plantarflexor moment
The moment about the ankle joint was measured using an isokinetic dynamometer (Biodex Medical Systems, Shirley, NY, USA). Participants were seated on the dynamometer chair with relative internal hip, knee and ankle angles of 95°, 180° and 90°, respectively. The lateral malleolus of the right fibula was aligned with the rotational axis of the dynamometer. Stabilisation straps were applied tightly over the foot, thigh and torso to reduce possible leg, upper body or heel movement. Furthermore, the participants were instructed to cross their arms over their chest.
Despite extensive practice, many of the younger children found it difficult to perform slowly ramped maximal voluntary plantarflexion contractions (MVCs) and produce a uni-modal moment-time profile. A uni-modal moment-time profile was defined here as a moment-time curve where no fall in moment was > 10% of the maximum moment achieved in that trial. Thus children were instructed to produce their MVCs with a maximum rate of moment development. The rate at which children can produce moment/force voluntarily is markedly lower than that of adults (Asai & Aoki, 1996), therefore the resolution of the force-tendon elongation curves created with an ultrasound sampling frequency of 25 Hz proved adequate for reliable data capture. The rate at which adults can produce moment/force voluntarily was too high for reliable data capture, therefore adults performed ramped contractions, generating maximal moment over approximately 3 s. The different instructions given resulted in children reaching their maximum moment in 2.3 ± 0.7 s, whilst adults took 3.0 ± 0.8 s.
For children aged over 8 years and adults, plantarflexor moment was recorded during three 4-s MVCs with verbal encouragement given by the investigator (McNair et al. 1996). For children younger than 8 years, two 4-s MVCs were performed, and a third trial was completed if the peak moment achieved in the first two trials differed by more than 5%. All trials were separated by a 30-s rest period. Plantarflexor moment and ankle joint position were sampled at 1000 Hz using a 12-bit A/D card (NI PCI-6071E; National Instruments, Austin, TX, USA) and low-pass filtered using a fourth-order, zero-lag Butterworth filter with a 14 Hz cut-off frequency.
Measurement of tendon elongation
Tendon elongation was measured as the displacement of the gastrocnemius medialis muscle-tendon junction (GM MTJ) from rest during the MVC trials. The GM MTJ was visualised using B-mode ultrasonography with a 45-mm linear array probe (Megas GPX, Esaote, Italy; 10 MHz transducer scanning). The probe was secured perpendicularly to the skin surface above the GM MTJ once the scanning interface was orientated to clearly display both the separation between the aponeuroses of the GM and soleus muscles and the GM MTJ simultaneously. An echo-absorptive strip placed on the skin above the GM MTJ provided a reference point for identifying probe movement relative to the skin during the trials (see Fig. 1 for a visual representation of the experimental setup relating to ultrasonography of the GM MTJ). Ultrasound images were digitally captured at 25 Hz using a digital video converting frame grabber (ADVC-55; Grass Valley, France). Peak motus digitising software (v9; Vicon, Oxford, UK) was used to identify the GM MTJ manually in each video field. GM MTJ positional data were low-pass filtered using a fourth-order, zero-lag Butterworth filter with a 3.25-Hz cut-off frequency.
Fig. 1.
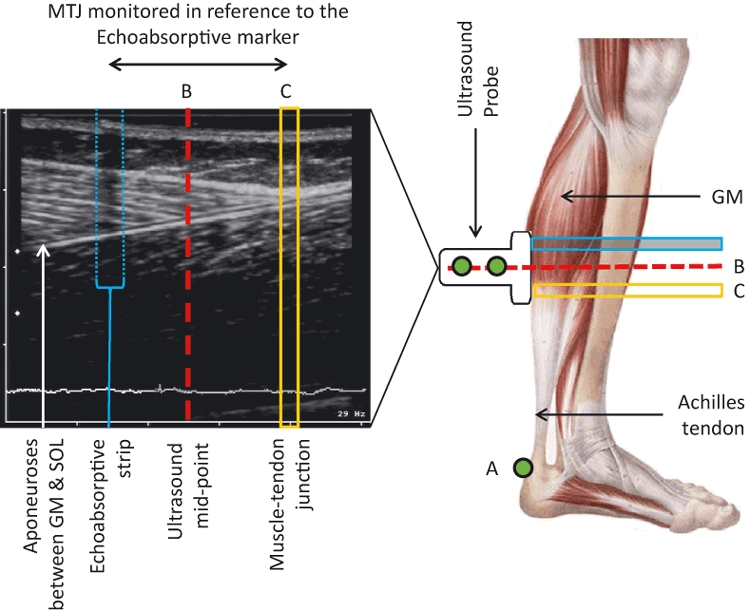
Experimental setup for measuring tendon elongation and tendon resting length. Elongation of the tendon was measured as movement of the muscle-tendon junction (MTJ) in reference to the echoabsorptive marker. The resting tendon length was calculated as the distance between the tendon insertion point on the calcaneal bone (A) and ultrasound mid-point (B), adjusted for the distance of the MTJ (C) from the ultrasound mid-point (Tendon Length = LengthAB + LengthBC). GM, gastrocnemius medialis; SOL, soleus.
Correction for muscle-tendon junction movement due to joint rotation during MVC
Ankle joint rotation during plantarflexion results in movement of the GM MTJ, leading to an underestimation of tendon elongation and an overestimation of tendon stiffness (Magnusson et al. 2001; Arampatzis et al. 2008). GM MTJ displacements due to ankle joint rotation from heel movement were therefore estimated as the product of angular rotation, determined using motion capture, and Achilles tendon moment arm length (Fukunaga et al. 1996; Magnusson et al. 2001; Rosager et al. 2002) and were subtracted from overall GM MTJ displacement.
Moment arm estimation
Achilles tendon moment arm (MAAT) was calculated using the tendon excursion method (An et al. 1984) according to the recommendations of Fath et al. (2010). Briefly, the ankle joint was passively rotated at 10° s−1 through a range of motion while excursion of the GM MTJ was recorded. Ankle displacement data, sampled at 1000 Hz using dynamometry, were low-pass filtered at 14 Hz using a fourth-order zero-lag Butterworth filter and downsampled to 25 Hz to match the ultrasound data. A third-order polynomial was fitted between GM MTJ excursion and ankle displacement over an angular displacement of 20° (from 10° dorsiflexion to 10° plantarflexion). The polynomial was then differentiated at the neutral (0°) ankle position to obtain the MAAT at this ankle position. The mean (± standard deviation) coefficient of determination (R2) for the approximated tendon elongation-angular displacement relationship was 0.993 ± 0.004 across participants.
Electromyographic measurement of muscle activity
Activity of the tibialis anterior (TA) was assumed to represent antagonist co-activation during plantarflexion (Rosager et al. 2002). The TA EMG-moment relation was determined during a ramped dorsiflexion contraction. Using this relationship, the antagonist moment during plantarflexion was estimated and added to the net recorded moment. In children, the EMG electrode placement area was rubbed vigorously (Damiano et al. 2000) with an alcohol-based antiseptic using a disposable pad. In adults, the skin was shaved and lightly abraded prior to rubbing with a disinfectant wipe (Konrad, 2005). Self-adhesive electrodes (Kendall H59P; Covidien plc., Dublin, Ireland) were placed approximately in parallel with the orientation of the underlying fascicles using a bipolar setup with a centre-to-centre inter-electrode distance of 20 mm. A reference electrode was positioned on the tibial plateau. Real-time EMG data sent via telemetric transmission to a remote receiver at 1000 Hz (Telemyo 2400R; NorAxon Inc., Arizona, USA) were captured synchronously with the other analogue data. EMG data were digitally filtered (spike2 v5.12a software; Cambridge Electronic Design, Cambridge, UK) using a 10–500 Hz band pass filter and smoothed using a root-mean-square algorithm with a 100-ms averaging window.
Calculation of tendon properties
Tendon stiffness was calculated using two different approaches. Relative stiffness (stiffnessREL) was calculated as the slope of the line fitted to the force–elongation data between 10 and 90% of peak force for each participant. This force interval was chosen as it provided the most reliable tendon stiffness data across trials in children. Consequently, stiffnessREL may be considered to represent an average tendon stiffness across the force production range relative to each individual. StiffnessREL was calculated as the mean stiffness from the MVC trials adhering to the following criteria: (i) the peak force of a trial was within ± 5% of the maximum recorded value achieved; and (ii) the time curve was uni-modal. In total, 213 trials were recorded, 15 of which (all from children) did not meet the inclusion criteria. These 15 trials were eliminated from further analysis, which resulted in the dataset of one child being completely removed. Thus, data from 52 children only are presented in the results. The mean coefficient of variation (CV) for stiffnessREL was 7.6%, calculated from 20 children across three MVCs adhering to the criteria outlined above. StiffnessREL is important from a functional perspective, as it represents the stiffness that subjects are likely to experience when performing daily activities.
Tendon stiffness was also calculated as the slope of the force–elongation curve over an absolute force range that was common to all participants (stiffnessABS). StiffnessABS was determined as the slope of the line fitted to the force–elongation data between 10 and 90% of peak force of the second weakest participant (corresponding to a force range of 54–484°N). The force range of the weakest child was not used to measure stiffnessABS as the force equating to 10% of their peak force was occasionally exceeded by stronger participants under passive conditions. StiffnessABS was therefore not calculated for the weakest child. StiffnessABS is an important variable, as it allows us to make inferences about the material properties of the tendons between individuals of different strengths.
The calculation of stress, strain and YM required the dimensions of the tendon to be known. The resting length of the Achilles tendon was defined as the linear distance between its insertion on the calcaneal tuberosity and the GM MTJ, measured at a neutral ankle angle under passive conditions (Fig. 1). The distance between the proximal calcaneus and midpoint of the ultrasound scanning interface was obtained from motion analysis. The linear distance between these markers was then adjusted to account for the distance between the middle of the ultrasound image (analogous with the midpoint of the scanning interface) and the GM MTJ to obtain resting tendon length. Peak tendon strain was defined as the relative elongation of the tendon associated with peak tendon force relative to its resting length. For obtaining the smallest tendon CSA, the narrowest section of the tendon was identified by visual inspection and palpation of the tendon. Three discrete, transverse tendon CSA images were then obtained from ultrasonography in conjunction with a silicon ultrasound gel pad (Aquaflex 2 × 9-cm; Parker Labs Inc., Fairfield, NJ, USA). The mean CV calculated across three independent measurements from three individuals was 4.1%. The intra-tester reliability for determining tendon CSA (quantified by analysing 30 images three times) was 3.8%. Stress, determined as the magnitude of force per unit area, was calculated from the smallest recorded CSA and peak attained force from each participant. YM was calculated as the ratio of stress to strain, using the same relative and absolute force levels as described for the calculations of tendon stiffness (YMREL and YMABS, respectively). Similarly to stiffnessABS, YMABS was based on the force values of the second weakest participant. Thus, the weakest participant was excluded from the corresponding analysis.
Statistical analysis
All data were analysed using spss statistical software (v16.0; SPSS Inc., Chicago, IL, USA). A series of regression equations were performed as described below. Dependent variables (DVs) were stiffnessREL, stiffnessABS, YMREL and YMABS. The independent variables (IVs) used to predict tendon stiffness were age, body mass and peak force. The IVs used to predict YM were age, body mass and peak stress. Initially, the strength of pairwise relationships between a DV and the corresponding IVs were quantified by means of polynomial fits and by calculating coefficients of determination (R2) using the method of least squares. The order of the polynomial was determined in a stepwise fashion. Starting with an order of one, the coefficient of determination was ascertained. The order of the polynomial was then increased until the R2 value did not increase by more than 2% if another order was added. All IVs were then included in a stepwise multiple regression analysis (P < 0.05 for inclusion into the model) to determine whether a combination of parameters provided a better prediction of a particular DV for children and all ages combined. For variables that were best represented by a non-linear polynomial, higher order terms of the polynomial of interest from the corresponding IV were included as a separate IV in the regression analysis (e.g. for a 2nd order polynomial, the corresponding IV raised to the power of two was added as a separate IV into the regression model). All DVs were examined for sex differences with respect to age group using a two-way analysis of variance (anova). Statistical significance was accepted at P < 0.05.
Variables relating to tendon stiffness and YM were also documented descriptively according to chronological age. To establish the practical importance of changes in these parameters throughout childhood, children were grouped by ages of 5–7 and 8–10 years (subsequently referred to as CG5–7 and CG8–10, respectively), and the effect sizes (Cohen's d: Cohen, 1988) for each variable were calculated to describe differences between age groups. In addition, an overall effect size was calculated between CG5–7 and adults.
Results
The main effect for sex was not significant for any of the dependent variables (P = 0.170–0.999). Further, the age by sex interactions were not significant (P = 0.113–0.758) and therefore all data for subsequent analyses were pooled. The polynomial equations for the curves fitted to each IV and DV pairing are given in Table 2. A representative force–elongation graph for children and adults is given in Fig. 2. The coefficients of determination (R2) for the relationships between stiffnessREL and age, body mass and peak force in children were 0.37, 0.58 and 0.51, respectively. These values increased to 0.70, 0.75 and 0.76 when adults were included in the analyses (Fig. 3). The coefficients of determination (R2) for the relationship between YMREL and age, body mass and peak stress in children were 0.31, 0.27 and 0.32, respectively, increasing to 0.52, 0.47 and 0.51 for all ages combined (Fig. 4). The relationships found between each IV and stiffnessABS (R2 = 0.15–0.21; Fig. 3) and YMABS (R2 = 0.12–0.26; Fig. 4) were consistently lower than those found for stiffnessREL and YMREL. The multiple regression analyses showed that, together, body mass and peak force significantly predicted stiffnessREL in children (R2 = 0.66). This relationship was further improved when adult data were included in the regression (R2 = 0.78). The inclusion of age as an IV did not improve the predictability of stiffnessREL or stiffnessABS in children (P = 0.799–0.917) or stiffnessREL in all ages (P = 0.298). Furthermore, a combination of body mass and peak stress significantly predicted both YMREL and YMABS in children (adjusted R2 of 0.45 and 0.29, respectively), whilst body mass, peak stress and age were all significant predictors of YMREL and YMABS for all ages combined (R2 = 0.61). The inclusion of multiple independent variables did not improve the predictability of stiffnessABS in children beyond that found for the pairwise polynomial fits. The equations describing the relationships between IVs and DVs of the multiple regression models are given in Table 3.
Table 2.
Polynomial equations describing the relationship between independent variables and tendon stiffness or Young's modulus (YM)
| Dependent variable (Y) | Population | Independent variable (x) | Equation | R2 |
|---|---|---|---|---|
| StiffnessREL | Children | Age | Y = 18.172x − 10.514 | 0.37 |
| Mass | Y = 6.0391x − 30.084 | 0.58 | ||
| Force | Y = 0.0602x + 41.367 | 0.51 | ||
| All ages | Age | Y = −0.4852x2 + 23.681x − 22.739 | 0.70 | |
| Mass | Y = −0.0587x2 + 8.7774x − 59.307 | 0.75 | ||
| Force | Y = −7E − 06x2 + 0.0843x + 23.419 | 0.76 | ||
| StiffnessABS | Children | Age | Y = 10.165x + 45.648 | 0.15 |
| Mass | Y = 3.1554x + 40.987 | 0.21 | ||
| Force | Y = 0.0323x + 77.088 | 0.19 | ||
| All ages | Age | Y = −0.3346x2 + 16.13x + 20.275 | 0.46 | |
| Mass | Y = −0.0246x2 + 4.4102x + 25.927 | 0.48 | ||
| Force | Y = −3E − 07x2 + 0.0306x + 79.44 | 0.53 | ||
| YMREL | Children | Age | Y = 64.303x − 1.553 | 0.31 |
| Mass | Y = 16.021x + 76.986 | 0.27 | ||
| Stress | Y = 8.7919x + 146.96 | 0.32 | ||
| All ages | Age | Y = −2.6421x2 + 107.75x − 172.15 | 0.52 | |
| Mass | Y = −0.1282x2 + 20.33x + 56.477 | 0.47 | ||
| Stress | Y = −0.0492x2 + 13.857x + 41.519 | 0.51 | ||
| YMABS | Children | Age | Y = 46.032x + 127.55 | 0.17 |
| Mass | Y = 10.093 + 222.81 | 0.12 | ||
| Stress | Y = 7.68673x + 175.09 | 0.26 | ||
| All ages | Age | Y = −2.2546x2 + 86.812x − 47.289 | 0.30 | |
| Mass | Y = −0.0513x2 + 9.6423x + 270.95 | 0.23 | ||
| Stress | Y = −0.0542x2 + 12.463x + 82.278 | 0.40 |
Fig. 2.
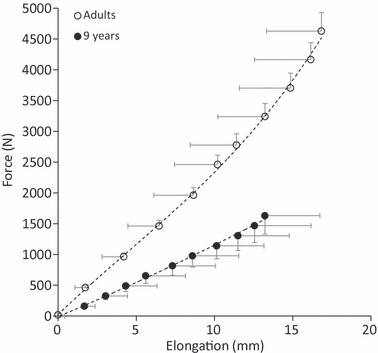
Mean force–elongation curve for five adults and five CG9–10 children. Half error bars, representing the standard deviation of the mean, are included to indicate the ranges of force (vertical) and elongation (horizontal) within an age group.
Fig. 3.
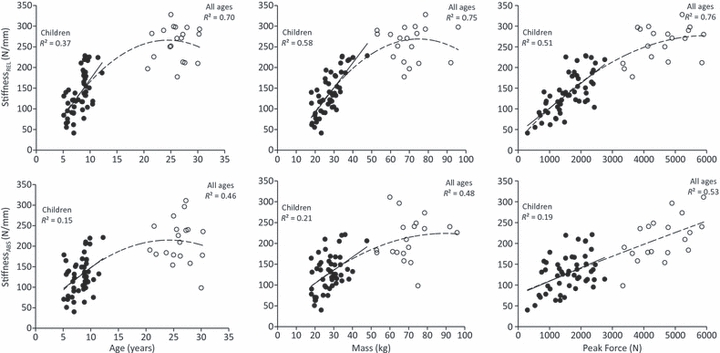
Relationship between absolute and relative tendon stiffness (stiffnessABS and stiffnessREL, respectively) and peak force, body mass and age for children (filled circles) and adults (open circles). Lines of best fit are shown for children (solid line) and all ages combined (dashed line).
Fig. 4.
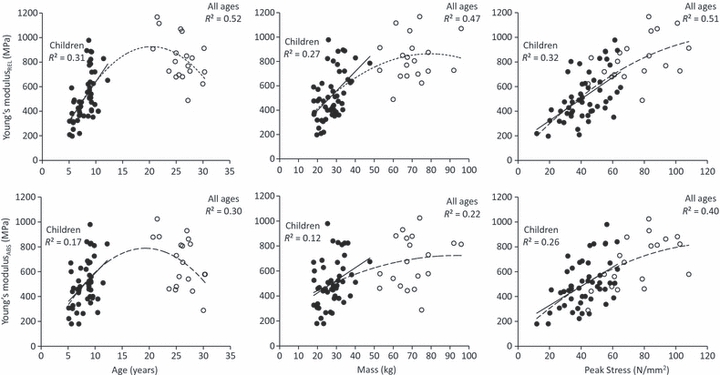
Relationship between Achilles tendon Young's modulus and peak force, body mass and age for children (filled circles) and adults (open circles). Lines of best for are shown for children (solid line) and all ages combined (dashed line).
Table 3.
Regression equation constants for predicting Achilles tendon stiffness from body mass and peak plantarflexor force and Young's modulus (YM) from age, body mass and peak stress in the form of Y = a(mass2) + b(mass) + c(force) + d(stress) + e(age2) + f(age) + Z. Coefficients of determination (adjusted R2) are also shown
| Group | Dependent variable (Y) | Mass2a | Mass b | Force c | Stress d | Age2e | Age f | Constant C | Adj R2 |
|---|---|---|---|---|---|---|---|---|---|
| Children | StiffnessREL | – | 4.141 | 0.032 | – | – | – | −28.375 | 0.66 |
| StiffnessABS | – | 3.164 | – | – | – | – | 41.072 | 0.19 | |
| YMREL | – | 12.462 | – | 7.061 | – | – | −124.507 | 0.45 | |
| YMABS | – | 6.783 | – | 6.538 | – | – | 35.294 | 0.29 | |
| All ages | StiffnessREL | −0.047 | 5.995 | 0.023 | – | – | – | −30.792 | 0.78 |
| StiffnessABS | −0.031 | 0.649 | 0.029 | – | – | −3.343 | 38.433 | 0.55 | |
| YMREL | – | 4.779 | – | 5.027 | −1.760 | 57.313 | −171.819 | 0.61 | |
| YMABS | – | 7.196 | – | 6.319 | −0.559 | – | 69.736 | 0.47 |
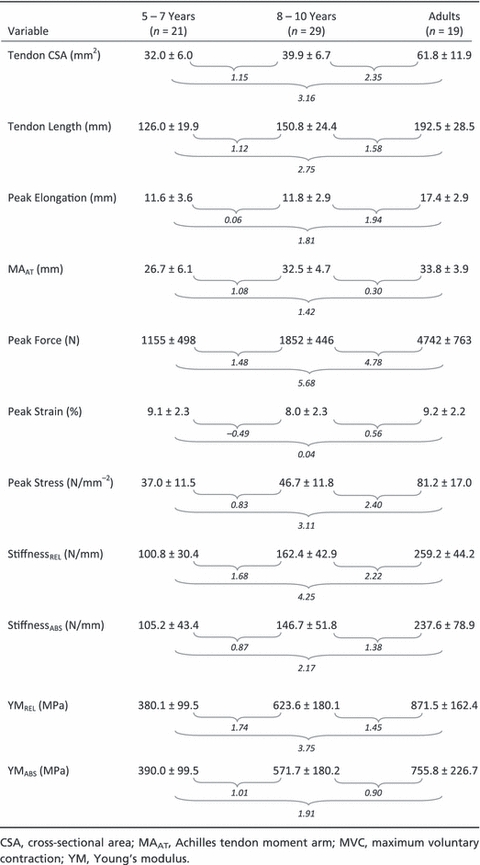
The group means (± standard deviation; SD) for tendon CSA, tendon length, peak stress, strain, elongation and force, moment arm length, tendon stiffness and YM are presented descriptively by age group in Table 4. The effect sizes describing the difference between CG5–7 and CG8–10 were large for all tendon variables with the exception of peak elongation and peak strain. Large positive effect sizes were also observed between CG5–7 and adults for all tendon variables except peak strain, which did not change significantly from childhood to adulthood.
Table 4.
Descriptive characteristics for variables used to calculate Achilles tendon mechanical properties. Effects sizes between groups are given in italics
 |
Discussion
The first purpose of this study was to assess the independent and collective contributions of age, body mass and muscular strength to the development of Achilles tendon stiffness from childhood to adulthood. First we determined the relationship between tendon stiffness and various independent predictors by means of polynomial fits. We found that in children, Achilles tendon stiffness relative to peak force (stiffnessREL) was most related to body mass. Given that the Achilles tendon is a major weight-bearing tendon, and based on the knowledge that mass increases with age during childhood (Malina & Bouchard, 1991), our results suggest that increases in stiffnessREL are associated with a progressive increase in tendon loading during weight-bearing tasks such as walking, running and stair climbing (Ishikawa et al. 2007; Lichtwark et al. 2007; Spanjaard et al. 2008). The strong relationship between body mass and stiffnessREL suggests that age-related increases in stiffnessREL are at least partially a result of growth-related increases in tendon loading and is consistent with previous reports in animals (Pollock & Shadwick, 1994). A moderate relationship was also found between peak force and stiffnessREL in children. Achilles tendon stiffness has previously been shown to correlate with muscular strength in adults (Scott & Loeb, 1995; Muraoka et al. 2005), so an increase in stiffness with age was also hypothesised to reflect increases in muscular force capacity with age. The relationship between tendon stiffness and peak force has been postulated to reflect an injury prevention mechanism whereby excessive tendon elongation caused by an increase in muscular loading prompts adaptation of the tendon to avoid strain and rupture (Scott & Loeb, 1995; Muraoka et al. 2005). In addition to the relationships, the combined influences of age, body mass and peak force were assessed as factors contributing to the development of stiffnessREL by means of a stepwise multiple regression analyses. In children, approximately 58% of the variability in stiffnessREL could be explained by body mass. This increased to 66% when peak force was added to the model, demonstrating the cumulative predictiveness of stiffnessREL from body mass and peak force capacity. It is possible that this increased prediction ability may reflect the neuromuscular aspects of muscular strength improvements with age (Belanger & McComas, 1989; Blimkie, 1989; Falk et al. 2009), as muscular strength increases at a rate that surpasses increases in muscle mass with growth (Asmussen & Heeboll-Nielsen, 1955). Nonetheless, these findings suggest that age-related increases in tendon loading and force production have an additive effect on increases in tendon stiffness during childhood.
To establish whether age-related increases in body mass and strength contribute to changes in the material properties of the tendon, tendon stiffness was also calculated over a common force range (stiffnessABS). Moderate relationships were identified between stiffnessABS and all dependent variables studied. However, in contrast to the multiple regression analysis relating to stiffnessREL, the predictability of stiffnessABS did not improve by including multiple dependent variables in the model. Here, body mass was found to be the sole predictor of this measure (adjusted R2 = 0.19). This finding suggests that growth-related increases in tendon loading lead to adaptations in the mechanical properties of the tendon, such that an increase in tendon loading results in an increase in tendon stiffness. The finding that the relationship between peak force and stiffnessABS was weaker than that between peak force and stiffnessREL was somewhat expected, due to the fact that the forces used in calculating stiffnessABS were at the lower end of most participants’ force–elongation relationship in relation to their maximum force. For example, in the present study, 10–90% of the force achieved by the second weakest individual corresponded with 0.9–8.2% of the maximum force attained by the strongest individual. Such differences meant that stiffness calculated from the weaker individual corresponded with the steeper, linear aspect of the force–elongation curve, whereas the shallower toe region would be used in calculating stiffness of the stronger individual. In none of the regression analyses did the inclusion of age improve the predictability of tendon stiffness. We can conclude from this that the increases in stiffness found with age can be largely explained by the age-related increases in body mass and force production capabilities that cause an increase in tendon loading. This finding suggests that age-related tendon stiffness increases should be considered relative to body mass and/or force production capacity rather than to age per se.
In addition to the relationships examined above, the independent and combined influences of age, body mass and peak stress were assessed as factors contributing to the development of Achilles tendon Young's modulus (YM). YM represents a dimensionless measure of tendon stiffness and therefore allows us to make inferences about the tendon's material properties, independent of tendon growth. However, the development of YM was also differentiated between YM relative to each participant's peak strength (YMREL) and over an absolute force range (YMABS) in order to partition out the influence of peak strength on peak stress, used in determining YM. Peak stress was the best predictor of both YMREL and YMABS. These results let us speculate that increases in mechanical tendon loading lead to adaptations in the intrinsic material properties of the tendon during childhood, independent of tendon growth. Changes in mechanical loading impact on the material properties of the tendon by stimulating structural and biochemical changes which improve the tendon's tensile strength without changing tendon dimensions (Elliott, 1965; Curwin et al. 1988; Michna & Hartmann, 1989; Kjaer, 2004; Bayer et al. 2010). Such changes include increases in fibril diameter and density (Bailey & Robins, 1976; Parry & Craig, 1978; Parry et al. 1978; Bailey et al. 1998) in addition to greater intrafibrillar cross-linking (Parry et al. 1978; Svendsen & Thomson, 1984). In a developmental context, the greater muscular forces that are required to propel and control segments of increasing mass (Jensen & Bothner, 1998) cause a greater chronic mechanical loading to be experienced during activities such as locomotion. Our results lead us to speculate that these mechanisms are partially responsible for the observed developmental changes in tendon stiffness during childhood.
The second purpose of this study was to document the mechanical behaviour of the tendons and the parameters used in determining them, in order to gain an insight into their development during childhood. This information also allowed us to differentiate between the effects of maturation and dimensional growth on changes in Achilles tendon stiffness with age. Assuming a uniform growth of the tendon, one would expect tendon CSA to increase by the square of the factor at which tendon length increases. However, in our subjects, tendon length and CSA increased by approximately 53 and 93%, respectively, between the youngest children (CG5–7) and adults, suggesting that, in relative terms, tendon length increases at a faster rate than its cross-sectional area during growth. To put this into context, the tendon growth rates found here would have resulted in an approximately 20% reduction in tendon stiffness (assuming a constant YM). Nevertheless, both YMREL and YMABS were found to increase (approximately 129 and 94%, respectively) with age. Together, these results substantiate our speculation that the non-dimensional aspects play a major role in governing age-related increases in tendon stiffness during childhood. Based on the significant relationships between YM and peak stress, increased loading resulting from increases in body mass and peak force capacity appears to be a potent stimulus for improving the structural integrity of tendon material during childhood. From these results it can be concluded that both maturational and dimensional adaptations underpin age-related increases in Achilles tendon stiffness. These changes are likely to be driven by increases in body mass and force production rather than being an age-related adaptation per se.
Peak elongation of the tendon during an MVC was found to increase in proportion to resting tendon length, resulting in a consistent peak strain across all age groups. This result contrasts the findings of Kubo et al. (2001b), who found peak elongation to be similar between boys and men in the vastus lateralis tendon (although they did not report tendon strain values). This discrepancy can potentially be attributed to differences in the properties or growth rates of the Achilles compared with the quadriceps tendon. However, an important functional consequence of the greater maximum tendon elongation and stiffness (stiffnessREL) found in adults could be an age-related increase in the capacity for energy absorption, which in turn may improve movement efficiency with age (DeJaeger et al. 2001; Schepens et al. 2001, 2004). To illustrate this, we used the data presented in Table 4 and calculated the potential energy storage capacity of the tendon for CG5–7 and adults from the equation E = ½kx2, where E is the energy stored, k is stiffness and x is the tendon elongation (Blazevich et al. 2011). Based on these calculations, our results imply that peak energy absorption would be greater in adults than in children even when normalised to peak force (∼5.2 J kN−1 in the CG5–7 vs. ∼8.1 J kN−1 in adults), substantiating our speculation that the observed age-related increases in tendon stiffness could contribute to an increased capacity for efficient movement.
Given that peak strain was consistent across age groups, one could speculate that the risk of strain-related injuries would also remain constant with increasing age. However, the prevalence of such injuries is much higher in adults than in children (Houshian et al. 1998). This could be explained by the finding that increases in peak stress with age to adulthood are a result of strength gains exceeding those of tendon hypertrophy (∼310 vs. ∼93%). On the other hand, it has been shown that ultimate tensile strength (i.e. the point at which a material will fail) is lower in young tendons (Elliott, 1965) as a result of a lower YM (Almeida-Silveira et al. 2000). Indeed, O'Brien et al. (2010) argue that children's load-bearing tendons may operate with little safety margin with respect to tendon injury. The lower prevalence in tendon injuries in children might therefore be a result of less exposure to exercise-related microdamage accumulation over time, which has been linked with tendon rupture (Kannus & Jozsa, 1991; Patterson-Kane et al. 1997; Smith et al. 1999; Young et al. 2009). Further research is required to test this hypothesis specifically.
The ranges of the Achilles tendon stiffnessREL found in the present study were slightly smaller than those previously reported for adults (Magnusson et al. 2001; Rosager et al. 2002; Muraoka et al. 2004). This is most likely due to the different peak force ranges used to determine stiffness between studies (e.g. 10–90% MVC in the present study vs. 90–100% used by Magnusson et al. 2001 and Rosager et al. 2002). We used this wider force range to maximise inter-test reliability in our data. The use of a wider range of forces in the present study implies that the more compliant, early region of the curvilinear force–elongation curve is included in the stiffness calculation (Baratta & Solomonow, 1991), which would result in a lower stiffness value. A separate factor that could have contributed to the differences observed in stiffness in the present study, compared with previous studies, is that different instructions were given to children and adults for plantarflexion performance, resulting in different muscle contraction velocities and hence different tendon-loading rates used in determining the force–elongation relationship. Tendons display viscoelastic properties, i.e. their stiffness increases with the rate of loading. For example, Pearson et al. (2007) found that patellar tendon stiffness was 77% greater when peak force was developed over 3 s as opposed to 10 s, a finding that was recently replicated for the Achilles tendon by Theis et al. (2011). To address the potential impact of these differences, we performed an additional analysis, in which each participant's stiffnessREL and YMREL were adjusted, depending on the difference between their time to peak force and the mean time to peak force for adults. Based on the results of Pearson et al. (2007) and Theis et al. (2011), a 10% increase in tendon stiffness with every 1 s decrease in time to peak force was assumed. As children, on average, reached their peak force faster than adults (2.3 vs. 3.0 s), stiffnessREL and YMREL typically decreased after these adjustments were made, further increasing the difference between children and adults. With these rate-adjusted stiffnessREL and YMREL values, the same analyses were performed as for the unadjusted stiffnessREL and YMREL values in order to determine whether a potential tendon stiffness over- or under-estimation (based on different plantarflexion instructions) would have influenced the outcomes of our regression analyses. The R2 values for each of these multiple regression analyses were similar to those found for stiffnessREL and YMREL [polynomial fits (R2) did not differ by more than 0.07]. We therefore conclude that the different instructions given to adults and children did not significantly impact on the findings presented in the results.
No sex differences were found in any of the age groups for any of the dependent variables. This finding is in contrast to previous studies, which have reported differences in tendon dimensions and mechanical properties in the weight-bearing tendons of adults (e.g. Achilles: Kubo et al. 2003; Patellar: Onambele et al. 2007). It is possible that these differences could be partially explained by sex differences in body mass and maximum strength. The lack of sex differences found within the child and adult groups in the current study is likely due to the closer matching of body mass and maximum strength in the subject cohort compared with these previous studies.
Conclusion
Our findings add substantially to our understanding of tendon development by documenting changes in the mechanical properties of the Achilles tendon as a function of age in prepubertal children as young as 5 years. Achilles tendon stiffness increased consistently throughout childhood as a result of tendon growth and changes in material properties (i.e. increases in Young's modulus). Body mass and peak force production were found to be the primary factors underpinning both the dimensional and maturational aspects of tendon stiffness, rather than age per se. Thus, tendon stiffness should be conveyed in the context of body mass and peak force capacity. The peak stress experienced by the tendon increased from childhood to adulthood due to greater increases in muscular strength relative to increases in CSA, whilst peak strain remained constant as a result of parallel increases in tendon length and peak elongation. This meant that YM also increased as a function of age-related growth, which was found to be underpinned by both body mass and peak stress increases. Tendon stiffness has been identified as a key factor influencing muscular force production and transmission characteristics in adults and thus has the potential similarly to influence force production characteristics in children. Due to the potential significance of tendon stiffness for characteristics of force production, determining the impact of changing tendon properties on movement performance in children is an important area for future research.
Acknowledgments
This work was supported by the Engineering and Physical Sciences Research Council (EP/ E013007/1).
References
- Almeida-Silveira MI, Lambertz D, Perot C, et al. Changes in stiffness induced by hindlimb suspension in rat Achilles tendon. Eur J Appl Physiol. 2000;81:252–257. doi: 10.1007/s004210050039. [DOI] [PubMed] [Google Scholar]
- An KN, Takahashi K, Harrigan TP, et al. Determination of muscle orientations and moment arms. J Biomech Eng. 1984;106:280–282. doi: 10.1115/1.3138494. [DOI] [PubMed] [Google Scholar]
- Arampatzis A, De Monte G, Karamanidis K, et al. Influence of the muscle-tendon unit's mechanical and morphological properties on running economy. J Exp Biol. 2006;209:3345–3357. doi: 10.1242/jeb.02340. [DOI] [PubMed] [Google Scholar]
- Arampatzis A, Monte GD, Karamanidis K. Effect of joint rotation correction when measuring elongation of the gastrocnemius medialis tendon and aponeurosis. J Electromyogr Kinesiol. 2008;18:503–508. doi: 10.1016/j.jelekin.2006.12.002. [DOI] [PubMed] [Google Scholar]
- Asai H, Aoki J. Force development of dynamic and static contractions in children and adults. Int J Sports Med. 1996;17:170–174. doi: 10.1055/s-2007-972827. [DOI] [PubMed] [Google Scholar]
- Asmussen E, Heeboll-Nielsen K. A dimensional analysis of physical performance and growth in boys. J Appl Physiol. 1955;7:593–603. doi: 10.1152/jappl.1955.7.6.593. [DOI] [PubMed] [Google Scholar]
- Bailey AJ, Robins SP. Current topics in the biosynthesis, structure and function of collagen. Sci Prog. 1976;63:419–444. [PubMed] [Google Scholar]
- Bailey AJ, Paul RG, Knott L. Mechanisms of maturation and ageing of collagen. Mech Ageing Dev. 1998;106:1–56. doi: 10.1016/s0047-6374(98)00119-5. [DOI] [PubMed] [Google Scholar]
- Baratta R, Solomonow M. The effect of tendon viscoelastic stiffness on the dynamic performance of isometric muscle. J Biomech. 1991;24:109–116. doi: 10.1016/0021-9290(91)90355-q. [DOI] [PubMed] [Google Scholar]
- Bayer ML, Yeung CY, Kadler KE, et al. The initiation of embryonic-like collagen fibrillogenesis by adult human tendon fibroblasts when cultured under tension. Biomaterials. 2010;31:4889–4897. doi: 10.1016/j.biomaterials.2010.02.062. [DOI] [PMC free article] [PubMed] [Google Scholar]
- Belanger AY, McComas AJ. Contractile properties of human skeletal muscle in childhood and adolescence. Eur J Appl Physiol Occup Physiol. 1989;58:563–567. doi: 10.1007/BF00418500. [DOI] [PubMed] [Google Scholar]
- Blazevich AJ, Waugh CM, Korff T. Development of musculo-skeletal stiffness. In: De Ste Croix MBA, Korff T, editors. Paediatric Biomechanics and Motor Control: Theory and Application. Oxford: Routledge; 2011. [Google Scholar]
- Blimkie CJR, editor. Age- and Sex-Associated Variation in Strength during Childhood: Anthropometric, Morphologic, Neurologic, Biomechanical, Endocrinologic, Genetic and Physical Activity Correlates. Indianapolis: Benchmark Press; 1989. [Google Scholar]
- Bojsen-Moller J, Magnusson SP, Rasmussen LR, et al. Muscle performance during maximal isometric and dynamic contractions is influenced by the stiffness of the tendinous structures. J Appl Physiol. 2005;99:986–994. doi: 10.1152/japplphysiol.01305.2004. [DOI] [PubMed] [Google Scholar]
- Chao P, Rabago C, Korff T, et al. Muscle activation adaptations in children in response to changes in cycling cadence [Abstract] J Sport Exerc Psychol. 2002;24(Suppl):S42–S43. [Google Scholar]
- Cohen J. Statistical Power Analysis for the Behavioral Sciences. Mahwah, NJ: Lawrence Erlbaum Associates, Inc; 1988. [Google Scholar]
- Curwin SL, Vailas AC, Wood J. Immature tendon adaptation to strenuous exercise. J Appl Physiol. 1988;65:2297–2301. doi: 10.1152/jappl.1988.65.5.2297. [DOI] [PubMed] [Google Scholar]
- Damiano DL, Martellotta TL, Sullivan DJ, et al. Muscle force production and functional performance in spastic cerebral palsy: relationship of cocontraction. Arch Phys Med Rehabil. 2000;81:895–900. doi: 10.1053/apmr.2000.5579. [DOI] [PubMed] [Google Scholar]
- DeJaeger D, Willems PA, Heglund NC. The energy cost of walking in children. Pflugers Arch. 2001;441:538–543. doi: 10.1007/s004240000443. [DOI] [PubMed] [Google Scholar]
- Elliott DH. Structure and function of mammalian tendon. Biol Rev Camb Philos Soc. 1965;40:392–421. doi: 10.1111/j.1469-185x.1965.tb00808.x. [DOI] [PubMed] [Google Scholar]
- Falk B, Usselman C, Dotan R, et al. Child-adult differences in muscle strength and activation pattern during isometric elbow flexion and extension. Appl Physiol Nutr Metab. 2009;34:609–615. doi: 10.1139/H09-020. [DOI] [PMC free article] [PubMed] [Google Scholar]
- Fath F, Blazevich AJ, Waugh CM, et al. Direct comparison of in vivo Achilles tendon moment arms obtained from ultrasound and MR scans. J Appl Physiol. 2010;109:1644–1652. doi: 10.1152/japplphysiol.00656.2010. [DOI] [PubMed] [Google Scholar]
- Fomon SJ, Haschke F, Ziegler EE, et al. Body composition of reference children from birth to age 10 years. Am J Clin Nutr. 1982;35:1169–1175. doi: 10.1093/ajcn/35.5.1169. [DOI] [PubMed] [Google Scholar]
- Fukunaga T, Ito M, Ichinose Y, et al. Tendinous movement of a human muscle during voluntary contractions determined by real-time ultrasonography. J Appl Physiol. 1996;81:1430–1433. doi: 10.1152/jappl.1996.81.3.1430. [DOI] [PubMed] [Google Scholar]
- Ganley KJ, Powers CM. Gait kinematics and kinetics of 7-year-old children: a comparison to adults using age-specific anthropometric data. Gait Posture. 2005;21:141–145. doi: 10.1016/j.gaitpost.2004.01.007. [DOI] [PubMed] [Google Scholar]
- Grosset JF, Mora I, Lambertz D, et al. Age-related changes in twitch properties of plantar flexor muscles in prepubertal children. Pediatr Res. 2005;58:966–970. doi: 10.1203/01.PDR.0000181375.61935.7D. [DOI] [PubMed] [Google Scholar]
- Houshian S, Tscherning T, Riegels-Nielsen P. The epidemiology of Achilles tendon rupture in a Danish county. Injury. 1998;29:651–654. doi: 10.1016/s0020-1383(98)00147-8. [DOI] [PubMed] [Google Scholar]
- Ikai M, Fukunaga T. Calculation of muscle strength per unit cross-sectional area of human muscle by means of ultrasonic measurement. Int Z Angew Physiol. 1968;26:26–32. doi: 10.1007/BF00696087. [DOI] [PubMed] [Google Scholar]
- Ishikawa M, Pakaslahti J, Komi PV. Medial gastrocnemius muscle behavior during human running and walking. Gait Posture. 2007;25:380–384. doi: 10.1016/j.gaitpost.2006.05.002. [DOI] [PubMed] [Google Scholar]
- Bothner KE. In: Infant Motor Development: The Biomechanics of Change. Jensen JL, editor; Champaign, IL: Human Kinetics; 1998. [Google Scholar]
- Jozsa L, Kannus P. Histopathological findings in spontaneous tendon ruptures. Scand J Med Sci Sports. 1997;7:113–118. doi: 10.1111/j.1600-0838.1997.tb00127.x. [DOI] [PubMed] [Google Scholar]
- Kannus P, Jozsa L. Histopathological changes preceding spontaneous rupture of a tendon. A controlled study of 891 patients. J Bone Joint Surg Am. 1991;73:1507–1525. [PubMed] [Google Scholar]
- Kjaer M. Role of extracellular matrix in adaptation of tendon and skeletal muscle to mechanical loading. Physiol Rev. 2004;84:649–698. doi: 10.1152/physrev.00031.2003. [DOI] [PubMed] [Google Scholar]
- Konrad P. The ABC of EMG: A Practical Introduction to Kinesiological Electromyography. USA: Noraxon, Inc; 2005. [Google Scholar]
- Korff T, Jensen JL. Age-related differences in adaptation during childhood: the influences of muscular power production and segmental energy flow caused by muscles. Exp Brain Res. 2007;177:291–303. doi: 10.1007/s00221-006-0684-3. [DOI] [PubMed] [Google Scholar]
- Kubo K, Kanehisa H, Ito M, et al. Effects of isometric training on the elasticity of human tendon structures in vivo. J Appl Physiol. 2001a;91:26–32. doi: 10.1152/jappl.2001.91.1.26. [DOI] [PubMed] [Google Scholar]
- Kubo K, Kanehisa H, Kawakami Y, et al. Growth changes in the elastic properties of human tendon structures. Int J Sports Med. 2001b;22:138–143. doi: 10.1055/s-2001-11337. [DOI] [PubMed] [Google Scholar]
- Kubo K, Kanehisa H, Fukunaga T. Gender differences in the viscoelastic properties of tendon structures. Eur J Appl Physiol. 2003;88:520–526. doi: 10.1007/s00421-002-0744-8. [DOI] [PubMed] [Google Scholar]
- Lichtwark GA, Bougoulias K, Wilson AM. Muscle fascicle and series elastic element length changes along the length of the human gastrocnemius during walking and running. J Biomech. 2007;40:157–164. doi: 10.1016/j.jbiomech.2005.10.035. [DOI] [PubMed] [Google Scholar]
- Maganaris CN, Paul JP. In vivo human tendon mechanical properties. J Physiol. 1999;521(Pt 1):307–313. doi: 10.1111/j.1469-7793.1999.00307.x. [DOI] [PMC free article] [PubMed] [Google Scholar]
- Maganaris CN, Reeves ND, Rittweger J, et al. Adaptive response of human tendon to paralysis. Muscle Nerve. 2006;33:85–92. doi: 10.1002/mus.20441. [DOI] [PubMed] [Google Scholar]
- Magnusson SP, Aagaard P, Dyhre-Poulsen P, et al. Load-displacement properties of the human triceps surae aponeurosis in vivo. J Physiol. 2001;531:277–288. doi: 10.1111/j.1469-7793.2001.0277j.x. [DOI] [PMC free article] [PubMed] [Google Scholar]
- Malina RM, Bouchard C. Growth, Maturation, and Physical Activity. Champaign, IL: Human Kinetics; 1991. [Google Scholar]
- Maynard LM, Wisemandle W, Roche AF, et al. Childhood body composition in relation to body mass index. Pediatrics. 2001;107:344–350. doi: 10.1542/peds.107.2.344. [DOI] [PubMed] [Google Scholar]
- McNair PJ, Depledge J, Brettkelly M, et al. Verbal encouragement: effects on maximum effort voluntary muscle action. Br J Sports Med. 1996;30:243–245. doi: 10.1136/bjsm.30.3.243. [DOI] [PMC free article] [PubMed] [Google Scholar]
- Michna H, Hartmann G. Adaptation of tendon collagen to exercise. Int Orthop. 1989;13:161–165. doi: 10.1007/BF00268040. [DOI] [PubMed] [Google Scholar]
- Mirwald RL, Baxter-Jones AD, Bailey DA, et al. An assessment of maturity from anthropometric measurements. Med Sci Sports Exerc. 2002;34:689–694. doi: 10.1097/00005768-200204000-00020. [DOI] [PubMed] [Google Scholar]
- Morse CI, Tolfrey K, Thom JM, et al. Gastrocnemius muscle specific force in boys and men. J Appl Physiol. 2008;104:469–474. doi: 10.1152/japplphysiol.00697.2007. [DOI] [PubMed] [Google Scholar]
- Muraoka T, Muramatsu T, Fukunaga T, et al. Geometric and elastic properties of in vivo human Achilles tendon in young adults. Cells Tissues Organs. 2004;178:197–203. doi: 10.1159/000083731. [DOI] [PubMed] [Google Scholar]
- Muraoka T, Muramatsu T, Fukunaga T, et al. Elastic properties of human Achilles tendon are correlated to muscle strength. J Appl Physiol. 2005;99:665–669. doi: 10.1152/japplphysiol.00624.2004. [DOI] [PubMed] [Google Scholar]
- O'Brien TD, Reeves ND, Baltzopoulos V, et al. Mechanical properties of the patellar tendon in adults and children. J Biomech. 2010;43:1190–1195. doi: 10.1016/j.jbiomech.2009.11.028. [DOI] [PubMed] [Google Scholar]
- Onambele GN, Burgess K, Pearson SJ. Gender-specific in vivo measurement of the structural and mechanical properties of the human patellar tendon. J Orthop Res. 2007;25:1635–1642. doi: 10.1002/jor.20404. [DOI] [PubMed] [Google Scholar]
- Parry DA, Craig AS. Collagen fibrils and elastic fibers in rat-tail tendon: an electron microscopic investigation. Biopolymers. 1978;17:843–845. doi: 10.1002/bip.1978.360170404. [DOI] [PubMed] [Google Scholar]
- Parry DA, Barnes GR, Craig AS. A comparison of the size distribution of collagen fibrils in connective tissues as a function of age and a possible relation between fibril size distribution and mechanical properties. Proc R Soc Lond B Biol Sci. 1978;203:305–321. doi: 10.1098/rspb.1978.0107. [DOI] [PubMed] [Google Scholar]
- Patterson-Kane JC, Wilson AM, Firth EC, et al. Comparison of collagen fibril populations in the superficial digital flexor tendons of exercised and nonexercised thoroughbreds. Equine Vet J. 1997;29:121–125. doi: 10.1111/j.2042-3306.1997.tb01653.x. [DOI] [PubMed] [Google Scholar]
- Pearson SJ, Burgess K, Onambele GN. Creep and the in vivo assessment of human patellar tendon mechanical properties. Clin Biomech (Bristol, Avon) 2007;22:712–717. doi: 10.1016/j.clinbiomech.2007.02.006. [DOI] [PubMed] [Google Scholar]
- Pollock CM, Shadwick RE. Relationship between body mass and biomechanical properties of limb tendons in adult mammals. Am J Physiol. 1994;266:R1016–R1021. doi: 10.1152/ajpregu.1994.266.3.R1016. [DOI] [PubMed] [Google Scholar]
- Proske U, Morgan DL. Tendon stiffness: methods of measurement and significance for the control of movement. A review. J Biomech. 1987;20:75–82. doi: 10.1016/0021-9290(87)90269-7. [DOI] [PubMed] [Google Scholar]
- Reeves ND, Maganaris CN, Narici MV. Effect of strength training on human patella tendon mechanical properties of older individuals. J Physiol. 2003;548:971–981. doi: 10.1113/jphysiol.2002.035576. [DOI] [PMC free article] [PubMed] [Google Scholar]
- Rigby BJ, Hirai N, Spikes JD, et al. The mechanical properties of rat tail tendon. J Gen Physiol. 1959;43:265–283. doi: 10.1085/jgp.43.2.265. [DOI] [PMC free article] [PubMed] [Google Scholar]
- Rosager S, Aagaard P, Dyhre-Poulsen P, et al. Load-displacement properties of the human triceps surae aponeurosis and tendon in runners and non-runners. Scand J Med Sci Sports. 2002;12:90–98. doi: 10.1034/j.1600-0838.2002.120205.x. [DOI] [PubMed] [Google Scholar]
- Schatzmann L, Brunner P, Staubli HU. Effect of cyclic preconditioning on the tensile properties of human quadriceps tendons and patellar ligaments. Knee Surg Sports Traumatol Arthrosc. 1998;6(Suppl 1):S56–S61. doi: 10.1007/s001670050224. [DOI] [PubMed] [Google Scholar]
- Schepens B, Willems PA, Cavagna GA, et al. Mechanical power and efficiency in running children. Pflugers Arch. 2001;442:107–116. doi: 10.1007/s004240000511. [DOI] [PubMed] [Google Scholar]
- Schepens B, Bastien GJ, Heglund NC, et al. Mechanical work and muscular efficiency in walking children. J Exp Biol. 2004;207:587–596. doi: 10.1242/jeb.00793. [DOI] [PubMed] [Google Scholar]
- Scott SH, Loeb GE. Mechanical properties of aponeurosis and tendon of the cat soleus muscle during whole-muscle isometric contractions. J Morphol. 1995;224:73–86. doi: 10.1002/jmor.1052240109. [DOI] [PubMed] [Google Scholar]
- Shadwick RE. Elastic energy storage in tendons: mechanical differences related to function and age. J Appl Physiol. 1990;68:1033–1040. doi: 10.1152/jappl.1990.68.3.1033. [DOI] [PubMed] [Google Scholar]
- Smith RK, Birch H, Patterson-Kane J, et al. Should equine athletes commence training during skeletal development?: changes in tendon matrix associated with development, ageing, function and exercise. Equine Vet J Suppl. 1999;30:201–209. doi: 10.1111/j.2042-3306.1999.tb05218.x. [DOI] [PubMed] [Google Scholar]
- Spanjaard M, Reeves ND, van Dieen JH, et al. Influence of step-height and body mass on gastrocnemius muscle fascicle behavior during stair ascent. J Biomech. 2008;41:937–944. doi: 10.1016/j.jbiomech.2008.01.003. [DOI] [PubMed] [Google Scholar]
- Svendsen KH, Thomson G. A new clamping and stretching procedure for determination of collagen fiber stiffness and strength relations upon maturation. J Biomech. 1984;17:225–229. doi: 10.1016/0021-9290(84)90013-7. [DOI] [PubMed] [Google Scholar]
- Theis N, Mohagheghi AA, Korff T. 2011. A comparison of tendon stiffness measured under active and passive conditions. 16th Annual European Congress of Sports Sciences, Liverpool, UK [Abstract] pg556.
- Viidik A, Danielson CC, Oxlund H. On fundamental and phenomenological models, structure and mechanical properties of collagen, elastin and glycosaminoglycan complexes. Biorheology. 1982;19:437–451. doi: 10.3233/bir-1982-19305. [DOI] [PubMed] [Google Scholar]
- Woo SL, Gomez MA, Woo YK, et al. Mechanical properties of tendons and ligaments. II. The relationships of immobilization and exercise on tissue remodeling. Biorheology. 1982;19:397–408. doi: 10.3233/bir-1982-19302. [DOI] [PubMed] [Google Scholar]
- Wu YK, Lien YH, Lin KH, et al. Relationships between three potentiation effects of plyometric training and performance. Scand J Med Sci Sports. 2010;20:e80–e86. doi: 10.1111/j.1600-0838.2009.00908.x. [DOI] [PubMed] [Google Scholar]
- Young NJ, Becker DL, Fleck RA, et al. Maturational alterations in gap junction expression and associated collagen synthesis in response to tendon function. Matrix Biol. 2009;28:311–323. doi: 10.1016/j.matbio.2009.05.002. [DOI] [PubMed] [Google Scholar]