

Abstract
As the role of the environment – diet, exercise, alcohol and tobacco use and sleep among others – is accorded a more prominent role in modifying the relationship between genetic variants and clinical measures of disease, consideration of gene-environment (GxE) interactions is a must. To facilitate incorporation of GxE interactions into single-gene and genome-wide association studies, we have compiled from the literature a database of GxE interactions relevant to nutrition, blood lipids, cardiovascular disease and type 2 diabetes. Over 550 such interactions have been incorporated into a single database, along with over 1430 instances where a lack of statistical significance was found. This database will serve as an important resource to researchers in genetics and nutrition in order to gain an understanding of which points in the human genome are sensitive to variations in diet, physical activity and alcohol use, among other lifestyle choices. Furthermore, this GxE database has been designed with future integration into a larger database of nutritional phenotypes in mind.
Keywords: Gene-environment interaction, Cardiovascular disease, Diet, Genetic variation, Physical activity, Alcohol
Introduction
Human genome sequence data and affiliated databases are growing in size at tremendous rates [1]. This treasury of sequence information has greatly enhanced the discovery of genetic variation [2] and vastly amplified the ability to relate a particular genetic variant to a disease phenotype [3]. Although the number of genetic association tests, whether by single gene or genome-wide, performed in the last few years has exploded, especially since 2007, a significant limitation in those studies can be summarized as only a small portion of genetic heritability has been described [4].
In many cases onset of diseases such as cardiovascular disease, coronary artery disease, hypertension and type 2 diabetes can be prevented or greatly delayed with adjustments to lifestyle. In addition, once such a metabolic disease or other disease with a metabolic basis has been diagnosed, clinical biomarkers of disease status can often be ameliorated also with adjustments to lifestyle. Such lifestyle factors include diet, physical activity, alcohol and tobacco use, sleep, latitude and altitude of residence (seasonality and oxygen tension, respectively), as well as many others. Numerous genes involved in homeostasis of these disease biomarkers have alleles that either associate with the biomarker at baseline or have alleles showing gene-environment (GxE) interactions [5,6]. A GxE interaction is exemplified by a point of sequence variation in the genome where one version or allele associates with an adverse health risk only when an environmental factor passes a given threshold. There are two implications of this phenomenon. One, a risk allele actually may not be risk in all individuals. Two, a test of genetic association undertaken in the absence of information on diet, exercise and other lifestyle choices is or can be rather incomplete. Thus, cataloging GxE interactions will provide the basis of which lifestyle factors an individual could adopt and to what degree prior to taking a pharmaceutical therapeutic, which itself may have harmful side effects [7].
Currently, there is much discussion, even that bordering on outright debate, on where the missing heritability is to be found [4,8-10]. Possibilities offered include: a sample size too small to detect variants of small effects, the disease marker is not in complete linkage disequilibrium with the causal variant and thus underestimates heritability [11], overestimation of heritability based on family-based populations, rare or even “private” mutations, inherited patterns of epigenetic marks [12], epistasis [13], gene-gene interactions [14] and gene-environment interactions [5,6]. It is indeed evident that the environment affects the human genome. For example, the emergence of the hemoglobin S variant coincided with resistance to malaria as has lactose tolerance with dairy farming in Europe and Africa. Many other examples are known or hypothesized. Unfortunately, genome-wide association studies (GWAS) have not incorporated GxE interactions for any of a number of reasons. One, appropriate environmental factors have not been collected for many GWAS cohorts, often because of oversight or the costs involved. Two, many measures of environmental exposure are difficult to quantify and standardize, especially across cohorts, and some measures are met with skepticism. Three, thus there is a requirement of GxE interaction studies for much larger sample sizes but effective sample size is reduced because either the environmental factor of interest has not been measured in all GWAS participants or data from multiple studies cannot satisfactorily be merged. Four, there is no strong consensus on how to assess genome-wide significance in the face of multiple GxE tests but the limited amount of heritability explained by genetic association studies strongly supports the need for GxE interaction analysis. Hence, building a database of GxE interactions gives the potential to tease apart the process of how such variants interact with their respective environmental cues and find common threads that, taken together, will help describe the interplay between alleles and environmental factors. We believe that cataloging GxE interactions offers great potential to understand which genes and biological pathways are sensitive to variation in a manner that elicits an altered phenotype, particularly toward greater risk of disease. From another perspective, this database provides a means to corroborate assertions of genetic tests. As personal genomics and personalized medicine and nutrition move into the fore, a full catalog of GxE interactions will be required for appreciating the intricacies of the human genome.
Materials and Methods
Literature mining
In order to identify the publications that present statistically significant interactions between a genetic variant, typically a single nucleotide polymorphism (SNP) and an environmental factor, we searched the scientific literature via PubMed at the National Center for Biotechnology Information with certain keywords. One specific strategy employed a genetic variation keyword (polymorphism, variant or SNP) and either “interaction” or an environmental factor keyword (diet, exercise, alcohol, tobacco/cigarette or sleep). Another search strategy used the terms “gene” and “interaction” coupled with a specific environmental factor (e.g., alcohol or exercise). Searches were also conducted for authors based on the results of the above keyword searches. The abstracts of the identified papers were culled to those focusing on metabolic diseases and obesity. The articles were retrieved for close examination of the reported results from which we retained those GxE interactions restricted to statistical interactions in epidemiologic studies. Reports on studies involving children and adolescents were not parsed for GxE data.
Tabularizing the data
Data were manually extracted from a reading of the collected articles. Several data fields were established for the placement of these data: Gene, SNP accession, aliases or common names of the SNPs, risk allele, phenotype, environmental factor, condition of environmental factor, gender (in which the interaction was observed), population, first author, PubMed ID and year of publication. The field “condition of environmental factor” describes the value of the environmental factor above or below which the GxE interaction was observed as passing statistical significance. Although P-values of the published GxE interactions are sensitive to characteristics of a particular study or population and are not listed here, only those GxE interactions described as statistically significant, generally with a P-value ≤ 0.05, were retained from the literature mining.
Due to difficulties in assigning interactions to one variant that is a member of a haplotype that shows an interaction, such haplotype-environment interactions, although very few in number, were selectively not added to this database. The only exception to this is the epsilon haplotype of APOE defined by SNPs rs429358 and rs7412.
Pathway analysis
Significant over-representation of biochemical pathways from KEGG and Reactome as well as gene ontology terms were taken from the output of g:Profiler, http://biit.cs.ut.ee/gprofiler/ [15]. Lists of genes (n > 10) pertaining to a given type of GxE interaction, i.e., either a particular phenotype or environmental factor, served as input to the pathway/ontology tool. g:Profiler was run with default settings.
Results
Building the database
Mining the scientific literature allowed identification of a large number of articles presenting results on gene-environment interactions involving candidate genes from longitudinal, cross-sectional, interventional and clinical studies. Studies examining effects on less than 20 individuals were not included. 554 different gene-environment interactions pertinent to nutrition, metabolic disorders such as type 2 diabetes, cardiovascular disease, obesity and dyslipidemia and reaching statistical significance were collected from literature reports published from 1994, the earliest example, to 2010 (Table 1 provided as supplementary file). These are described by gene, SNP, risk allele (when known), phenotype, environmental interaction factor, population (origin/location, gender) and PubMed ID. In addition, we collected 1439 examples where the test for a GxE interaction failed to reach statistical significance.
When the environmental factor (EF) involved in a gene-environment interaction was described as a continuous variable, close examination of the published data revealed the value of the EF where there is a change in risk allele. A hypothetical example shown in Figure 1 indicates that when dietary protein, as percent total energy intake, is below 15, individuals who are AA at a hypothetical genetic locus show higher levels of serum LDL-cholesterol. At the same time, when protein intake levels are above 15, individuals carrying the other allele at this same locus (either AG or GG genotypes) show higher levels of LDL-cholesterol. The data on gene-environment interactions presented here reflect these changes in risk allele(s) observed at such inflection points.
Figure 1.
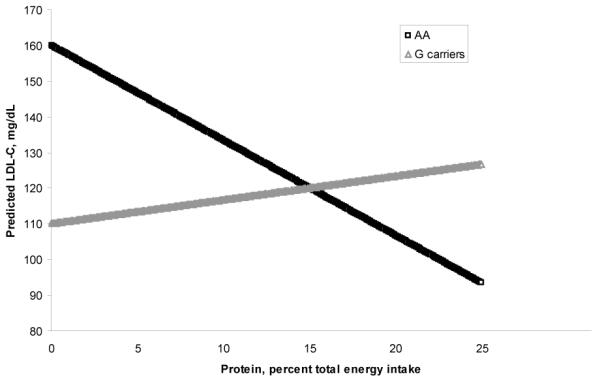
A hypothetical gene-environment interaction presented with dietary protein intake as a continuous variable affecting LDL-cholesterol levels. At a protein intake of about 15% of total energy, there is a switch in risk genotype from AA to G carriers.
Standardization of terms
Because the genetic variants of many older examples of gene-diet and other gene-environment interactions were analyzed with low-throughput methods and in a time before wide acceptance of standard databases of human variation, SNP accession numbers are not available in those publications. We therefore traced through the literature to a source that fully described the genotyping assay in order to unequivocally identify the polymorphism with an rs accession number. We were successful in providing an rs accession in nearly all such cases but there are a few data rows where the SNP rs identifier is unknown. A few other variants, mostly short insertions/deletions, have no dbSNP accession. In order to maintain such nomenclature connections, the database also includes the older, common names of the variants under the column “SNP alias.” We also sought to standardize terms used to describe the phenotypes and to a lesser degree the environmental factors constituting the gene-environment interaction. Thus, different publications regarding, for example, GxEs for “high-density lipoprotein,” “HDL,” “HDL-C” and “HDL-cholesterol” were all classified under the term HDL-C.
The database
Mining available scientific reports yielded 554 different gene-environment interactions of relevance to metabolic diseases and biomarkers of their progression. These interactions involve 146 different SNPs and short insertion/deletions that map to 88 different genes. Of the 554 GxE interactions, HDL-C as a phenotype and physical activity as an environmental factor have the highest number of examples in their respective categories at 85 and 109. An assortment of different phenotypes serving as indicators of obesity number 98 GxE interactions, of which 40 are for BMI. Summary characteristics of the collected gene by environment interactions are provided in Table 2. The assembled data, taken from 184 published reports plus one unpublished observation, as well as future updates will be accessible at the dbNP website (http://www.dbnp.org). The numbers of unique genes and SNPs involved in GxE interactions for each of several main phenotypes are listed in Table 3. For most of the phenotypes listed, the most commonly observed environmental term in the GxE interaction represents about 20-25% of all GxEs for that phenotype. Plasma TG levels are different in this respect, only five of 44 GxEs involve a high-fat challenge, the most common environmental factor, suggesting added complexity to the relationship between genetic variation, environment and triglyceride levels.
Table 2.
Phenotypes and Environmental factors with the greatest number of examples in their respective categories.
| Phenotype | Number of GxE data points | Environmental factor | Number of GxE data points |
|---|---|---|---|
| obesity phenotypes | 98 | physical activity | 109 |
| BMI | 40 | fat, total, percent energy from | 57 |
| waist circumference | 17 | SFA, percent energy from | 46 |
| delta body weight | 12 | PUFA, percent energy from | 33 |
| delta fat mass | 6 | high-fat challenge | 29 |
| lipid phenotypes | MUFA, percent energy from | 24 | |
| HDL-C | 85 | alcohol | 20 |
| triglyceride | 44 | Mediterranean diet | 15 |
| cholesterol, total | 33 | low-energy diet | 12 |
| LDL-C | 29 | low-fat diet | 12 |
| delta LDL-C | 9 | PUFA, N-3, percent energy from | 12 |
| APOA1, plasma | 8 | fish oil | 11 |
| APOB, plasma | 7 | diet, in general | 10 |
| APOC3, plasma | 7 | smoking | 10 |
| delta cholesterol, total | 7 | dietary cholesterol | 9 |
| delta HDL-C | 7 | PUFA, N-6, percent energy from | 9 |
| triglyceride:HDL-C ratio | 7 | SFA:CHO ratio | 9 |
| LDL-C:HDL-C ratio | 5 | NCEP-1 diet | 7 |
| insulin phenotypes | fenofibrate | 6 | |
| insulin resistance (HOMA-IR) | 17 | PUFA:SFA ratio | 5 |
| glucose, 2-h | 8 | ||
| type 2 diabetes | 8 | ||
| glucose, fasting | 6 | ||
| insulin, fasting | 6 | ||
| vascular phenotypes | |||
| blood pressure, systolic | 9 | ||
| intima-media thickness | 9 | ||
| homocysteine, plasma | 5 | ||
| C-reactive protein, plasma | 4 |
Table 3.
The number of unique genes and unique SNPs showing GxE interactions for a given phenotype.
| Phenotype | # Genes | # SNPs | # GxEs | Most common EF, n |
|---|---|---|---|---|
| HDL-C | 22 | 31 | 85 | physical activity, 17 |
| triglyceride | 16 | 21 | 44 | high-fat challenge, 5 |
| cholesterol, total | 12 | 17 | 33 | physical activity, 8 |
| LDL-C | 10 | 18 | 29 | dietary SFA, 5 |
| HOMA-IR | 7 | 8 | 17 | SFA:CHO ratio, 9 |
| obesity phenotypes | 38 | 48 | 98 | physical activity, 20; dietary fat, 17 |
| BMI | 19 | 23 | 40 | physical activity, 9; dietary SFA, 7 |
The most common environmental factor is also listed, where n = the number of data points
Pathway analysis of GxE genes
Pathway analysis on those genes carrying variants that are sensitive to a particular environmental term or relate to a given phenotype will give insight into which biochemical, physiological or disease pathways, or sub-networks thereof, are more sensitive in an allele-specific manner to variation in the environment. Results from such pathway analysis for selected phenotypes and environmental factors are listed in Table 4. It is noteworthy that of those sets of genes containing SNPs that show GxE interactions involving either obesity phenotypes in general, BMI specifically, HDL-C, triglycerides, total cholesterol, physical activity, dietary fat or dietary saturated fat all contain an abundance of genes mapping to the PPAR signaling pathway. While this result could arise from research bias, it does underscore the immense importance of genetic variation within the three genes central to this pathway: PPARA, PPARD and PPARG, as well as two co-regulators PPARGC1A and PPARGC1B.
Table 4.
Pathway and gene ontology analysis for select phenotypes and envionmental factors showing GxE interactions.
| Phenotype | Gene ontology terms | Pathways |
|---|---|---|
| obesity phenotypes | BP: fat cell differentiation, regulation of lipid metabolic process, triglyceride metabolic process, response to insulin stimulus, regulation of appetite, regulation of response to food, positive regulation of fatty acid oxidation, regulation of cholesterol transport, ovulation |
PPAR signaling, adipocytokine signaling, mitochondrial uncoupling |
| MF: interleukin-6 receptor binding | ||
| CC: none | ||
| BMI | BP: positive regulation of fatty acid metabolic process, triglyceride metabolic process, response to insulin stimulus, regulation of fat cell differentiation, regulation of lipid metabolic process, regulation of gluconeogenesis, fatty acid beta-oxidation |
PPAR signaling, adipocytokine signaling |
| MF: carnitine O-palmitoyltransferase activity | ||
| CC: none | ||
| HDL-C | BP: reverse cholesterol transport, negative regulation of interleukin-1 beta production, regulation of intestinal cholesterol absorption, regulation of cholesterol storage, triglyceide-rich lipoprotein particle remodeling, HDL particle remodeling, cholesterol homeostasis, triglyceride homeostasis |
PPAR signaling, chylomicron-mediated lipid transport, CETP-mediated lipid exchange: spherical HDL gains triacylglycerol |
| MF: cholesterol transporter activity, phosphatidylcholine-sterol O-acyltransferase activator activity, triglyceride lipase activity |
||
| CC: HDL particle, chylomicron, VLDL particle | ||
| triglycerides | BP: reverse cholesterol transport, lipoprotein metabolic process, triglyceride metabolic process, cholesterol homeostasis, triglyceride homeostasis, lipoprotein particle clearance, response to wounding, HDL particle remodeling, LDL particle remodeling, regulation of cholesterol transport, cholesterol metabolic process |
PPAR signaling, chylomicron-mediated lipid transport, CETP-mediated lipid exchange: LDL gains cholesterol ester |
| MF: cholesterol transporter activity, lipoprotein receptor binding | ||
| CC: HDL particle, chylomicron, IDL particle, VLDL particle | ||
| cholesterol, total | BP: triglyceride-rich lipoprotein particle remodeling, HDL particle remodeling, CDC42 protein signal transduction, cholesterol transport, cholesterol homeostasis, triglyceride homeostasis, positive regulation of cholesterol efflux, triglyceride metabolic process, regulation of lipoprotein lipase activity |
PPAR signaling, chylomicron-mediated lipid transport |
| MF: HDL receptor binding, LDL receptor binding, cholesterol transporter activity | ||
| CC: HDL particle, chylomicron, IDL particle, VLDL particle | ||
| Environmental factor | ||
| physical activity | BP: plasma lipoprotein particle remodeling, regulation of inflammatory response, positive regulation of gluconeogenesis, brown fat cell differentiation, blood circulation, vascular process in circulatory system, regulation of blood vessel size, cholesterol homeostasis, regulation of cholesterol transport, reverse cholesterol transport, response to hypoxia, negative regulation of IL1B production |
PPAR signaling, neuroactive ligand-receptor interaction, adrenoreceptors, chylomicron- mediated lipid transport, CETP-mediated lipid exchange: spherical HDL gains triacylglycerol |
| MF: cholesterol transporter activity, HDL receptor binding, apolipoprotein receptor binding, beta-adrenergic receptor activity |
||
| CC: spherical HDL particle | ||
| dietary fat | BP: lipid homeostasis, triglyceride homeostasis, reverse cholesterol transport, triglyceride metabolic process, positive regulation of fatty acid metabolic process, negative regulation of macrophage derived foam cell differentiation, cell cycle arrest, VLDL particle remodeling, HDL particle remodeling |
PPAR signaling, lipoprotein metabolism |
| MF: triglyceride binding | ||
| CC: HDL particle, chylomicron, VLDL particle | ||
| dietary saturated fat | BP: reverse chlolesterol transport, cholesterol efflux, lipoprotein particle clearance, cholesterol homeostasis, triglyceride homeostasis, regulation of cholesterol transport, regulation of cholesterol storage, negative regulation of macrophage derived foam cell differentiation, triglyceride mobilization, VLDL particle remodeling, LDL particle remodeling, HDL particle remodeling, plasma lipoprotein particle assembly, lipid localization |
PPAR signaling, adipocytokine signaling, chylomicron-mediated lipid transport, CET- mediated lipid exchange: LDL gains cholesterol ester |
| MF: HDL receptor binding, cholesterol transporter activity | ||
| CC: HDL particle, chylomicron, IDL particle, VLDL particle | ||
BP: biological process
MF: molecular function
CC: cellular component
Replicated gene-environment interactions
Replication of gene by environment interactions in other, independent studies gives confidence that such interactions are more universal and less specific to the particulars of one population. Replication is not often observed because of inherent differences between populations and a multitude of environmental factors, some of which may confound, exert influence on or contribute to a given GxE in an unknown manner. Nonetheless, a scan through the GxE database described here allows identification of interactions that in some cases appear rather strongly to replicate. Although there is danger in such literature-based meta-analysis [16], we still consider it of value to identify GxE interactions that show a high degree of similarity in terms of gene, variant, associated phenotype and the environmental factor modifying that relationship. These are results deserving of further attention. We have extracted from the database 13 different phenotype-risk allele-environmental factor combinations that replicate and involve nine different markers in seven distinct genes (Table 5). This effort does, however, illustrate the conundrum of replication of GxE studies. For example, the APOA5 marker rs662799 (−1131T>C, −600T>C, S13) is reported by three different groups to form a GxE with plasma TG levels, but in different populations the environmental factor is either total fat from a high-fat challenge (measured as percent energy), percent energy from dietary PUFA, or percent energy from dietary N-6 PUFA [17-19].
Table 5.
Gene-environment interactions replicated in other populations.
| Gene | SNP | Risk allele | Phenotype | Environmental factor |
Condition of environmental factor |
Note | PubMed ID |
|---|---|---|---|---|---|---|---|
| APOA2 | rs5082 | C | BMI | SFA | high | replicated in both sexes in three populations | 19901143 |
| APOE | rs429358, rs7412 |
E2 | HDL-C | physical activity | active | in Spanish males | 11474482 |
| high intesity | in Swiss males | 11788473 | |||||
| CETP* | rs708272 | T | HDL-C | alcohol | 15-30g/day | in American males | 18063597 |
| any amount | in Chinese males | 18835593 | |||||
| CETP | rs1532624 | NR | HDL-C | physical activity | NR | reported in three populations | 20066028 |
| LIPC | rs1800588 | C | HDL-C | total fat | less than 30% total energy | American | 12403660 |
| less than 30% total energy | Indian in Singapore | 14608050 | |||||
| less than 33.2% total energy |
in African American females, but not in African American men or in American Whites |
17157861 | |||||
| rs1800588 | T | triglycerides | total fat | greater than 30% of total energy |
3 populations of Singapore: Malay, Indian, Chinese |
14608050 | |
| T | triglyceride:HDL-C ratio |
total fat | greater than 22% | 3 populations of Singapore: Malay, Indian, Chinese |
14608050 | ||
| PLIN1 | rs1052700 | T | insulin resistance (HOMA-IR) |
SFA:CHO ratio | greater than 0.19 | 2 populations of Singapore females: Malay, Chinese |
16732014 |
| PLIN1 | rs894160 | A | insulin resistance (HOMA-IR) |
SFA:CHO ratio | greater than 0.19 | 3 populations of Singapore females: Malay, Indian, Chinese |
16732014 |
| PPARG | rs1801282 | G | insulin, fasting | PUFA:SFA ratio | low | UK population, both sexes | 14681835 |
| C | greater than 0.66 | UK population, both sexes | 11246892 | ||||
| C | BMI | total fat | high | found in both sexes from Quebec, Canada | 12630956 | ||
| C | found in American females | 14506127 | |||||
| SLC2A2 | rs5400 | NR | cholesterol, total | physical activity | NR | reported in two populations | 20066028 |
| SLC2A2 | rs5400 | NR | cholesterol, total | diet | NR | reported in two populations | 20066028 |
this result was not observed in two Spanish studies [20398902, 20581105]
NR = not reported
Interactions not replicated
Instances where an observed interaction was not found in a second study can be determined. Examples include the Gln380His variant of APOA4 on both HDL-C and LDL-C with dietary saturated fat [20,21], APOA5 promoter SNP rs662799 on TG and dietary fat in two distinct populations [18,19], SNP rs708272 of CETP with changes in total cholesterol and dietary saturated fat [21,22], LIPC SNP rs1800588 with HDL-C and dietary saturated fat and with conflicting risk alleles [23-25], LPL variant rs328 with cholesterol and dietary saturated fat [21,22] but which did not replicate in African Americans [25]. Other examples are rs662 of PON1 with heart disease and smoking [26,27], PPARG SNP rs1801282 with type 2 diabetes and physical activity [28,29], and PPARGC1A SNP rs8192678 [28,30] and rs1800849 of UCP3 both with obesity and physical activity [31,32]. Although different in composition, two different low-calorie diets gave conflicting risk alleles with FABP2 SNP rs1799883 for glucose measures [33,34] as did CETP variant rs708272 with coronary heart disease and alcohol consumption [35,36].
Replicated lack of interaction
Repeated observations of a lack of GxE interaction can also be extracted from this database. It has been reported twice that APOB SNP rs1042031 shows no interaction with dietary cholesterol on LDL-C levels [21,37]. Two studies showed a lack of GxE interaction for obesity and physical activity involving MC4R variant rs17782313 [38,39]. Lastly, the APOE and CETP genes offer several instances where GxE interactions were not replicated in some populations where such an interaction was examined (Table 1 provided as supplementary file). Overall, tests for GxE interaction that fail in some but not other studies, or in all studies for which we could find information to that effect, provide a means to focus statistical analysis in a new study or to investigate important differences between populations.
GxE genes found in important nutrigenomics datasets
Recently, nutrigenomics datasets have detailed both the PPARA and PPARG networks, as well as described genes differentially expressed after consumption of either phenol-rich (extra virgin) olive oil or a mixture of compounds with known or proposed anti-inflammation properties (AIDM) [40-43]. This allows asking which genes contain polymorphisms associating with metabolic syndrome traits in a manner modified by environmental factors and which phenotypes and environmental factors are most often found in the interactions involving those shared genes. In other words, we can begin to identify the central players, in terms of phenotypes and environmental factors, which are subject to allele-specific sensitivity to diet, exercise, or other environmental factors within each of these four gene networks. For example, the AIDM regimen was proposed to exert anti-atherogenic effects by reducing inflammation. Integration with our GxE database shows that certain AIDM genes tend to modulate allele-specific effects on HDL-C, LDL-C and total cholesterol in a manner influenced by dietary MUFA. Epidemiological evidence shows that olive oil and the Mediterranean diet of which it is a central component are enriched in MUFA, and importantly that these exert anti-inflammatory effects [43,44], but this may be confounded by other olive oil components like polyphenolics, which are also anti-inflammatory. A second notable result of this comparison is the finding that 28 of 224 PPARA network genes [41] show significant allele-specific interaction(s) in the GxE database. This is a 26-fold enrichment given a genome size of 22000 genes and 87 identified GxE genes. Comparison of the four datasets to the GxE database, including highly represented phenotypes and environmental factors of the shared genes, is given in Table 6.
Table 6.
Comparison of four nutrigenomics gene sets to the GxE database.
| Gene set | PPARA network | PPARG network | AIDM | Olive oil response |
|---|---|---|---|---|
| n | 224 | 252 | 422 | 103 |
| shared genes |
ACSL1, ACSL5, ANGPTL4, APOA1, APOA2,
APOA5, APOC3, CD36, CPT1A, CPT1B, CYP3A5, FABP2, FADS1, IL1B, IL6, IL6R, LEPR, LIPC, LIPE, LIPG, LPL, MTTP, NFKB1, NR1H3, PLIN1, TNF, UCP2, UCP3 |
ACSL1, CD36, EDNRA,
FHL1, LIPE, LPL, NR1H3, PLIN1, PPARG, UCP2 |
ADIPOQ, APOA1, APOC3,
CETP, F7 |
CDKN2A, IL1B, IL6 |
| fold enrichment | 26.7 | 10.0 | 3.0 | 7.4 |
| highly represented phenotypes | HDL-C, triglyceride | HDL-C, HOMA-IR, BMI | HDL-C, LDL-C, total cholesterol | ND |
|
highly represented
environmental factors |
dietary fat, high-fat challenge, PUFA, SFA | physical activity, dietary fat, SFA, fish oil |
MUFA | ND |
n = number of genes in the respective gene set
Discussion
In order to better and more fully comprehend the interplay between genome, environment and measures of disease or health status, we sought to populate a database with published gene-environment interactions that pertain to blood lipids, obesity and affiliated diseases such as atherosclerosis, heart disease and diabetes mellitus (Table 1 provided as supplementary file). In essence, these are phenotypes under the umbrella of metabolic syndrome. The database described here contains 554 such examples involving diet, physical activity, alcohol and tobacco use, as well as other environmental factors in a manner altering the genotype-phenotype relationship with clinical measures of metabolic syndrome. Furthermore, growing interest in the use of allele-specific pathway fluxes and differential networks [45] both necessitate that an extensive cataloging of gene-environment interactions be undertaken. Such pathway fluxes and network associations that depend on or are sensitive to genetic variation are already described with respect to therapeutic regimens, particularly anti-oncogenic [46,47], and the number of these examples is increasing. Here, we describe collecting gene-environment interaction data from published sources and cataloging that information. We also provide a few short examples of mining those data which serve to illustrate the utility of such a database. The PPAR signaling pathway is highly represented by genes containing variants that show association with an array of phenotypes and environmental factors. Cholesterol and triglyceride homeostasis are also biological functions common to many phenotypes and environmental factors (Table 4). Comparison with some key nutrigenomics data indicates that genes within a PPARA network tend to be sensitive to dietary fat, PPARG network genes tend to be sensitive to physical activity, and many MUFA-sensitive genes are shared with those showing altered expression in response to administration of an anti-inflammation diet mix (Table 6). In addition, we also note a number of GxE interactions observed in more than one study (Table 5).
MicroRNA-based regulation of cholesterol metabolism and transport genes is an emerging and intriguing development. Control of cholesterol homeostasis via SREBP1 and SREBP2, sterol regulatory element-binding proteins which function as transcriptional regulators, in concert with intron-encoded microRNA MIRN33 occurs by acting upon cholesterol transporter ABCA1 [48,49]. Interestingly, the results of our g:Profiler analysis, which provides data on enrichment of putative microRNA-mRNA interactions, indicate that MIRN768, or SNORD71, is enriched in genes containing SNPs constituting GxE interactions involving total fat and saturated fat in the diet. SNORD71 was upregulated during adipocyte differentiation and more highly expressed in both pre-adipocytes and subcutaneous fat tissue from obese over lean individuals [50]. Thus, mining the GxE data can generate new hypotheses and allows us to speculate that SNORD71 is involved in the allele-specific response to dietary fat.
In order to maximize the potential of applying “omics” technologies to nutrition research so as to encourage optimal health in the individual, a federated and openly available database, termed the nutritional phenotype database (dbNP), has been established [51]. Two keys to this effort are collection of data types that are specific and important to nutrition research and offering standard annotation of the included data entries. With regard to genetics, those data will reside within the “analytical technology” segment of the dbNP, along with data on biological information, such as food intake, transcriptome, metabolome, proteome, imaging and biomarkers. A significant aspect of this genetics component is the gene by diet or gene by environment interaction. With this in mind, the GxE data described here have been incorporated into dbNP.
A GxE database can serve as a launching pad to begin experiments in genetics, population genetics, molecular biology, or computational analysis (e.g., motif analysis) in order to uncover the mechanisms by which the environment is sensed by the genome or alters the response at the level of the cell, organ or organism. Such a perspective is being applied to the genetics of cancer and metabolic diseases as we found that these are by far the two broad disease categories with the greatest number of publications describing gene-environment interactions. There are also studies of the impact of socio-economic status as an environmental variable on access to health care, health outcomes and achievement in school. Lastly, there are also some studies of the influence of environment on cognitive function, mainly dominated by the role of APOE.
The limitations of this database deserve discussion. First, the environmental factors collected in the current database may not be comprehensive in terms of broader areas in sociology (e.g., psychosocial factors and social environment) [52] and environmental science (e.g., pollution). However, we believe that this database contains most of the important GxE interactions pertaining to metabolic syndrome and related traits. Second, some interactions are biologically significant, but they may not be statistically significant [53]. Although the primary interest of current research has focused on statistical interactions, more effort needs be applied to biological interactions. Third, the data included here all emanate from candidate gene studies. The case of CYP1A2 variants, caffeine intake and myocardial infarction, where an association was not observed until dual stratification of genotype and caffeine intake was considered [54], illustrates a potential shortcoming of such studies, but does suggest that still many other GxE interactions may be described with careful incorporation of accurate data on environmental exposures. Fourth, the assessment methods of environmental exposures and outcomes are often different in each study, and so some data terms may include a mixture of data with different levels of confidence. An example of this is a value based on self-report compared to a direct measurement. In addition, small sample sizes may contribute to false positive gene-environment interactions. Last, with regard to the nature of epidemiological studies, different levels of evidence generated from diverse study designs, quality of the study, statistical analyses, and sample size have been combined when cataloging the studies.
Despite some weaknesses, this database does provide unique strengths, including indication of risk alleles in each condition of environmental factors; study populations sampled, and even examples of lack of interaction. This information is important for investigators to extract evidence and generate a new hypothesis and can offer corroboration of claims asserted by genetic tests. By collecting and mining published results, we believe that such data can serve as a useful resource to explore a research interest with a broader scope (e.g., across genes, environmental factors, or phenotypes) as we demonstrate in this report. This database should be used as a tool during analysis of genotype association data. Researchers will be able to query this database prior to statistical analysis as a means to focus those analyses to a particular gene, phenotype or environmental factor. Doing so will reduce the number of multiple comparisons and lead to more robust significance values. In conclusion, by making this database available and integrating it into the broader dbNP, it is our hope that interested researchers will be able to more easily pursue questions of how the human genome senses and responds to lifestyle choices. Furthermore and perhaps most importantly, this database can be one of many items to be implemented in research questions of health in the context of nutrition.
Supplementary Material
Acknowledgements
This work has been supported by the United States Department of Agriculture (58-1950-9-001), the National Heart, Lung, and Blood Institute (R01 HL54776, U01 HL72524), the National Institute of Diabetes and Digestive and Kidney Diseases (R01 DK075030), National Institute on Aging (P01 AG023394-03), and by an unrestricted grant from Sciona, Inc. The authors declare no competing interests.
Abbreviations
- AIDM
Anti-Inflammatory Dietary Mix
- dbNP
Database of Nutritional Phenotypes
- EF
Environmental Factor
- GWAS
Genome-Wide Association Study
- GxE
Gene by Environment
- SNP
Single Nucleotide Polymorphism
- TG
Plasma Triglyceride
References
- 1.Human genome at ten: The sequence explosion. Nature. 2010;464:670–671. doi: 10.1038/464670a. [DOI] [PubMed] [Google Scholar]
- 2.The International HapMap 3 Consortium. Altshuler DM, Gibbs RA, Peltonen L, Altshuler DM, Gibbs RA, et al. Integrating common and rare genetic variation in diverse human populations. Nature. 2010;467:52–58. doi: 10.1038/nature09298. [DOI] [PMC free article] [PubMed] [Google Scholar]
- 3.Manolio TA, Collins FS. The HapMap and genome-wide association studies in diagnosis and therapy. Annu Rev Med. 2009;60:443–456. doi: 10.1146/annurev.med.60.061907.093117. [DOI] [PMC free article] [PubMed] [Google Scholar]
- 4.Manolio TA, Collins FS, Cox NJ, Goldstein DB, Hindorff LA, et al. Finding the missing heritability of complex diseases. Nature. 2009;461:747–753. doi: 10.1038/nature08494. [DOI] [PMC free article] [PubMed] [Google Scholar]
- 5.Ordovas JM, Shen J. Gene-environment interactions and susceptibility to metabolic syndrome and other chronic diseases. J Periodontol. 2008;79:1508–1513. doi: 10.1902/jop.2008.080232. [DOI] [PMC free article] [PubMed] [Google Scholar]
- 6.Andreassi MG. Metabolic syndrome, diabetes and atherosclerosis: influence of gene-environment interaction. Mutat Res. 2009;667:35–43. doi: 10.1016/j.mrfmmm.2008.10.018. [DOI] [PubMed] [Google Scholar]
- 7.Kuhn M, Campillos M, Letunic I, Jensen LJ, Bork P. A side effect resource to capture phenotypic effects of drugs. Mol Syst Biol. 2010;6:343. doi: 10.1038/msb.2009.98. [DOI] [PMC free article] [PubMed] [Google Scholar]
- 8.Klein RJ, Xu X, Mukherjee S, Willis J, Hayes J. Successes of genome-wide association studies. Cell. 2010;142:353–355. doi: 10.1016/j.cell.2010.07.026. [DOI] [PubMed] [Google Scholar]
- 9.Wang K, Bucan M, Grant SF, Schellenberg G, Hakonarson H. Strategies for genetic studies of complex diseases. Cell. 2010;142:353–355. doi: 10.1016/j.cell.2010.07.025. [DOI] [PubMed] [Google Scholar]
- 10.McClellan J, King MC. Why it is time to sequence. Cell. 2010;142:353–355. [Google Scholar]
- 11.Lai C, Lyman RF, Long AD, Langley CH, Mackay TF. Naturally occurring variation in bristle number and DNA polymorphisms at the scabrous locus of Drosophila melanogaster. Science. 1994;266:1697–1702. doi: 10.1126/science.7992053. [DOI] [PubMed] [Google Scholar]
- 12.Nelson VR, Spezio SH, Nadeau JH. Transgenerational genetic effects of the paternal Y chromosome on daughters’ phenotypes. Epigenomics. 2010;2:513–521. doi: 10.2217/epi.10.26. [DOI] [PMC free article] [PubMed] [Google Scholar]
- 13.Haig D. Does heritability hide in epistasis between linked SNPs? Eur J Hum Genet. 2010 doi: 10.1038/ejhg.2010.161. (in press) [DOI] [PMC free article] [PubMed] [Google Scholar]
- 14.Lanktree MB, Hegele RA. Gene-gene and gene-environment interactions: new insights into the prevention, detection and management of coronary artery disease. Genome Med. 2009;1:28. doi: 10.1186/gm28. [DOI] [PMC free article] [PubMed] [Google Scholar]
- 15.Reimand J, Kull M, Peterson H, Hansen J, Vilo J. g:Profiler--a web-based toolset for functional profiling of gene lists from large-scale experiments. Nucleic Acids Res. 2007;35:193–200. doi: 10.1093/nar/gkm226. [DOI] [PMC free article] [PubMed] [Google Scholar]
- 16.Palla L, Higgins JP, Wareham NJ, Sharp SJ. Challenges in the use of literature-based meta-analysis to examine gene-environment interactions. Am J Epidemiol. 2010;171:1225–1232. doi: 10.1093/aje/kwq051. [DOI] [PubMed] [Google Scholar]
- 17.Moreno R, Perez-Jimenez F, Marin C, Moreno JA, Gomez P, et al. A single nucleotide polymorphism of the apolipoprotein A-V gene −1131T>C modulates postprandial lipoprotein metabolism. Atherosclerosis. 2006;189:163–168. doi: 10.1016/j.atherosclerosis.2005.11.029. [DOI] [PubMed] [Google Scholar]
- 18.Lai CQ, Corella D, Demissie S, Cupples LA, Adiconis X, et al. Dietary intake of n-6 fatty acids modulates effect of apolipoprotein A5 gene on plasma fasting triglycerides, remnant lipoprotein concentrations, and lipoprotein particle size: the Framingham Heart Study. Circulation. 2006;113:2062–2070. doi: 10.1161/CIRCULATIONAHA.105.577296. [DOI] [PubMed] [Google Scholar]
- 19.Mattei J, Demissie S, Tucker KL, Ordovas JM. Apolipoprotein A5 polymorphisms interact with total dietary fat intake in association with markers of metabolic syndrome in Puerto Rican older adults. J Nutr. 2009;139:2301–2308. doi: 10.3945/jn.109.109900. [DOI] [PMC free article] [PubMed] [Google Scholar]
- 20.Campos H, López-Miranda J, Rodríguez C, Albajar M, Schaefer EJ, et al. Urbanization elicits a more atherogenic lipoprotein profile in carriers of the apolipoprotein A-IV-2 allele than in A-IV-1 homozygotes. Arterioscler Thromb Vasc Biol. 1997;17:1074–1081. doi: 10.1161/01.atv.17.6.1074. [DOI] [PubMed] [Google Scholar]
- 21.Weggemans RM, Zock PL, Ordovas JM, Ramos-Galluzzi J, Katan MB. Genetic polymorphisms and lipid response to dietary changes in humans. Eur J Clin Invest. 2001;31:950–957. doi: 10.1046/j.1365-2362.2001.00906.x. [DOI] [PubMed] [Google Scholar]
- 22.Wallace AJ, Mann JI, Sutherland WH, Williams S, Chisholm A, et al. Variants in the cholesterol ester transfer protein and lipoprotein lipase genes are predictors of plasma cholesterol response to dietary change. Atherosclerosis. 2000;152:327–336. doi: 10.1016/s0021-9150(99)00490-6. [DOI] [PubMed] [Google Scholar]
- 23.Ordovas JM, Corella D, Demissie S, Cupples LA, Couture P, et al. Dietary fat intake determines the effect of a common polymorphism in the hepatic lipase gene promoter on high-density lipoprotein metabolism: evidence of a strong dose effect in this gene-nutrient interaction in the Framingham Study. Circulation. 2002;106:2315–2321. doi: 10.1161/01.cir.0000036597.52291.c9. [DOI] [PubMed] [Google Scholar]
- 24.Zhang C, Lopez-Ridaura R, Rimm EB, Rifai N, Hunter DJ, et al. Interactions between the −514C->T polymorphism of the hepatic lipase gene and lifestyle factors in relation to HDL concentrations among US diabetic men. Am J Clin Nutr. 2005;81:1429–1435. doi: 10.1093/ajcn/81.6.1429. [DOI] [PubMed] [Google Scholar]
- 25.Nettleton JA, Steffen LM, Ballantyne CM, Boerwinkle E, Folsom AR. Associations between HDL-cholesterol and polymorphisms in hepatic lipase and lipoprotein lipase genes are modified by dietary fat intake in African American and White adults. Atherosclerosis. 2007;194:131–140. doi: 10.1016/j.atherosclerosis.2006.11.025. [DOI] [PMC free article] [PubMed] [Google Scholar]
- 26.Balcerzyk A, Zak I, Krauze J. Synergistic effects between Q192R polymorphism of paraoxonase 1 gene and some conventional risk factors in premature coronary artery disease. Arch Med Res. 2007;38:545–550. doi: 10.1016/j.arcmed.2007.03.004. [DOI] [PubMed] [Google Scholar]
- 27.Mukamal KJ, Pai JK, Jensen MK, Rimm EB. Paraoxonase 1 polymorphisms and risk of myocardial infarction in women and men. Circ J. 2009;73:1302–1307. doi: 10.1253/circj.cj-08-0912. [DOI] [PMC free article] [PubMed] [Google Scholar]
- 28.Nelson TL, Fingerlin TE, Moss L, Barmada MM, Ferrell RE, et al. The peroxisome proliferator-activated receptor gamma coactivator-1 alpha gene (PGC-1alpha) is not associated with type 2 diabetes mellitus or body mass index among Hispanic and non Hispanic Whites from Colorado. Exp Clin Endocrinol Diabetes. 2007;115:268–275. doi: 10.1055/s-2007-960495. [DOI] [PubMed] [Google Scholar]
- 29.Kilpeläinen TO, Lakka TA, Laaksonen DE, Lindström J, Eriksson JG, et al. SNPs in PPARG associate with type 2 diabetes and interact with physical activity. Med Sci Sports Exerc. 2008;40:25–33. doi: 10.1249/mss.0b013e318159d1cd. [DOI] [PubMed] [Google Scholar]
- 30.Ridderstråle M, Johansson LE, Rastam L, Lindblad U. Increased risk of obesity associated with the variant allele of the PPARGC1A Gly482Ser polymorphism in physically inactive elderly men. Diabetologia. 2006;49:496–500. doi: 10.1007/s00125-005-0129-8. [DOI] [PubMed] [Google Scholar]
- 31.Berentzen T, Dalgaard LT, Petersen L, Pedersen O, Sørensen TI. Interactions between physical activity and variants of the genes encoding uncoupling proteins -2 and -3 in relation to body weight changes during a 10-y follow-up. Int J Obes (Lond) 2005;29:93–99. doi: 10.1038/sj.ijo.0802841. [DOI] [PubMed] [Google Scholar]
- 32.Alonso A, Martí A, Corbalán MS, Martínez-González MA, Forga L, et al. Association of UCP3 gene −55C>T polymorphism and obesity in a Spanish population. Ann Nutr Metab. 2005;49:183–188. doi: 10.1159/000086883. [DOI] [PubMed] [Google Scholar]
- 33.de Luis DA, Aller R, Izaola O, Sagrado MG, Conde R. Influence of ALA54THR polymorphism of fatty acid binding protein 2 on lifestyle modification response in obese subjects. Ann Nutr Metab. 2006;50:354–360. doi: 10.1159/000094299. [DOI] [PubMed] [Google Scholar]
- 34.Weiss EP, Brandauer J, Kulaputana O, Ghiu IA, Wohn CR, et al. FABP2 Ala54Thr genotype is associated with glucoregulatory function and lipid oxidation after a high-fat meal in sedentary nondiabetic men and women. Am J Clin Nutr. 2007;85:102–108. doi: 10.1093/ajcn/85.1.102. [DOI] [PubMed] [Google Scholar]
- 35.Jensen MK, Mukamal KJ, Overvad K, Rimm EB. Alcohol consumption, TaqIB polymorphism of cholesteryl ester transfer protein, high-density lipoprotein cholesterol, and risk of coronary heart disease in men and women. Eur Heart J. 2008;29:104–112. doi: 10.1093/eurheartj/ehm517. [DOI] [PubMed] [Google Scholar]
- 36.Corella D, Carrasco P, Amiano P, Arriola L, Chirlaque MD, et al. Common cholesteryl ester transfer protein gene variation related to high-density lipoprotein cholesterol is not associated with decreased coronary heart disease risk after a 10-year follow-up in a Mediterranean cohort: Modulation by alcohol consumption. Atherosclerosis. 2010;211:531–538. doi: 10.1016/j.atherosclerosis.2010.03.026. [DOI] [PubMed] [Google Scholar]
- 37.Gylling H, Kontula K, Koivisto UM, Miettinen HE, Miettinen TA. Polymorphisms of the genes encoding apoproteins A-I, B, C-III, and E and LDL receptor, and cholesterol and LDL metabolism during increased cholesterol intake. Common alleles of the apoprotein E gene show the greatest regulatory impact. Arterioscler Thromb Vasc Biol. 1997;17:38–44. doi: 10.1161/01.atv.17.1.38. [DOI] [PubMed] [Google Scholar]
- 38.Andreasen CH, Mogensen MS, Borch-Johnsen K, Sandbaek A, Lauritzen T, et al. Non-replication of genome-wide based associations between common variants in INSIG2 and PFKP and obesity in studies of 18,014 Danes. PLoS One. 2008;3:e2872. doi: 10.1371/journal.pone.0002872. [DOI] [PMC free article] [PubMed] [Google Scholar]
- 39.Cauchi S, Stutzmann F, Cavalcanti-Proença C, Durand E, Pouta A, et al. Combined effects of MC4R and FTO common genetic variants on obesity in European general populations. J Mol Med. 2009;87:537–546. doi: 10.1007/s00109-009-0451-6. [DOI] [PubMed] [Google Scholar]
- 40.Perera RJ, Marcusson EG, Koo S, Kang X, Kim Y, et al. Identification of novel PPARgamma target genes in primary human adipocytes. Gene. 2006;369:90–99. doi: 10.1016/j.gene.2005.10.021. [DOI] [PubMed] [Google Scholar]
- 41.Rakhshandehroo M, Knoch B, Müller M, Kersten S. Peroxisome proliferator-activated receptor alpha target genes. PPAR Res. 2010;pii:612089. doi: 10.1155/2010/612089. [DOI] [PMC free article] [PubMed] [Google Scholar]
- 42.Bakker GC, van Erk MJ, Pellis L, Wopereis S, Rubingh CM, et al. An antiinflammatory dietary mix modulates inflammation and oxidative and metabolic stress in overweight men: a nutrigenomics approach. Am J Clin Nutr. 2010;91:1044–1059. doi: 10.3945/ajcn.2009.28822. [DOI] [PubMed] [Google Scholar]
- 43.Camargo A, Ruano J, Fernandez JM, Parnell LD, Jimenez A, et al. Gene expression changes in mononuclear cells in patients with metabolic syndrome after acute intake of phenol-rich virgin olive oil. BMC Genomics. 2010;11:253. doi: 10.1186/1471-2164-11-253. [DOI] [PMC free article] [PubMed] [Google Scholar]
- 44.Konstantinidou V, Covas MI, Muñoz-Aguayo D, Khymenets O, de la Torre R, et al. In vivo nutrigenomic effects of virgin olive oil polyphenols within the frame of the Mediterranean diet: a randomized controlled trial. FASEB J. 2010;24:2546–57. doi: 10.1096/fj.09-148452. [DOI] [PubMed] [Google Scholar]
- 45.de la Fuente A. From ‘differential expression’ to ‘differential networking’ - identification of dysfunctional regulatory networks in diseases. Trends Genet. 2010;26:326–333. doi: 10.1016/j.tig.2010.05.001. [DOI] [PubMed] [Google Scholar]
- 46.Moreno-Sánchez R, Saavedra E, Rodríguez-Enríquez S, Gallardo-Pérez JC, Quezada H, et al. Metabolic control analysis indicates a change of strategy in the treatment of cancer. Mitochondrion. 2010 doi: 10.1016/j.mito.2010.06.002. (in press) doi:10.1016/j.mito.2010.06.002. [DOI] [PubMed] [Google Scholar]
- 47.MacConaill LE, Garraway LA. Clinical implications of the cancer genome. J Clin Oncol. 2010 doi: 10.1200/JCO.2009.27.4944. (in press) doi: 10.1200/JCO.2009.27.4944. [DOI] [PMC free article] [PubMed] [Google Scholar]
- 48.Najafi-Shoushtari SH, Kristo F, Li Y, Shioda T, Cohen DE, et al. MicroRNA-33 and the SREBP host genes cooperate to control cholesterol homeostasis. Science. 2010;328:1566–1569. doi: 10.1126/science.1189123. [DOI] [PMC free article] [PubMed] [Google Scholar]
- 49.Rayner KJ, Suárez Y, Dávalos A, Parathath S, Fitzgerald ML, et al. MiR-33 contributes to the regulation of cholesterol homeostasis. Science. 2010;328:1570–1573. doi: 10.1126/science.1189862. [DOI] [PMC free article] [PubMed] [Google Scholar]
- 50.Ortega FJ, Moreno-Navarrete JM, Pardo G, Sabater M, Hummel M, et al. MiRNA expression profile of human subcutaneous adipose and during adipocyte differentiation. PLoS One. 2010;5:e9022. doi: 10.1371/journal.pone.0009022. [DOI] [PMC free article] [PubMed] [Google Scholar]
- 51.van Ommen B, Bouwman J, Dragsted LO, Drevon CA, Elliott R, et al. Challenges of molecular nutrition research 6: the nutritional phenotype database to store, share and evaluate nutritional systems biology studies. Genes Nutr. 2010;5:189–203. doi: 10.1007/s12263-010-0167-9. [DOI] [PMC free article] [PubMed] [Google Scholar]
- 52.Seabrook JA, Avison WR. Genotype-environment interaction and sociology: contributions and complexities. Soc Sci Med. 2010;70:1277–1284. doi: 10.1016/j.socscimed.2010.01.016. [DOI] [PubMed] [Google Scholar]
- 53.Corella D, Ordovas JM. Single nucleotide polymorphisms that influence lipid metabolism: Interaction with dietary factors. Annu Rev Nutr. 2005;25:341–390. doi: 10.1146/annurev.nutr.25.050304.092656. [DOI] [PubMed] [Google Scholar]
- 54.Cornelis MC, El-Sohemy A, Kabagambe EK, Campos H. Coffee, CYP1A2 genotype, and risk of myocardial infarction. JAMA. 2006;295:1135–1141. doi: 10.1001/jama.295.10.1135. [DOI] [PubMed] [Google Scholar]
Associated Data
This section collects any data citations, data availability statements, or supplementary materials included in this article.