

Abstract
Intervertebral disks support compressive forces because of their elastic stiffness as well as the fluid pressures resulting from poroelasticity and the osmotic (swelling) effects. Analytical methods can quantify the relative contributions, but only if correct material properties are used. To identify appropriate tissue properties, an experimental study and finite element analytical simulation of poroelastic and osmotic behavior of intervertebral disks were combined to refine published values of disk and endplate properties to optimize model fit to experimental data. Experimentally, nine human intervertebral disks with adjacent hemi-vertebrae were immersed sequentially in saline baths having concentrations of 0.015, 0.15, and 1.5 M and the loss of compressive force at constant height (force relaxation) was recorded over several hours after equilibration to a 300-N compressive force. Amplitude and time constant terms in exponential force–time curve-fits for experimental and finite element analytical simulations were compared. These experiments and finite element analyses provided data dependent on poroelastic and osmotic properties of the disk tissues. The sensitivities of the model to alterations in tissue material properties were used to obtain refined values of five key material parameters. The relaxation of the force in the three bath concentrations was exponential in form, expressed as mean compressive force loss of 48.7, 55.0, and 140 N, respectively, with time constants of 1.73, 2.78, and 3.40 h. This behavior was analytically well represented by a model having poroelastic and osmotic tissue properties with published tissue properties adjusted by multiplying factors between 0.55 and 2.6. Force relaxation and time constants from the analytical simulations were most sensitive to values of fixed charge density and endplate porosity.
Keywords: Lumbar spine, Viscoelasticity, Osmotic pressure, Material properties, Swelling, Force relaxation
INTRODUCTION
Much of the understanding of intervertebral disk biomechanical function comes from finite element analyses. The accuracy of these analyses requires that the material properties as well as the geometry are correctly represented. The material properties used in finite element models are obtained from tests of isolated tissue. Tests to determine time-dependent and anisotropic elastic properties of these tissues are technically challenging to perform, thus requiring that models be compared with whole disk tests under a range of testing conditions to ensure their validity.
The time-dependent behavior of intervertebral disks is important because of the need to maintain the separation between vertebrae. The disks creep under sustained loading, and subsequently ‘recover’ when unloaded with time constants of several hours.26 Physical activity and diurnal variations in spinal loading produce substantial changes in disk hydration.32,33 The elastic and ‘swelling’ properties change with aging and degeneration, and might be altered therapeutically. The relatively low permeability of the vertebral endplates2,41 and of the annulus fibrosus result in slow decay of the compressive load supported by a disk.
The behavior of hydrated soft tissues has been described by poroelastic constitutive models34,43,44 and by swelling properties.20 In a triphasic representation of the disk, a compressive force is supported by a combination of elastic stress and two components of fluid pressure associated, respectively, with poroelastic behavior and osmotic pressure. The osmotic effects are associated with fixed charges carried by proteoglycans within the extra-cellular matrix. The swelling properties of tissues can be quantified by measuring hydration, osmotic swelling, and creep behavior in baths having differing osmolarity.4,6,19,47,48 Disk degeneration is associated with loss of proteoglycans and decrease in pH that both reduce the fixed charge density (FCD).16,39,48
Neglecting ion flow in the tissue, poroelastic models have been extended to include osmotic swelling pressure indirectly through volume changes3,35,36 and directly based on FCD.28,38,51 The incorporation of electrochemical theory8 allows the representation of osmotic swelling pressure by modeling the electrochemical interactions of the fixed charges.7,10,13,21,22,27,42,50,52
This study addressed the material property values used in a triphasic finite element model of the time-dependent behavior of the intervertebral disk under compression, and when immersed in fluid baths of different salinities. Experiments with human disks that followed the same experimental protocol as the simulations provided a dataset that permitted adjustment of the elastic, poroelastic, and osmotic tissue property parameters to obtain the best match between experiments and simulations. The time-dependent force relaxation behavior with changes in bath salinity provided information about the osmotic (‘swelling’) behavior. The human disk specimens were tested with adjacent hemi-vertebrae to approximate in vivo boundary conditions. The purpose of this study was to obtain refined values of the published tissue properties by minimizing the differences between the analytical model and the actual disk specimens, taking into account the calculated sensitivity of the model behavior to the values of these properties. This was intended to identify refined values that would be preferable to originally published values for use in finite element analyses.
MATERIALS AND METHODS
Force Relaxation Experiments
Nine human lumbar intervertebral disks (T12-L5) were obtained from five lumbar spines (four male spines and one female spine, mean age of 51 years, SD of 16 years, range 16–69 years) and the compression force relaxation behavior in phosphate buffered saline baths of three different concentrations was recorded. Spines were stored at −80 °C until testing, when they were thawed, and divided into sections by cutting transversely through the middle of adjacent vertebrae. The posterior elements were removed to produce specimens consisting of a disk and two adjacent hemivertebral bodies that were potted in polymethylmethacrylate cement. These constructs were mounted in a mechanical testing machine that controlled the specimen’s height during the force relaxation tests while recording the applied force. The testing machines were either a custom machine45 or uniaxial servohydraulic testing machine (Instron 8511, Instron Pty Ltd., High Wycombe, UK).
The phosphate buffered saline bath had initial hypotonic concentration of 0.015 M, which was increased in two steps to 0.15 M (normotonic), then 1.5 M (hypertonic) at room temperature (21 °C). The hypo- and normo-tonic saline concentrations were obtained by diluting 1.5 M phosphate buffered saline (Fischer Scientific, Fairlawn, NJ, USA) with deionized water. Protease inhibitors (1 mM ethylenediaminetetraacetic acid, 1 mM Iodoacetamide, 1 μg/mL Pepstatin-A, 1 mM Benzamadine) were added to minimize tissue autolysis. Each bath change included fresh protease inhibitors to maintain their effectiveness.
Prior to the force–relaxation experiments, specimens were equilibrated with axial compressive preload of 300 N in a hypotonic (0.015 M) bath for 15 h (Fig. 1). The initial force of 300 N was chosen because it was found from preliminary studies that the entire subsequent experimental protocol could then be completed without the compressive force reducing to zero. The 15 h equilibration time was selected since preliminary experiments indicated minimal further loss of disk height after this time. Subsequently, the specimen height was fixed and the constraining force (initially 300 N) was recorded in each of three bath concentrations. The three relaxation phases were termed Relax-1: 9 h at 0.015 M (hypotonic); Relax-2: 15 h after a bath concentration change to 0.15 M (physiological); and Relax 3: 9 h after a bath concentration change to 1.5 M (hypertonic, i.e., 10 times physiological). These times were selected based on the preliminary experiments indicating that disks achieved slow rates of change of force (i.e., near equilibrium) after several hours. Axial compressive force was recorded each minute.
FIGURE 1.
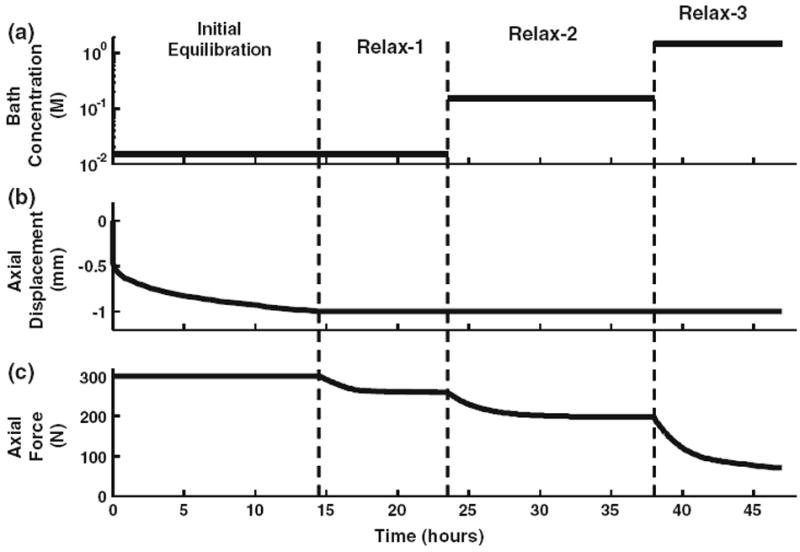
Disk testing protocol showing (a) bath concentration (b) axial displacement, and (c) axial force time histories. Initially the disks were subjected to equilibration for 14 h under a 300-N preload in a 0.015-M (0.1 times physiological) saline bath. The disk heights were then fixed for the force–relaxation sequences Relax-1, Relax-2, and Relax-3 at each of the three bath concentrations 0.015 M (0.1 times physiological), 0.15 M (physiological), and 1.5 M (10 times physiological) for 9, 15, and 9 h, respectively.
Comparisons between the measurements of the time-dependent loss of compression force during the force–relaxation experiments with the analytically derived values were performed after fitting both force–time relationships with an exponential function. The exponential in function was employed because the time-dependent behavior (visco-elastic, poroelastic, or diffusion) can be considered as a first-order mechanical system. The experimental or analytical values of compressive force f as a function of time t were fit with the function:
| (1) |
where A is the amplitude of force change, τ the time constant, and ff the asymptotic value. The MATLAB function fminsearch (The MathWorks, Natick, MA, USA) was used to find the parameter values that minimized the sum of squared differences between recorded and exponential-fit values.
After testing, the disks were sectioned transversely and graded for disk degeneration by the method of Thompson et al.46 modified for transverse sections.
Finite Element Analytical Model
The experimental sequences were simulated in a 3D finite element model. This was an adaptation of the 2D poroelastic and chemical-electric finite element representation of the intervertebral disk22 with the addition of the adjacent hemi-vertebrae and endplates. The tissues were represented as hydrated and charged porous media, thus each tissue was assigned elastic properties (elastic modulus, shear modulus, and Poisson’s ratio), permeability (porosity and solid–fluid friction coefficient) (Table 1), and FCD. The fluid was assigned a bulk modulus, and displacements of ions were assigned solid-ion and fluid-ion friction coefficients. The Galerkin finite element method with linear basis functions and tetrahedral elements was used to develop the model equations. The equations were split into two sets, the electrochemical equations and the solid–fluid equations, as in the previous 2D model.22 For each implicit finite difference time step, the nonlinear electrochemical system was solved by direct iteration using an assumed fixed set of nodal values of the fixed charged density to achieve a solution with mass balance of ions and balanced electric potential. This electrochemical solution was then used to solve the solid–fluid equations. The initial equilibration to the 300 N compressive force was simulated with a time step of 600 s and the relaxation simulations used a time step of 216 s, these times steps being selected to ensure adequate representation of the time-varying compression force relaxation behavior. The constraining force acting on the hemi-vertebrae at each time step was calculated by the summation of the stresses in each upper boundary element multiplied by the corresponding area. The volume of the specimen (that varied because of fluid flow at the boundaries) was calculated by summating all element volumes.
TABLE 1.
Material properties of the analytical model.
| Material property | Units | Value | Source |
|---|---|---|---|
| Annulus | |||
| Radial modulus (Err) | MPa | 0.45 | Elliott and Setton9 |
| Circumferential modulus (Ecc) | MPa | 17.45 | Elliott and Setton9 |
| Axial modulus (Ezz) | MPa | 0.82 | Elliott and Setton9 |
| Radial-circumferential Poisson’s ratio (νrc) | 0.33 | Elliott and Setton9 | |
| Radial-axial Poisson’s ratio (νrz) | 0.14 | Elliott and Setton9 | |
| Circumferential-axial Poisson’s ratio (νcz) | 0.19a | Elliott and Setton9 | |
| Radial-circumferential shear modulus (Grc) | kPa | 25.3 | Fujita et al.11 |
| Circumferential-axial shear modulus (Gcz) | kPa | 56.0 | Fujita et al.11 |
| Axial-radial shear modulus (Gzr) | kPa | 32.1 | Fujita et al.11 |
| Porosity (na) | 0.68b | Antoniou et al.1 | |
| Solid–fluid friction coefficient (fswa) | 1014 N s/m4 | 4.23c | Gu et al.15 |
| Trabecular bone | |||
| Isotropic solid modulus (Et) | MPa | 220 | Lim and Hong31 |
| Isotropic solid Poisson’s ratio (νt) | 0.24 | Lim and Hong31 | |
| Porosity (nt) | 0.82 | Lim and Hong31 | |
| Solid–fluid friction coefficient (fswt) | 106 N s/m4 | 4.83 | Lim and Hong31 |
| Cortical bone | |||
| Isotropic solid modulus (Ec) | 1010 Pa | 1.46 | Cowin5 |
| Isotropic solid Poisson’s ratio (νc) | 0.325 | Cowin5 | |
| Porosity (nc) | 0.094 | Li et al.30 | |
| Solid–fluid friction coefficient (fswc) | 1012 N s/m4 | 1.66 | Li et al.30 |
| Endplate | |||
| Isotropic solid modulus (Ee) | 1010 Pa | 1.46 | Cowin,5 cf. Cortical bone |
| Isotropic solid Poisson’s ratio (νe) | 0.325 | Cowin,5 cf. Cortical bone | |
| Porosity (ne) | 0.10 | cf. Cortical bone | |
| Solid–fluid friction coefficient | 1014 N s/m4 | 4.00d | Ayotte et al.2 |
| Nucleus | |||
| Isotropic solid modulus (En) | MPa | 0.14e | Périé et al.37 and Iatridis et al.24 |
| Isotropic solid Poisson’s ratio (νn) | 0.40e | Périé et al.37 and Iatridis et al.24 | |
| Porosity (nn) | 0.77b | Antoniou et al.1 | |
| Solid–fluid friction coefficient (fswn) | 1014 N s/m4 | 6.7 | Johannessen and Elliott25 |
| Ions | |||
| Positive ion-fluid friction coefficient | 1014 N s/m4 | 1.97 | Gu et al.14 |
| Positive (Na+) ion–solid friction coefficient | 105 N s/m4 | 1.00 | |
| Negative (Cl−) ion–fluid friction coefficient | 1014 N s/m4 | 3.04 | Scaled as (MWCl/MWNa)a Na+ coefficient |
| Negative (Cl−) ion–solid friction coefficient | 105 N s/m4 | 1.00 |
Value calculated from the published data and after imposing orthotropic material relationships.
Average of values given for healthy and degenerated tissue.
Average of all disk degeneration grades and relative fluid flow directions.
Value calculated from the pressure drops for flow out of the disk.
Value calculated from the published data and after imposing isotropic material relationships.
The primary coupled field variables in the analytical model were (1) solid displacements, (2) relative fluid displacements, (3) electric potentials, and (4) negative (chloride) ion concentrations. The secondary variables were (1) positive (sodium) ion concentration obtained by assuming electro-neutrality, (2) relative fluid velocity, (3) solid and fluid stresses, (4) the flux of positive and negative ions, (5) electrical current, and (6) fluid pressure. The model equations were solved using custom code written in Matlab (The MathWorks).
The intervertebral disk geometry was idealized with ‘kidney-shaped’ section in the axial plane, peripheral disk bulge, annulus-nucleus boundary, and endplate shape as described by Broberg3 (Fig. 2). Endplates were represented by a 1-mm thick layer of elements on the inferior and superior surfaces of the disk. The hemi-vertebrae were represented by two layers of elements aligned perpendicular to the endplates with a cortical bone external shell and trabecular bone interior. Averaged dimensions (from measurements of radiographs of each of the nine vertebra-disk-vertebra specimens) gave principal dimensions of the modeled disk as 33.8 × 45.8 × 5.0 mm3; wedge angle 5°; distance between vertebral centers 36.3 mm.
FIGURE 2.
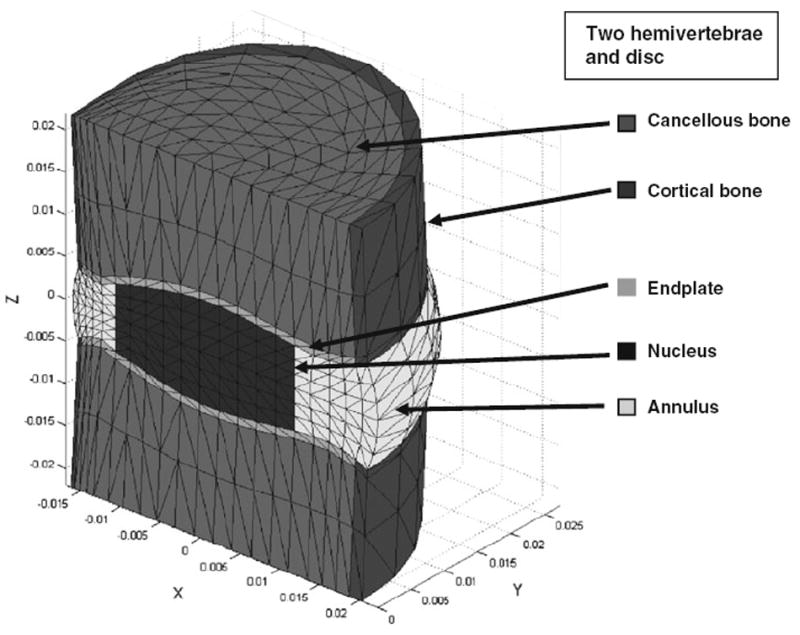
Mesh and material regions of the analytical model. Regions are cancellous bone, cortical bone, endplate, disk nucleus, and disk annulus. Axis dimensions are in meter.
Elastic and poroelastic material properties’ values for the five regions in the model (Fig. 2) were obtained from the literature (see Table 1). Orthotropic elastic properties of the annulus were obtained from ‘linear region’ values given by Elliott and Setton9 for the outer annulus. The annulus shear moduli were obtained from Fujita et al.11 The circumferential-axial Poisson’s ratio value was calculated from the orthotropic material relationship relating moduli and Poisson’s ratios, ensuring that the material stress–strain relationships were positive-definite (i.e., energy-conservative). Other materials were considered as isotropic.
The distribution of the FCD in the nucleus and annulus was based on reported values for proteoglycan content of healthy disks23 and assumed to be independent of the vertical dimension. The values were in the range 0.03–0.13 M equivalents/L, with highest values in the nucleus. The endplates and adjacent hemi-vertebrae were considered as poroelastic, without electrical charge. Endplate permeability was calculated from pressure-flow experiments reported by Ayotte et al.2 Solid–fluid friction coefficients were calculated from the equation relating permeabilities, porosity, and ion friction coefficients given in Iatridis et al.24 The variable concentration of phosphate buffered saline together with the (acidic) protease inhibitors was found to give variable pH of the bath of 6.8 at 1.5 and 0.15 M, but pH of 4.79 in the hypotonic 0.015 M bath. Since the more acidic pH in the hypotonic bath would reduce the effective FCD in the disk, values were adjusted by an empirical factor initially set to 0.67 for simulations with the hypotonic bath, this value derived from data for articular cartilage.12
Boundary conditions were imposed such that all translations on the transverse mid-plane surface of the inferior vertebra were constrained to be zero. Fluid flow at the mid-transverse plane surfaces of the superior and inferior vertebrae was unconstrained (free-draining), to represent the presumed experimental conditions (imperfect seal at potted surfaces), as well as the likely in vivo conditions with venting of intraosseus fluid pressure via vascular channels. The ionic concentrations of sodium and chloride were altered in stepped increments to represent the bath changes. For each simulated bath change, the initial potentials within the disk were set using Donnan equilibrium, and the electrochemical solution was then iteratively solved to ensure equilibrium prior to the poroelastic solution.
Parameter refinement involved calculating adjustments to five selected tissue material property values obtained from the literature to optimize model–experiment agreement. These selected properties that represented elastic, poroelastic, and osmotic behaviors were the three orthotropic annulus elastic moduli (E); nucleus and annulus FCD disk and bone solid–fluid friction coefficients (fsw); factor to adjust FCD for the reduced bath solution pH (pH_adj) at 0.015 M concentration, and endplate porosity (pore).
The parameter adjustments were based on model sensitivity to tissue properties. The sensitivity of the model to these five property multipliers (factors) was determined by re-running the model simulations after varying each factor by ±10%. Sensitivity was expressed as the proportional change in model behavior (amplitude and time constant values from simulations of each of the three force relaxation phases of the experiment) divided by the proportional change in the multiplying factor (10%). The sensitivities obtained from the positive and negative 10% adjustments were averaged. Hence, there were five multiplying factors to be optimized, and six experimental values (goals) to be matched. The optimization was performed in three steps: an initial empirical step, followed by two cost function minimization steps employing the sensitivity values. For this optimization, the cost function was calculated as the sum of squares of the proportional differences in each of the three amplitudes and three time-constants expressed as a proportion of the corresponding experimental values.29
RESULTS
There was a good fit subjectively and objectively (R2 ≥ 0.99) for recorded data to the simple exponential in Eq. (1). Therefore, the values of the asymptotic amplitude A and the time constant τ were used to quantify the experimental and analytical results.
In the three force relaxation experiments, there was a mean compressive force loss (A in Eq. 1) of 48.7, 55.0, and 140 N, respectively, with time constants of 1.73, 2.78, and 3.4 h (Table 2), and there was substantial variability between specimens (Fig. 3). The variability between specimens in these measurements was expressed as standard deviations that were between 0.11 and 0.49 of the mean values (Table 2), and the inter-specimen variability was not explained by differences in disk physical dimensions or Thompson grade46 (no significant correlations were found). Two disks were Thompson grade II, five were grade III, and one disk each was grades IV and V. Prior to the force relation experiments, the initial equilibration for 15 h with the initial bath concentration of 0.015 M produced a mean specimen height loss (creep) of 0.59 mm with a time constant (τ) of 4.87 h. The fact that force relaxation was observed in the Relax-1 experiment indicated that the disks had not in fact reached constant force in the initial equilibration, even though the displacement appeared to be asymptotic.
TABLE 2.
Experimental mean (SD) and model results.
| Time constant (τ h)
|
Amplitude (A)
|
|||
|---|---|---|---|---|
| Experimental | Simulation | Experimental | Simulation (N) | |
| Relax-1 | 1.73 (0.48) | 2.3 | 48.7 (17.4) N | 50.1 |
| Relax-2 | 2.78 (0.56) | 3.6 | 55.0 (16.2) N | 57.8 |
| Relax-3 | 3.4 (0.86) | 2.4 | 140 (15.7) N | 150 |
With factorial adjustment of five key material properties.
Annulus Young’s modulus: ×1.23 (elastic property).
Fluid–solid friction coefficient: ×2.6 (poroelastic property).
Endplate porosity × 1.05 (poroelastic property).
FCD: ×0.65 at pH = 7 (osmotic property).
FCD: ×0.55 adjustment factor at pH = 5 (osmotic property).
FIGURE 3.
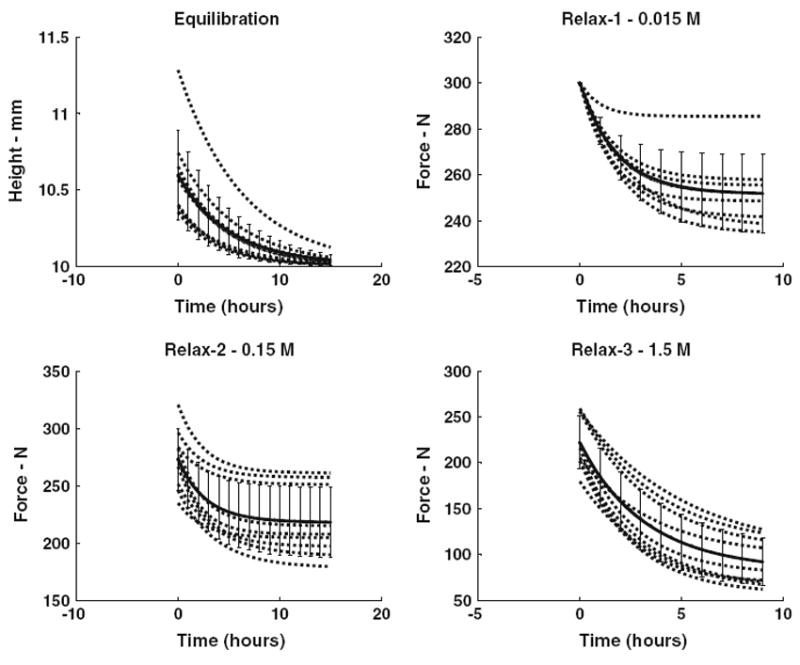
Exponential curve fits to experimental recordings of specimen height (initial equilibration) and of compressive force (three force–relaxation experiments at different bath concentrations). In each panel the lines are curve fits for individual specimens together with a mean curve-fit (error bars are SEM).
The initial finite element analytical simulations with published values of the tissue material properties were characterized by over-estimated swelling [3 mL disk volume gain during equilibration, 38 N increase in compressive force during relaxation in the hypotonic (0.015 M) bath, and extremely rapid and overestimated loss of compressive force in the hypertonic (1.5 M) bath]. These changes occurred in the analysis with much shorter time constants than those experimentally observed. Therefore, empirical adjustments were made to the disk principal elastic, swelling, and poroelastic properties by the use of multiplying factors for Young’s modulus of the annulus (E) (2.0), the fluid–solid friction coefficient fsw (1.8) and the FCD (0.6) and an adjustment factor to reduce FCD at reduced pH in the 0.015 M bath (0.67), and endplate permeability (pore) (0.5). The subsequent ‘optimized’ adjustments in the factorial adjustment multipliers were Young’s modulus of the annulus (E) (1.231), the fluid–solid friction coefficient fsw (2.6), the FCD (0.65) and an adjustment factor to reduce FCD at reduced pH (0.55), and endplate permeability (pore) (1.05).
After rerunning the analytical simulations with these refined values of the multiplying factors, the overall agreement between analyses and experiments was improved to the values given in Table 2, and as illustrated in Fig. 4. The simulations indicated fluid volumetric loss of 0.3 mL after each of the bath changes. In the simulation of the prior equilibration with 300 N preload the volumetric gain was 0.5 mL together with 0.59 mm loss of height of the specimen. The volume gain occurred because of peripheral bulging of the disk. The sensitivities to positive and negative 10% changes in tissue properties were similar (less than 30% different in 24 of 30 cases), indicating relatively linear dependence of model behavior on these factors. The mean values (Table 3) identify FCD (and its adjustment for pH) and endplate porosity as the factors to which the relaxation behavior was most sensitive.
FIGURE 4.
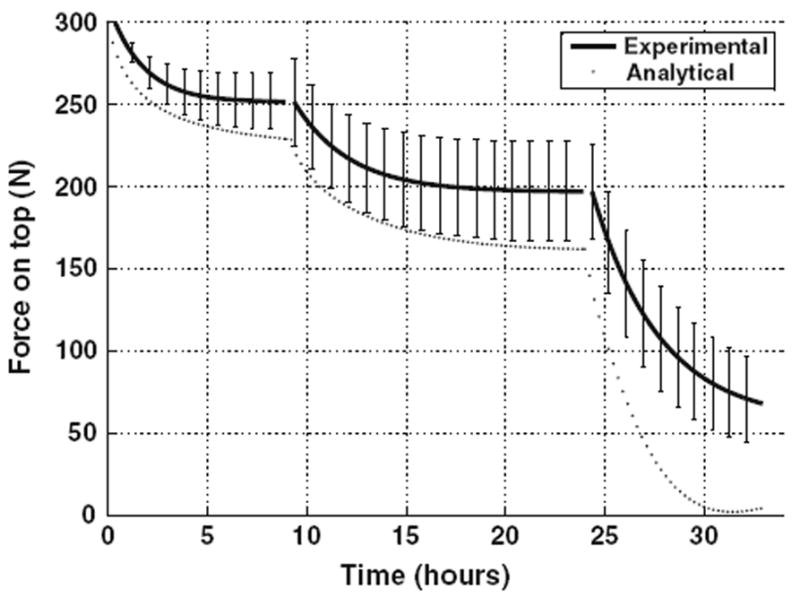
Motion segment relaxation showing experimental behavior (and standard deviation error bars) and simulated analytical behavior after factorial adjustment of the five selected tissue material properties.
TABLE 3.
Sensitivities of analytically determined creep and relaxation behaviors (time constants and amplitudes) to changes in model tissue property parameters.
| Annulus Young’s modulus (E) | Fluid–solid friction coefficient (fsw) | FCD | pH adjustment factor (pH_adj) | Endplate porosity (pore) | ||
|---|---|---|---|---|---|---|
| Relax 1 (0.015 M) | Time constant | 0.16 | 0.09 | −0.00 | 0.00 | −0.41 |
| Amplitude | −0.10 | 0.15 | −3.73 | 1.29 | −0.70 | |
| Relax 2 (0.15 M) | Time constant | −0.99 | 0.22 | −0.29 | 0.67 | −0.46 |
| Amplitude | −0.07 | −0.11 | −0.20 | −1.85 | −0.11 | |
| Relax 3 (1.5 M) | Time constant | −0.48 | 0.19 | −0.07 | −0.06 | −0.80 |
| Amplitude | −0.25 | −0.18 | 3.0 | −0.01 | −0.32 | |
| Mean absolute | 0.34 | 0.16 | 1.2 | 0.65 | 0.47 |
Note: Sensitivity defined as (proportional change in behavior)/(proportional change in property).
In the tests of convergence for time step and mesh refinement, the model having refined property values was rerun after doubling the time step and after doubling of the number of nodes. With the doubling of the time step there was less than 11 N differences in the calculated forces, this observed during rapid changes in force occurring after a bath change. A reanalysis with a refined mesh (4693 vs. 2353 nodes) gave force value differences averaging 4.6 N, indicating adequate convergence prior to the mesh refinement.
DISCUSSION
The relaxation behavior of the disks with the three different bath concentrations showed the expected exponential form, and the analytical model showed qualitatively similar behavior that was improved substantially by making relatively small adjustments to five key groups of tissue property parameters. These adjustments improved the agreement between simulations and experiments, but an exact match to the six measures of force relaxation (time constants and amplitudes in each the three bath concentrations) was not achieved by this parameter optimization. The first two time constants were over-estimated in the simulations relative to the experimental results, producing a more rapid loss of force during the relaxations, and consequently an accumulated over-estimate of the reduction in compressive force.
There was a very large range of behaviors of the hemi-vertebra-disk-hemi-vertebra constructs as shown in Fig. 3 for the nine specimens tested. Material property values were adjusted to represent the averaged behavior. However, the initial (published) values when used in the model did not match any observed behavior. The between-specimen variability was not well explained by differing physical dimensions, implicating different material properties that are not well correlated with degeneration grade. This study could be extended to investigate this, and potentially provide a range of material properties (as well as the ‘average match’), but probably requiring a larger and more representative sample of spinal segment specimens.
The analytical behaviors were numerically most sensitive to changes in values of the FCD (or its adjustment for pH) and of the endplate porosity. These sensitivities draw attention to likely effects of aging and degeneration of the disk on these properties—both the FCD and the endplate permeability are reported to decrease, and pH becomes more acidic. Thus, the aging changes would be expected to produce significant changes in the time-dependent load-bearing behavior, according to these analytical predictions.
The adjustments of tissue properties that improved the analytical–experimental agreements were by multiplying factors between 0.55 (for FCD) and 2.6 (for the solid–fluid friction coefficient). The numerically smallest adjustment factor was 1.05 (for endplate porosity). The approximately factor-of-two modifications of tissue properties that improved the experimental–analytical agreement are considered to be small, relative to the variability in the reported values of these properties, and the substantial variability of the measured behavior of the nine disks tested (Fig. 3).
Improved agreement between analyses and experimental data was obtained by increasing disk annulus moduli by a factor of 1.23 compared to published values for the ‘elastic-region’9 that were used instead of the lower values for the ‘toe-region,’ suggesting that the annulus tissue was in a tensile strained condition during the experiments. The FCD was reduced from published values, and a further decrease was required to compensate for reduced pH in the 0.015 M bath, and the amount of this pH adjustment was greater than indicated by the data (for articular cartilage) reported by Grodzinsky et al.12 The reduction in FCD was despite the initial values being at the low end of the range of published values.23,48 The largest adjustment (increase in the solid–fluid friction by 2.6) was not unexpected, since this property is difficult to measure, so the published values may be unreliable and subject to uncertainties about the relatives roles of intra- and extra-fibrillar water.20,40 The smallest adjustment was in the value for endplate porosity (increased from 0.1 to 0.105).
Including hemi-vertebrae and endplates adjacent to the intervertebral disk was considered important, since these structures are significant contributors to the deformation and fluid exchange that occur in motion segments.49 The bony and cartilaginous structures of the endplate were combined in the representation of the endplate, with values taken from a study that included both structures.2 The cartilaginous endplate tissue normally has a small effect on flow properties relative to the bony component.41 The simulations did not include solid phase viscoelastic properties of disk and bone. These properties are reported to have small values for annulus tissue samples.18
The tissue properties were considered to be finite-strain independent since in the stress–relaxation tests the tissue volumetric strains are quite small (approximately 0.6 mL volume change occurring in the simulations, corresponding to volumetric strains less than 6%). Permeability is approximately proportional to small volumetric strains.17 The refined estimates of tissue properties given here should therefore correspond to average effective values for the state of volumetric strain (hydration) of the tissues, which in turn is not known exactly either in the whole disk experiments or in the published tissue experiments from which values were obtained for the analyses. At the beginning of the force relaxation tests the compressive force was 300 N which corresponds to an intradiscal pressure of about 200 kPa, associated with the low end of the range of normal activities.
Results of this study emphasize the interactions among tissue FCD, stiffness, and permeability in contributing to the axial poroelastic behaviors of the motion segment behaviors.
The published values of disk tissue properties must be modified for use in a finite element model to represent the time-dependent behavior that was recorded in the force–relaxation experiments.
Findings also confirm the importance of FCD in ability of intervertebral disks to support compressive forces and sensitivity studies indicated that endplate porosity and annulus modulus were more important than tissue permeability in defining stress–relaxation behavior. These studies show how disk degeneration involving loss of FCD and decreased pH of the tissue can compromise the ability of disks to support compressive load.
Acknowledgments
This study was funded by NIH Grant R01 AR 049370. Lumbar spines were provided by the National Disease Research Interchange (NDRI). Jacob Lubinski assisted with a preliminary study. Richard Stanley provided technical support for experimental work.
References
- 1.Antoniou J, Steffen T, Nelson F, Winterbottom N, Hollander AP, Poole RA, Aebi M, Alini M. The human lumbar intervertebral disc: evidence for changes in the biosynthesis and denaturation of the extracellular matrix with growth, maturation, ageing, and degeneration. J Clin Invest. 1996;98(4):996–1003. doi: 10.1172/JCI118884. [DOI] [PMC free article] [PubMed] [Google Scholar]
- 2.Ayotte DC, Ito K, Tepic S. Direction-dependent resistance to flow in the endplate of the intervertebral disc: an ex vivo study. J Orthop Res. 2001;19(6):1073–1077. doi: 10.1016/S0736-0266(01)00038-9. [DOI] [PubMed] [Google Scholar]
- 3.Broberg KB. On the mechanical behaviour of intervertebral discs. Spine. 1983;8(2):151–165. doi: 10.1097/00007632-198303000-00006. [DOI] [PubMed] [Google Scholar]
- 4.Charnley J. The imbibition of fluid as a cause of herniation of the nucleus pulposus. Lancet. 1952;1(6699):124–127. doi: 10.1016/s0140-6736(52)92428-8. [DOI] [PubMed] [Google Scholar]
- 5.Cowin SC. Bone poroelasticity. J Biomech. 1999;32(3):217–238. doi: 10.1016/s0021-9290(98)00161-4. [DOI] [PubMed] [Google Scholar]
- 6.Drost MR, Willems P, Snijders H, Huyghe JM, Janssen JD, Huson A. Confined compression of canine annulus fibrosus under chemical and mechanical loading. J Biomech Eng. 1995;117(4):390–396. doi: 10.1115/1.2794197. [DOI] [PubMed] [Google Scholar]
- 7.Ehlers W, Karajan N, Markert B. An extended biphasic model for charged hydrated tissues with application to the intervertebral disc. Biomech Model Mechanobiol. 2009;8(3):233–251. doi: 10.1007/s10237-008-0129-y. [DOI] [PubMed] [Google Scholar]
- 8.Eisenberg SR, Grodzinsky AJ. Swelling of articular cartilage and other connective tissues: electro-mechanochemical forces. J Orthop Res. 1985;3(2):148–159. doi: 10.1002/jor.1100030204. [DOI] [PubMed] [Google Scholar]
- 9.Elliott DM, Setton LA. Anisotropic and inhomogeneous tensile behavior of the human anulus fibrosus: experimental measurement and material model predictions. J Biomech Eng. 2001;123:256–263. doi: 10.1115/1.1374202. [DOI] [PubMed] [Google Scholar]
- 10.Frijns AJH, Huyghe JM, Janssen JD. A validation of the quadriphasic mixture theory for intervertebral disc tissue. Int J Eng Sci. 1997;35:1419–1429. [Google Scholar]
- 11.Fujita Y, Wagner DR, Biviji AA, Duncan NA, Lotz JC. Anisotropic shear behavior of the annulus fibrosus: effect of harvest site and tissue prestrain. Med Eng Phys. 2000;22:349–357. doi: 10.1016/s1350-4533(00)00053-9. [DOI] [PubMed] [Google Scholar]
- 12.Grodzinsky AJ, Roth V, Myers E, Grossman WD, Mow VC. The significance of electromechanical and osmotic forces in the nonequilibrium swelling behavior of articular cartilage in tension. J Biomech Eng. 1981;103(4):221–231. doi: 10.1115/1.3138284. [DOI] [PubMed] [Google Scholar]
- 13.Gu WY, Lai WM, Mow VC. A mixture theory for charged-hydrated soft tissues containing multi-electrolytes: passive transport and swelling behaviors. J Biomech Eng. 1998;120:169–180. doi: 10.1115/1.2798299. [DOI] [PubMed] [Google Scholar]
- 14.Gu WY, Lai WM, Mow VC. Transport of fluid and ions through a porous-permeable charged-hydrated tissue, and streaming potential data on normal bovine articular cartilage. J Biomech. 1993;26(6):709–723. doi: 10.1016/0021-9290(93)90034-c. [DOI] [PubMed] [Google Scholar]
- 15.Gu WY, Mao VC, Foster RJ, Weidenbaum M, Mow VC, Rawlins BA. The anisotropic hydraulic permeability of human lumbar anulus fibrosus. Influence of age, degeneration, direction, and water content. Spine. 1999;24(23):2449–2455. doi: 10.1097/00007632-199912010-00005. [DOI] [PubMed] [Google Scholar]
- 16.Hendry NGC. The hydration of the nucleus pulposus and its relation to intervertebral disc derangement. J Bone Joint Surg. 1958;40B(1):132–144. doi: 10.1302/0301-620X.40B1.132. [DOI] [PubMed] [Google Scholar]
- 17.Heneghan P, Riches PE. Determination of the strain-dependent hydraulic permeability of the compressed bovine nucleus pulposus. J Biomech. 2008;41(4):903–906. doi: 10.1016/j.jbiomech.2007.11.014. [DOI] [PubMed] [Google Scholar]
- 18.Holzapfel GA, Schulze-Bauer CA, Feigl G, Regitnig P. Single lamellar mechanics of the human lumbar anulus fibrosus. Biomech Model Mechanobiol. 2005;3(3):125–140. doi: 10.1007/s10237-004-0053-8. [DOI] [PubMed] [Google Scholar]
- 19.Huyghe JM, Drost MR. Uniaxial tensile testing of canine annulus fibrosus tissue under changing salt concentrations. Biorheology. 2004;41(3–4):255–261. [PubMed] [Google Scholar]
- 20.Huyghe JM, Houben GB, Drost MR, van Donkelaar CC. An ionised/non-ionised dual porosity model of intervertebral disc tissue. Biomech Model Mechanobiol. 2003;2(1):3–19. doi: 10.1007/s10237-002-0023-y. [DOI] [PubMed] [Google Scholar]
- 21.Huyghe JM, Janssen JD. Quadriphasic mechanics of swelling incompressible porous media. Int J Eng Sci. 1997;35(8):793–802. [Google Scholar]
- 22.Iatridis JC, Laible JP, Krag MH. Influence of fixed charge density magnitude and distribution on the intervertebral disc: applications of a poroelastic and chemical electric (PEACE) model. J Biomech Eng. 2003;125:12–24. doi: 10.1115/1.1537190. [DOI] [PubMed] [Google Scholar]
- 23.Iatridis JC, MacLean JJ, O’Brien M, Stokes IA. Measurements of proteoglycan and water content distribution in human lumbar intervertebral discs. Spine. 2007;32(14):1493–1497. doi: 10.1097/BRS.0b013e318067dd3f. [DOI] [PMC free article] [PubMed] [Google Scholar]
- 24.Iatridis JC, Setton LA, Weidenbaum M, Mow VC. Alterations in the mechanical behavior of the human lumbar nucleus pulposus with degeneration and aging. J Orthop Res. 1997;15(2):318–322. doi: 10.1002/jor.1100150224. [DOI] [PubMed] [Google Scholar]
- 25.Johannessen W, Elliott DM. Effects of degeneration on the biphasic material properties of human nucleus pulposus in confined compression. Spine. 2005;30(24):E724–E729. doi: 10.1097/01.brs.0000192236.92867.15. [DOI] [PubMed] [Google Scholar]
- 26.Johannessen W, Vresilovic EJ, Wright AC, Elliott DM. Intervertebral disc mechanics are restored following cyclic loading and unloaded recovery. Ann Biomed Eng. 2004;32(1):70–76. doi: 10.1023/b:abme.0000007792.19071.8c. [DOI] [PubMed] [Google Scholar]
- 27.Lai WM, Hou JS, Mow VC. A triphasic theory for the swelling and deformation behaviors of articular cartilage. J Biomech Eng. 1991;113(3):245–258. doi: 10.1115/1.2894880. [DOI] [PubMed] [Google Scholar]
- 28.Laible JP, Pflaster DS, Krag MH, Simon BR, Haugh LD. A poroelastic-swelling finite element model with application to the intervertebral disc. Spine. 1993;18(5):659–670. doi: 10.1097/00007632-199304000-00019. [DOI] [PubMed] [Google Scholar]
- 29.Laible JP, Pflaster D, Simon BR, Krag MH, Pope M, Haugh LD. A dynamic material parameter estimation procedure for soft tissue using a poroelastic finite element model. J Biomech Eng. 1994;116(1):19–29. doi: 10.1115/1.2895699. [DOI] [PubMed] [Google Scholar]
- 30.Li GP, Bronk JT, An KN, Kelly PJ. Permeability of cortical bone of canine tibiae. Microvasc Res. 1987;34(3):302–310. doi: 10.1016/0026-2862(87)90063-x. [DOI] [PubMed] [Google Scholar]
- 31.Lim TH, Hong JH. Poroelastic properties of bovine vertebral trabecular bone. J Orthop Res. 2000;18(4):671–677. doi: 10.1002/jor.1100180421. [DOI] [PubMed] [Google Scholar]
- 32.Malko JA, Hutton WC, Fajman WA. An in vivo MRI study of the changes in volume (and fluid content) of the lumbar intervertebral disc after overnight bed rest and during an 8-hour walking protocol. J Spinal Disord Tech. 2002;15(2):157–163. doi: 10.1097/00024720-200204000-00012. [DOI] [PubMed] [Google Scholar]
- 33.Mcmillan DW, Garbutt G, Adams MA. Effect of sustained loading on the water content of intervertebral discs: Implications for disc metabolism. Ann Rheum Dis. 1996;55(12):880–887. doi: 10.1136/ard.55.12.880. [DOI] [PMC free article] [PubMed] [Google Scholar]
- 34.Mow VC, Kuei SC, Lai WM, Armstrong CG. Biphasic creep and stress relaxation of articular cartilage in compression: theory and experiments. J Biomech Eng. 1980;102(1):73–84. doi: 10.1115/1.3138202. [DOI] [PubMed] [Google Scholar]
- 35.Natarajan RN, Lavender SA, An HA, Andersson GB. Biomechanical response of a lumbar intervertebral disc to manual lifting activities: a poroelastic finite element model study. Spine. 2008;33(18):1958–1965. doi: 10.1097/BRS.0b013e3181822742. [DOI] [PubMed] [Google Scholar]
- 36.Natarajan RN, Williams JR, Andersson GB. Recent advances in analytical modeling of lumbar disc degeneration. Spine. 2004;29(23):2733–2741. doi: 10.1097/01.brs.0000146471.59052.e6. [DOI] [PubMed] [Google Scholar]
- 37.Perié D, Korda D, Iatridis JC. Confined compression experiments on bovine nucleus pulposus and annulus fibrosus: sensitivity of the experiment in the determination of compressive modulus and hydraulic permeability. J Biomech. 2005;38(11):2164–2171. doi: 10.1016/j.jbiomech.2004.10.002. [DOI] [PubMed] [Google Scholar]
- 38.Riches PE, Dhillon N, Lotz J, Woods AW, McNally DS. The internal mechanics of the intervertebral disc under cyclic loading. J Biomech. 2002;35:1263–1271. doi: 10.1016/s0021-9290(02)00070-2. [DOI] [PubMed] [Google Scholar]
- 39.Roughley PJ. Biology of intervertebral disc aging and degeneration: involvement of the extracellular matrix. Spine. 2004;29(23):2691–2699. doi: 10.1097/01.brs.0000146101.53784.b1. [DOI] [PubMed] [Google Scholar]
- 40.Schroeder Y, Elliott DM, Wilson W, Baaijens FP, Huyghe JM. Experimental and model determination of human intervertebral disc osmoviscoelasticity. J Orthop Res. 2008;26(8):1141–1146. doi: 10.1002/jor.20632. [DOI] [PubMed] [Google Scholar]
- 41.Setton LA, Zhu W, Weidenbaum M, Ratcliffe A, Mow VC. Compressive properties of the cartilaginous end-plate of the baboon lumbar spine. J Orthop Res. 1993;11(2):228–239. doi: 10.1002/jor.1100110210. [DOI] [PubMed] [Google Scholar]
- 42.Simon BR, Liable JP, Pflaster D, Yuan Y, Krag MH. A poroelastic finite element formulation including transport and swelling in soft tissue structures. J Biomech Eng. 1996;118(1):1–9. doi: 10.1115/1.2795941. [DOI] [PubMed] [Google Scholar]
- 43.Simon BR, Wu JS, Carlton MW, Evans JH, Kazarian LE. Structural models for human spinal motion segments based on a poroelastic view of the intervertebral disk. J Biomech Eng. 1985;107(4):327–335. doi: 10.1115/1.3138565. [DOI] [PubMed] [Google Scholar]
- 44.Simon BR, Wu JS, Carlton MW, Kazarian LE, France EP, Evans JH, Zienkiewicz OC. Poroelastic dynamic structural models of rhesus spinal motion segments. Spine. 1985;10(6):494–507. doi: 10.1097/00007632-198507000-00003. [DOI] [PubMed] [Google Scholar]
- 45.Stokes IA, Gardner-Morse M, Churchill D, Laible JP. Measurement of a spinal motion segment stiffness matrix. J Biomech. 2002;35(4):517–521. doi: 10.1016/s0021-9290(01)00221-4. [DOI] [PubMed] [Google Scholar]
- 46.Thompson JP, Pearce RH, Schechter MT, Adams ME, Tsang IK, Bishop PB. Preliminary evaluation of a scheme for grading the gross morphology of the human intervertebral disc. Spine. 1990;15(5):411–415. doi: 10.1097/00007632-199005000-00012. [DOI] [PubMed] [Google Scholar]
- 47.Urban JP, Maroudas A. Swelling of the intervertebral disc in vitro. Connect Tissue Res. 1981;9(1):1–10. doi: 10.3109/03008208109160234. [DOI] [PubMed] [Google Scholar]
- 48.Urban JP, Mcmullin JF. Swelling pressure of the intervertebral disc: influence of proteoglycan and collagen contents. Biorheology. 1985;22(2):145–157. doi: 10.3233/bir-1985-22205. [DOI] [PubMed] [Google Scholar]
- 49.van der Veen AJ, Mullender MG, Kingma I, van Dieen JH, Smit TH. Contribution of vertebral bodies endplates and intervertebral discs to the compression creep of spinal motion segments. J Biomech. 2008;41(6):1260–1268. doi: 10.1016/j.jbiomech.2008.01.010. [DOI] [PubMed] [Google Scholar]
- 50.van Loon R, Huyghe JM, Wijlaars MW, Baaijens FPT. 3D FE implementation of an incompressible quadriphasic mixture model. Int J Numer Methods Eng. 2003;57:1243–1258. [Google Scholar]
- 51.Wilson W, van Donkelaarm CC, Huyghe JM. A comparison between mechano-electrochemical and biphasic swelling theories for soft hydrated tissues. J Biomech Eng. 2005;127(1):158–165. doi: 10.1115/1.1835361. [DOI] [PubMed] [Google Scholar]
- 52.Yao H, Gu WY. Three-dimensional inhomogeneous triphasic finite-element analysis of physical signals and solute transport in human intervertebral disc under axial compression. J Biomech. 2007;40(9):2071–2077. doi: 10.1016/j.jbiomech.2006.10.001. [DOI] [PMC free article] [PubMed] [Google Scholar]