

Abstract
Spinal interneurons modulating motor output are highly diverse but surprisingly arise from just a few embryonic subgroups. The principles governing their development, diversification, and integration into spinal circuits are unknown. This study focuses on the differentiation of adult Renshaw cells (RCs) and Ia inhibitory interneurons (IaINs), two subclasses that respectively mediate recurrent and reciprocal inhibition of motoneurons from embryonic V1 interneurons (V1-INs). V1-INs originate from p1 progenitors and, after they become postmitotic, specifically express the transcription factor engrailed-1, a property that permits genetic labeling of V1 lineages from embryo to adult. RCs and IaINs are V1 derived, but differ in morphology, location, calcium-binding protein expression, synaptic connectivity, and function. These differences are already present in neonates, and in this study we show that their differentiation starts in the early embryo. Using 5′-bromodeoxyuridine birth dating we established that mouse V1-INs can be divided into early (E9.5-E10.5) and late (E11.5-E12.5) groups generated from the p1 domain (where E is embryonic day). The early group upregulates calbindin expression soon after becoming postmitotic and includes RCs, which express the transcription factor MafB during early differentiation and maintain calbindin expression throughout life. The late group includes IaINs, are calbindin-negative, and express FoxP2 at the start of differentiation. Moreover, developing RCs follow a characteristic circumferential migratory route that places them in unique relationship with motor axons with whom they later synaptically interact. We conclude that the fate of these V1-IN subclasses is determined before synaptogenesis and circuit formation by a process that includes differences in neurogenesis time, transcription factor expression, and migratory pathways.
Introduction
Complex interactions between many interneurons (INs) endow local circuits in the brain and spinal cord with significant computational power. Despite their relevance, there is little information about mechanisms that differentiate IN phenotypes and determine their connectivity and integration into local circuits during development. A remarkable example is the mammalian spinal cord locomotor circuit, which is responsible for sculpting motor outputs that select different muscle synergies according to movement speed and type. Mammals show great variety and flexibility of motor patterns, allowing them to accomplish many different tasks. Not surprisingly, there is a large diversity of spinal INs classified according to connectivity, function, neurochemical phenotype, and embryological origin (Jankowska, 1992; Kiehn, 2006; Goulding, 2009; Brownstone and Bui, 2010).
These diverse INs arise from just 10 progenitor cell types with restricted competences to generate unique groups of embryonic INs (dorsal dl1–6 and ventral V0–3 INs: Ericson et al., 1997; Goulding et al., 2002). Each of these canonical IN subtypes are conserved phylogenetically and share fundamental properties, such as location, axon primary direction, and neurochemical phenotype (Grillner and Jessell, 2009; Goulding, 2009). In zebrafish, there is a good correspondence between embryonic subtypes and mature categories of spinal INs (Fetcho and McLean, 2010); however, in the adult mammalian spinal cord there is a larger diversity. It has been proposed that this is the result of evolutionary pressures toward functional specialization during transition from swimming to terrestrial locomotion (Fetcho and Bhatt, 2004; Alvarez et al., 2005; Goulding, 2009; Grillner and Jessell, 2009). For example, embryonic V1 interneurons (V1-INs) generate one type of multifunctional IN in zebrafish and tadpoles (Higashijima et al., 2004; Li et al., 2004) but several more specialized subtypes in mammals (Sapir et al., 2004; Alvarez et al., 2005). Mammalian V1-derived INs include Renshaw cells (RCs) and some Ia inhibitory interneurons (IaINs) that share common core properties of V1 INs, like extending inhibitory ascending ipsilateral axons. Adult RCs and IaINs differ, however, in function and connectivity and are respectively responsible for establishing recurrent and reciprocal inhibitory circuits with motoneurons (Renshaw, 1946; Eccles et al., 1954, 1956).
The mechanism that diversifies embryonic subtypes into the variety of adult INs is an unresolved question. Embryonic V1-INs express the transcription factor engrailed-1 at the onset of postmitotic differentiation, and this has allowed development of animal models to label V1-lineages throughout development (Matise and Joyner, 1997; Saueressig et al., 1999; Sapir et al., 2004). In neonates, several subclasses of V1-derived INs, including RCs or IaINs, are recognizable according to morphology, connections, and expression of calcium-buffering proteins (Alvarez et al., 2005; Siembab et al., 2010). Moreover, reciprocal and recurrent inhibition can be functionally demonstrated in late embryos and neonates in mice (Sapir et al., 2004; Wang et al., 2008) and humans (Mc Donough et al., 2001). The advanced phenotypic and functional segregation of V1-INs in newborns implies an earlier embryological differentiation program. The purpose of this study was to determine when and by which mechanisms V1-INs differentiate and ultimately generate subtypes like RCs and IaINs.
Materials and Methods
Animal models
All animal procedures were carried out according to NIH guidelines and were approved by the Wright State University Animal Use Committee (Dayton, OH). Three animal models were used in this study to identify V1-interneurons in embryos or postnatally. Cre/lox recombination was used to express reporter genes (LacZ, YFP, and tdTomato) in cells derived from engrailed-1-expressing V1-INs (Sapir et al., 2004). Animals were obtained by crossing En1Cre/+ heterozygotes (Sapir et al., 2004) with three different reporter mouse lines: Tau-lox-STOP-lox-mEGFP-IRES-NLS-LacZ mice (Tau-mEGFP-LacZ; Hippenmeyer et al., 2005), Thy1-lox-STOP-lox-EYFP mouse line (Thy1-YFP; Feng et al., 2000; Buffelli et al., 2003), and CAG-Rosa26-lox-STOP-lox-tdTomato-WPRE (R26-tdTomato, The Jackson Laboratory stock number: 007908; B6;129S6-Gt(ROSA)26Sortm14(CAG-tdTomato)Hze/J). V1-IN labeling using the Tau-mEGFP-LacZ and Thy1-YFP reporter lines have been described previously (Siembab et al., 2010). In the R26-tdTomato line V1-INs were visualized “naked” (that is, without immunocytochemical amplification), and the number of V1-INs per ventral horn were similar to those obtained when using the Tau-mEGFP-LacZ line. These numbers are always higher than when using the Thy1-YFP reporter, because the known mosaicism of expression imposed by the Thy1 promoter region (Feng et al., 2000). Nevertheless, the particular Thy1 line used here (line 15; The Jackson Laboratory stock: 005630; B6.Cg-Tg(Thy1-EYFP)15Jrs/J) results in a large number of V1-INs labeled (∼75%; Siembab et al., 2010). In Tau-mEGFP-LacZ animals we only revealed the LacZ protein product β-galactosidase (β-gal), which is restricted to the nucleus by a nuclear localization signal. All animals were bred in the Wright State University animal facilities, and resulting litters were genotyped using standard tail PCR.
Timed pregnancies: hormonal treatment
Pregnancies were facilitated by hormonal injections in females, and mating time schedules were restricted to better determine embryonic ages. Pregnant mare serum gonadotropin (Calbiochem), was injected on day 1 to induce follicular development, and 48 h later human chorionic gonadotropin (CG-10, Sigma) was injected to induce ovulation. Both hormones were injected intraperitoneally (i.p.; 5.0 IU). The females were caged with the males 6 h after the last hormone injection and before the beginning of the dark period (8:00 P.M.) to ensure fertilization. The next morning (8:00 A.M.) vaginal plugs were checked. A positive plug was considered E0.5. However, since the exact time of mating is unknown this procedure has an approximate ± 12 h error. Moreover, within single litters embryos could differ by 6–12 h in development after staging based on external features (Atlas of Mouse Development; Kaufman, 2004).
Tissue preparation
Mice pups of different postnatal (P) ages (P0, P5, and P15) were anesthetized with Euthasol (2.0 μg/g i.p.) and perfused transcardially with 4% paraformaldehyde in 0.1 m phosphate buffer (PB). After perfusion, the spinal cords were dissected, postfixed in 4% paraformaldehyde overnight, and cryoprotected in 0.1 m PB, pH 7.4, with 30% sucrose and 0.01% sodium azide. Mouse embryos were extracted from similarly perfused pregnant mothers and fixed in toto overnight and then cryoprotected in 30% sucrose.
Bromodeoxyuridine birth-dating experiments
5-Bromo-2′-deoxyuridine (BrdU; Sigma-Aldrich) was injected i.p. at a dose of 60 mg/kg weight in timed pregnant females. NeuN labeling of P15 spinal cords in resulting litters indicated that the dose chosen for this study did not produce alterations in the size of the gray matter or cell numbers, suggesting normal spinal cord neurogenesis and morphogenesis (data not shown). The analyses reported were obtained from 11 pregnant females that were successfully injected at gestation days 9.5, 10.5, 11.5, 12, or 12.5 after crossing with appropriate males to generate in the litter animals that were either En1-Cre/Thy1-YFP or En1-Cre/Tau-mEGFP-LacZ. Fourteen En1-Cre/Tau-LacZ and 10 En1-Cre/Thy1-YFP animals from these pregnancies were raised until P15. We analyzed three animals per age in the En1-Cre/Tau-mEGFP-LacZ line [except for embryonic day (E) 12.5 in which two animals were analyzed] and two animals per age in the En1-Cre/Thy1-YFP. Further animals and pregnancies not included in the study were discarded because either they produced no BrdU labeling, or controls suggested errors in estimation of pregnancy dates (see next page, Controls).
Immunohistochemistry.
Fifty-micrometer-thick transverse spinal cord sections from P15 animals treated with BrdU in embryo were obtained in a freezing, sliding microtome from the upper (2 and 3) and lower (4 and 5) lumbar segments and processed free floating. LacZ expression in En1-Cre/Tau-LacZ animals was revealed with antibodies against β-galactosidase. The sections were quadruple immunostained for calbindin, parvalbumin, β-gal, and BrdU. Sections from En1-Cre/Thy1-YFP spinal cords were triple immunolabeled for calbindin, yellow fluorescent protein (YFP), and BrdU. Yellow fluorescent protein was detected using a cross-reacting antibody originally raised against green fluorescent protein (GFP). The primary antibodies used and their specificities are summarized in Table 1. Immunoreactive sites for β-gal were revealed with a biotinylated donkey anti-chicken antibody (1:100; Jackson ImmunoResearch) followed by Alexa Fluor 405-conjugated streptavidin (Invitrogen). All other immunoreactions were revealed with species-specific donkey-raised secondary antibodies coupled to appropriate fluorochromes (dilution, 1:100; Jackson ImmunoResearch). In preliminary experiments, we found that treatments to reveal BrdU immunoreactivity damage antigenicity for calbindin, parvalbumin, β-gal, and YFP, and therefore these immunostains were performed before BrdU immunostaining.
Table 1.
Details of antibodies used in this study
| Antibody name | Type | Host species | Dilution | Company | Specificitya |
|---|---|---|---|---|---|
| Calbindin D28K | Polyclonal | Rabbit | 1:500 | Swant, Bellinzona | No labeling in KO tissue |
| Parvalbumin | Monoclonal | Mouse | 1:500 | Chemicon | No labeling in KO tissue |
| β-gal | Polyclonal | Chicken | 1:1000 | Abcam | No labeling in animals with no reporter expression |
| GFP (cross-reacts with YFP) | Polyclonal | Chicken | 1:5000 | Aves Labs | No labeling in animals with no reporter expression |
| BrdU | Monoclonal | Rat | 1:5000 | Sigma Aldrich | No labeling in untreated animals |
| VGLUT1 | Polyclonal | Guinea pig | 1:5000 | Synaptic Systems | No labeling in KO tissue |
| MafB | Polyclonal | Goat | 1:200 | Santa Cruz Biotechnology | Single western blot band (per manufacturers data) |
| MafB | Polyclonal | Rabbit | 1:5000 | Sigma | Pattern matches Allen Brain Atlas of gene expression |
| FoxP2 | Polyclonal | Goat | 1:200 | Santa Cruz Biotechnology | Single western blot band (per manufacturers data) |
| NeuN | Monoclonal | Mouse | 1:1000 | Chemicon | Only antibody available (Kim et al., 2009) |
| Islet1 | Monoclonal | Mouse | 1:100/1:50 | Hybridoma Bank, Iowa City, IA | Only known embryonic spinal islet1 cells labeled |
| Tuj1 | Monoclonal | Mouse | 1:500 | Chemicon | Only present in early undifferentiated neurons, as expected |
aLabeling specificity was tested in knock-out tissues for calbindin, parvalbumin, and VGLUT1 antibodies or in tissue sections lacking non-native molecules like β-gal, YFP, and BrdU (data not shown). Immunoreactivity for the transcription factors MafB, Islet1, and FoxP2 was compared to in situ hybridization data and to previous reports using different antibodies (see text for references). There was a perfect match between reported distribution of cells expressing these transcription factors and our immunocytochemistry. NeuN labeling is the result of immunoreactivity for the monoclonal antibody A60 (Mullen et al., 1992), which was recently shown to specifically recognize the transcription factor Fox-3 in paraformaldehyde-fixed sections (Kim et al., 2009). The monoclonal antibody TuJ1 recognizes epitopes in exclusively class III β-tubulin isotypes. These are present in neurites of undifferentiated neurons, and here we used the immunoreactivity to mark the localization of ventral roots.
For BrdU immunolocalization the DNA was denatured with increasing concentrations (1–2N) of hydrochloric acid (HCl) at increasing temperatures (4°C to 37°C). The acid was neutralized at room temperature with borate buffer (0.1 m), and the sections were transferred to PBS and incubated overnight with a rat anti-BrdU monoclonal antibody (Table 1). BrdU immunoreactivity was revealed with cyanine 3 (Cy3)-coupled secondary antibodies (1:100; Jackson ImmunoResearch). After washing, the sections were mounted on slides and coverslipped with Vectashield (Vector Laboratories).
Analysis.
The sections were imaged “live” with a digital color camera (Microfire CCD, Optronics) coupled to an epifluorescence BX50 Olympus microscope and Neurolucida system (MicroBrightField) with a motorized stage (Ludl Electronics) and z-axis encoder. V1-INs with or without calbindin or parvalbumin that incorporated BrdU at each embryonic age were counted and their positions plotted on outlines of the spinal cord sections. To identify YFP-V1 INs receiving calbindin contacts (i.e., IaINs), we obtained higher resolution confocal images (at 10×, 20×, and 60×) using an Olympus FV100 system. Image confocal stacks were fed into Neurolucida for counting and plotting. We analyzed 10 ventral horns per animal in lower and upper lumbar levels. From the Neurolucida plots we estimated the following: (1) the percentage of V1 INs labeled with BrdU in Thy1-YFP and Tau-LacZ animals (n = 4–5 animals per age); (2) the percentage of calbindin- or parvalbumin-immunoreactive V1 INs that incorporated BrdU at each embryonic age in the Tau-LacZ line (n = 3 animals per age); and (3) the percentage of V1-derived RCs and IaINs with BrdU detected in the Thy1-YFP line (n = 2 animals per age). The data are presented as average percentages from the individual animal estimates if n ≥ 3 or by presenting the individual animal estimates (obtained from n = 10 ventral horns) when only 2 animals were analyzed. Averages were compared using one-way ANOVA, and pairwise comparisons were performed using post hoc Tukey tests (SigmaStat version 2.0, Jandel Scientific Software). Significance was set at p < 0.05.
Controls.
To confirm that BrdU injections were delivered at the correct times in pregnant females, we analyzed the dorsoventral distribution of BrdU labeling in different groups of choline acetyltransferase (ChAT)-immunoreactive neurons. The spinal cord at thoracic levels contains five groups of cholinergic neurons of known birth dates (Barber et al., 1984, 1991; Phelps et al., 1988, 1991). Thoracic spinal cord sections from all the animals used in the study and their littermates were immunolabeled with antibodies against ChAT (Table 1) and revealed with FITC-conjugated secondary antibodies (as described above) followed by BrdU immunolabeling. Litters in which BrdU was incorporated into the wrong cholinergic group according to the estimated time of injection were discarded.
Early postnatal and embryo analyses
Six En1-Cre/Thy1-YFP animals at P5 and five at P0, as well as three En1-Cre/Tau-LacZ P0 animals, were used to quantify transcription factor expression in early postnatal V1-INs. In addition, 12 timed pregnant females were used to generate litters containing En1-Cre/Tau-LacZ (four litters) and En1-Cre/R26-tdTomato (eight litters) for similar analyses in embryo. At the appropriate gestation times (E9.5–E12.5) the embryos were removed from pregnant females and fixed in toto as explained above. Postnatal and embryonic spinal cords were cut in a cryostat at 20 μm thickness and collected in subbed slides. Slides were stored at −20°C until processed. In addition we analyzed sections from En1-Cre/Thy1-YFP and En1-Cre/Tau-LacZ late embryos (E15.5, E17.5).
For transcription factor analyses the sections were triple or quadruple immunolabeled for different antibody combinations against YFP, β-gal, calbindin, VGLUT1, MafB, and FoxP2 (Table 1 for antibody details). tdTomato labeling was always visualized naked. For postnatal analyses 10 ventral horns were plotted in Neurolucida to investigate the localization and percentages of MafB and FoxP2-immunoreactive V1-INs. For these analyses a total of nine En1-Cre/Tau-LacZ embryos were used at three embryonic stages (E10.5, n = 2, from one litter; E11.5, n = 2, from one litter; E12.5, n = 5, from two litters) and 21 En1-Cre/R26-tdTomato embryos at five embryonic ages (E9.5, n = 3, from one litter; E10.5, n = 4, from two litters; E11.5, n = 7, from two litters; E12, n = 4, from two litters; and E12.5, n = 3, from one litter). For analyses of the embryonic locations of V1-INs and calbindin-IR neurons, we analyzed sections from E10.5 (n = 4 embryos from 2 litters), E11.5 (n = 7 embryos from 2 litters), E12 (n = 4 embryos from 2 litters), and E12.5 (n = 2 embryos from 1 litter) embryos that were immunoreacted with antibodies against calbindin combined with either islet-1 or Tuj1 monoclonal antibodies. Immunoreactive sites were revealed as described above and imaged with confocal microscopy and analyzed using Fluoview software (Olympus).
Figure composition
All images for presentation were obtained with an Olympus FV1000 confocal microscope and processed with Image pro Plus (version 7.0, Media Cybernetics) for optimization of image brightness and contrast. Figures were composed using CorelDraw (version 12.0) and graphs in Sigma Plot (version 9.0, Jandel Scientific Software).
Results
V1-derived interneurons can be divided into two groups according to the time they are generated
Time of neurogenesis is an important factor that produces neuronal diversity in many regions of the CNS (Cepko et al., 1996; Kimura et al., 2006; Butt et al., 2007; Rakic, 2009). We analyzed the time that V1 neurons exit the progenitor cell cycle and become postmitotic (i.e., their “birth dates”) by pulse-labeling embryos at different ages with a single injection of BrdU delivered to timed-pregnant females (Miller and Nowakowski, 1988; also see Materials and Methods). Analyses were carried out at P15, a postnatal time at which many phenotypic features of V1-derived subgroups are well established (Siembab et al., 2010).
Previous embryonic analyses suggested that V1-INs exit the progenitor zone and start to differentiate between embryonic days 9 and 12 (E9–E12) (Matise and Joyner, 1997; Saueressig et al., 1999). In preliminary experiments (data not shown) we confirmed that no V1-INs incorporated BrdU at E13 and E14; therefore, we pulse labeled with BrdU embryos at E9.5, E10.5, E11.5, E12, and E12.5. BrdU incorporation was analyzed in V1-INs identified in En1-Cre/Tau-mEGFP-LacZ and En1-Cre/Thy1-YFP animals (Fig. 1A,B). Overall, we confirmed, using BrdU, a ventrolateral to dorsomedial gradient in neuronal generation of spinal neurons similar to that described in previous studies of rodent and human spinal cords using [H3]thymidine birth dating (Nornes and Das, 1974, Nornes and Carry, 1978; Altman and Bayer, 2001). Motoneurons and many ventral and lateral INs were more frequently labeled with BrdU at E9.5 and E10.5 (Fig. 1A,E). At E11.5 and E12.0 (Fig. 1B) there are progressively fewer strongly labeled INs in the ventral horn and more in the dorsal horn. Neurons in the dorsal horn superficial laminae were primarily labeled at E12.5, and at this age very few cells were labeled in the ventral horn (Fig. 1F).
Figure 1.
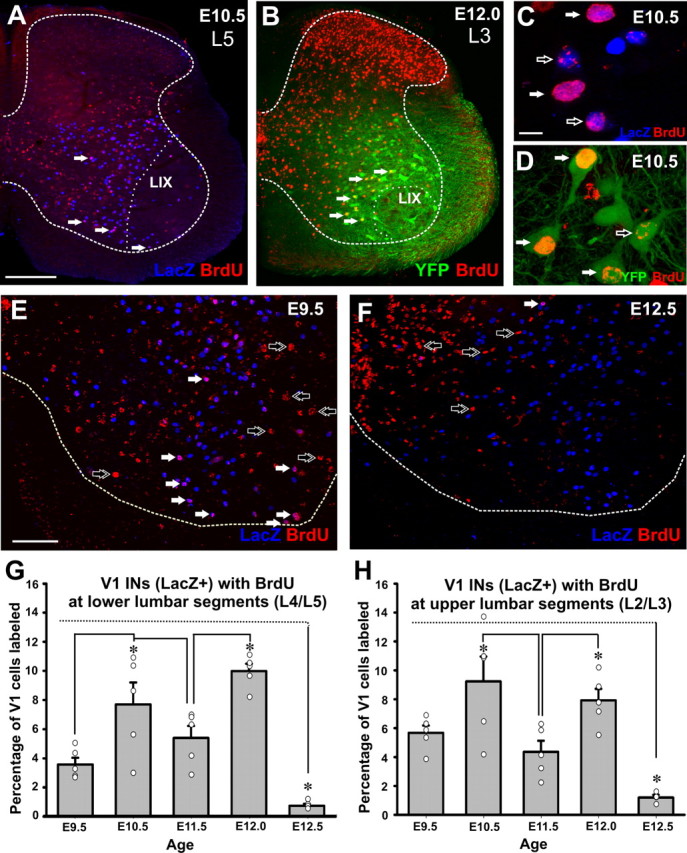
BrdU labeling of V1 interneurons. A, B, Low-magnification confocal images of lumbar spinal cord hemisections showing BrdU-IR (Cy3, red) and LacZ-positive V1-INs in En1-Cre/Tau-LacZ (A, blue, α-galactosidase-IR) or YFP-positive V1-INs in En1-Cre/Thy1-YFP (B, green) mice. A, Lower lumbar 5 (L5) section from a P15 animal pulse-labeled with BrDU at E9.5. B, Upper L3 section from a P15 animal treated with BrdU at E12.0. The borders between white and gray matter (dashed line) and lamina IX (LIX, dotted line) are indicated. Arrows indicate V1-INs labeled with BrdU. C, D, High-magnification confocal images of BrdU-IR in nuclei of V1 LacZ-positive cells (C, En1-Cre/Tau-lacZ animal) and V1 YFP-positive cells (D, En1-Cre/Thy1-YFP animal). LacZ is directed to the nucleus while YFP fills cell bodies, nuclei, dendrites, and axons. Solid white arrows indicate strongly BrdU-labeled nuclei and open arrows indicate weak labeling. E, F, P15 ventral horns with LacZ-positive V1-INs (blue) and BrdU incorporation (red) at E9.5 (E) and E12.5 (F). Dotted lines indicate the border between white and gray matter. Arrows show cells with strong BrdU incorporation; solid white arrows are V1-INs, double open arrows are non-V1 INs. Many large motoneuron nuclei are labeled at E9.5. G, H, Percentages of P15 V1-INs strongly labeled with BrdU at different embryonic ages. G, Analyses at lower lumbar 4 and 5 segments. H, Upper lumbar 2 and 3 segments. Data from En1-Cre/Tau-LacZ and En1-Cre/Thy1-YFP mouse lines were pooled together; n = 5 animals except for E12.5, where n = 4. Error bars indicate SEM. Individual animal values are superimposed as scatter plots (clear circles). Data from each animal were estimated from analyses of 10 ventral horns and an average of 1503 ± 231 (±SD) V1 INs per animal/lumbar region in En1-Cre/Tau-LacZ line and 1139 ± 119 (±SD) in En1-Cre/Thy1-YFP animals. The smaller number of genetically labeled cells in the En1-Cre/Thy1-YFP line corresponds with the known mosaicism of expression imposed by the Thy1 promoter (see Siembab et al., 2010). Percentages of BrdU-labeled cells were consistent between lines, and therefore the data from animals in both lines were pooled together. The results show two peaks of V1 generation at E10.5 and E12 in both upper and lower lumbar segments and very few cells incorporating BrdU at E12.5. ANOVA comparisons indicated significant differences among the ages (p < 0.001), and post hoc pairwise analyses (Tukey test) showed significant differences (p < 0.05) as indicated by asterisks. BrdU incorporation in V1-INs at E10.5 always shower higher variability than at the other ages and did not reach significance in upper lumbar segments compared to E9.5 (p = 0.1, Tukey's test). Scale bars: (in A) A, B, 200 μm; (in C) C, D, 10 μm; (in E) E, F, 100 μm.
BrdU-labeled neurons showed either strong or weak incorporation of BrdU in their cell nuclei (Fig. 1C,D). We defined strongly labeled neurons as those with labeling covering >50% of their nucleus and weakly labeled neurons as those with lesser amount of labeling, frequently just speckles. Strongly labeled INs were interpreted as those that exit the cell cycle immediately after incorporating BrdU in S phase. Weakly labeled neurons could be the result of late S-phase incorporation (Ferreira et al., 1997), BrdU dilution after one or more cycles of cell division and DNA replication or lowering concentrations of BrdU through body clearance (BrdU is metabolized by the liver with a half-life of 2 h in the adult animal). Finally, DNA repair events can also result in weak labeling (Taupin, 2007; Packard et al., 1973). Thus, weakly labeled neurons are open to several interpretations, and for this reason we analyzed only neurons with “strong” BrdU labeling. By these criteria, only a small percentage of V1-INs was counted at each stage (around 25% of the whole V1 population when adding all five ages analyzed). These small percentages are to be expected because of the brief period of availability of BrdU to dividing cells after a single injection (around 2 h). In contrast, when counting weakly labeled cells we obtained in excess of 100% of the population across all five ages, suggesting significant labeling overlaps between the ages (data not shown). Counting only strongly labeled cells after a single brief BrdU pulse thus permits greater accuracy, but also results in fewer cells labeled and higher variability during stages with rapid changes in the speed of cell generation.
To ensure that estimated pregnancy and embryonic timings for BrdU pulse labeling were accurate, we also analyzed BrdU labeling of different types of cholinergic neurons in the thoracic spinal cord of all the animals (i.e., carrying or not carrying genetically encoded V1 markers) generated in the litters used in the study (see Materials and Methods). Animals were included in the study only if they showed strong BrdU-labeled cholinergic neurons at thoracic levels (data not shown) in the relative proportions expected from the known birth dates for each subgroup of cholinergic neurons (Barber et al., 1984; Phelps et al., 1988). Also note that there is an unavoidable ±0.5 d variability in the estimation of embryonic times (see Materials and Methods). This variation needs to be taken into account when interpreting overlaps in generation times between different populations (see below).
We compared the proportions of V1-INs that contained strong BrdU labeling, not only at different embryonic times but also in upper lumbar (L2 and L3 segments) and lower lumbar regions (L4 and L5) because of the possibility of differences in the types of INs derived from the V1 group in different segments and the possibility of rostrocaudal differences in neuron generation times. The results suggest a biphasic generation of V1-INs in which significant peaks of V1 generation appear at E10.5 and E12 (Fig. 1G,H; p < 0.001 ANOVA; p < 0.05 post hoc Tukey test pairwise comparisons; n = 4–5 animals analyzed at each age). Based on results shown below, this pattern is best interpreted as an early phase of V1 neurogenesis starting at E9.5 and peaking at E10.5, and a second late phase that starts at E11.5 and peaks at E12. There was higher interanimal variability with injections delivered at E10.5 than at any other age. Very few V1-INs incorporated BrdU at E12.5. The timing of V1-IN generation was similar in both mouse lines and when comparing upper and lower lumbar segments.
In a previous report it was suggested that in zebrafish, excitatory V2a INs recruited during fast or slow locomotion are located at different dorsoventral positions in the spinal cord and are generated at different times (Kimura et al., 2006). To test the possibility that V1-INs generated at different times are segregated dorsoventrally, we created Neurolucida cell plots of the location of BrdU-labeled V1-INs in the thoracic spinal cord, a region that best preserves the original embryonic dorsoventral relations in the mature (P15) spinal cord (data not shown). The ventral horn was divided in five dorsoventral bins of 100 μm thickness each, and the numbers of V1-derived IN profiles containing strong BrdU in each dorsoventral bin were calculated. The most ventral V1-INs in the thoracic cord were generated only at the earliest embryonic time (E9.5), and >80% of the few V1-INs with strong BrdU incorporated at E12.5 were located in the more dorsal bin. At other dorsoventral bins and embryonic ages there was no clear or consistent dorsoventral localization pattern for V1-INs. In summary, although there is a tendency for ventral V1 INs to be generated early and dorsal V1-INs to be generated late, there was no strict dorsoventral positioning of V1-INs according to birth date in the mature spinal cord. Analyses in embryo shown below demonstrate substantial intermixing of early and late generated neurons, which is not the case for fish interneurons, which have limited migration capability. Thus, there is a greater disruption of positional orders according to birth date in the mouse spinal cord during embryonic development.
V1-derived interneurons expressing different calcium buffering proteins at P15 are generated at different embryonic times
V1-INs can be subdivided into various groups according to calbindin and parvalbumin expression (Alvarez et al., 2005; Siembab et al., 2010). In quadruple immunostained sections from En1-Cre/Tau-LacZ animals (Fig. 2A–D), the majority of V1-INs that express calbindin at P15 incorporated BrdU preferentially between E9.5 and E10.5 in both upper and lower lumbar levels (Fig. 2E,G–I). Three groups of calbindin-IR V1-INs were distinguished. Strongly immunoreactive small neurons located ventrally correspond with RCs (Fig. 2C,E; Alvarez and Fyffe, 2007). A second group consists of a few (1–3 cells per section) large calbindin-IR V1-INs located dorsally in LVII and present preferentially in upper lumbar 2 and 3 segments (Fig. 3C,G). Finally, a third group corresponds with small and weakly immunoreactive V1-INs scattered through the ventral horn at all lumbar levels (data not shown; see Alvarez et al., 2005). This latter group appears to correspond to the group that undergoes calbindin downregulation postnatally (see Siembab et al., 2010). V1-INs expressing only parvalbumin at P15 (some Renshaw cells express calbindin and parvalbumin at this age; see Alvarez et al., 2005) are located mostly in lateral lamina VII at all dorsoventral levels (Fig. 2D,F; see also Alvarez et al., 2005). They appear more heterogeneous and were not classified in discrete groups according to morphology and/or location. They are also generated in a broader temporal window. Few incorporated BrdU at E9.5 or E12.5, while most incorporated BrdU from E10.5 to E12 (Fig. 2H,I).
Figure 2.
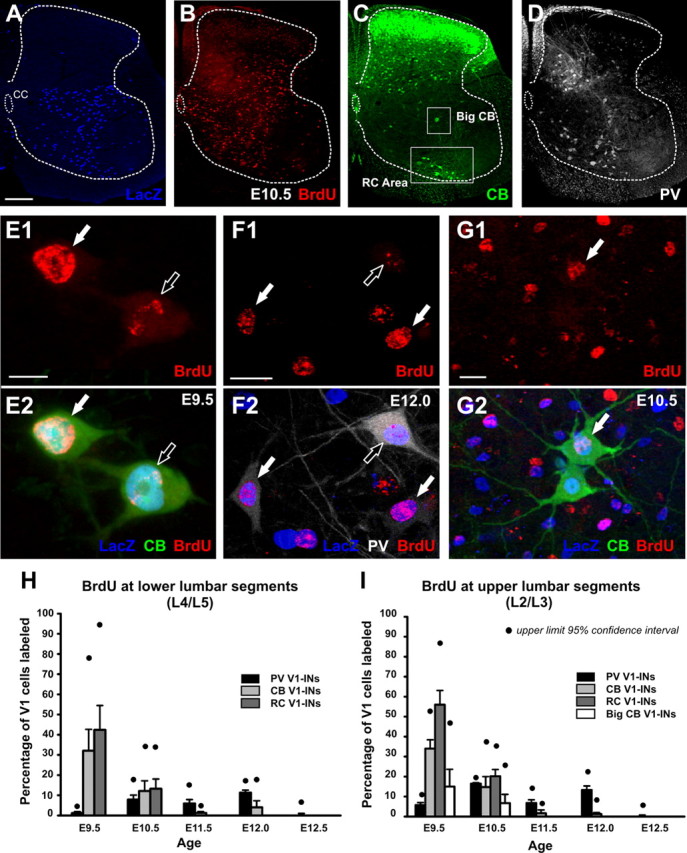
BrdU labeling in V1-derived interneurons expressing different calcium-binding proteins at P15. A–D, Low-magnification confocal images of a lumbar 4 spinal cord hemisection quadruple immunolabeled for β-gal (Alexa Fluor 405, blue, A), BrdU (Cy3, red; B), calbindin (CB; FITC, green; C), and parvalbumin (PV; Cy5, white; D). This particular animal was exposed to BrdU at E10.5. Ventrally located calbindin-IR V1-INs correspond with Renshaw cells (RC area, lower box in C). In addition, a few V1-derived calbindin-IR cells were located more dorsally and are different from Renshaw cells. These were divided into large and small cells according to soma size. Large V1 calbindin-IR cells (Big CB, upper box in C) were detected only in upper lumbar regions. Parvalbumin-IR cells are scattered throughout the ventral horn and present many different morphologies and sizes (D). The dotted lines delineate the borders between the white and gray matter. CC in A indicates the central canal position. E, G, High-magnification images of BrdU labeling in different types of V1-INs. E1, E2, E9.5 BrdU incorporation in calbindin-IR V1-derived Renshaw cells. In these and following image pairs, solid arrows indicate strong BrdU labeling; open arrows weakly labeled nuclei. F1, F2, E12 BrdU labeling in non-Renshaw parvalbumin-IR V1-INs. G1, G2, E10.5 BrdU incorporation in dorsal large calbindin-IR V1-INs. Only one of them (arrow) is strongly labeled with BrdU. H, I, Percentages of parvalbumin-IR V1-INs (non-Renshaw, black bars), all calbindin-IR V1-INs (light gray bars), calbindin-IR Renshaw cells (dark gray bars), and big calbindin-IR V1-INs (white bars, only in the upper lumbar segments) strongly labeled with BrdU at five different embryonic ages. Each bar represents the average from n = 3 En1-Cre/Tau-LacZ animals at each embryonic injection time except for E12.5, in which n = 2 animals. Error bars indicate SEM. Black circles indicate the 95% confidence limits. Note higher variability in the estimates for different subpopulations of calbindin-IR neurons compared to the parvalbumin group. Per animal, an average of 100.8 ± 22.7 (± SD) and 98.8 ± 27.5 (± SD) calbindin-IR V1-INs were tested for BrdU content in L4/5 and L2/3 sections, respectively. The numbers of parvalbumin V1-INs were, respectively, 81.8 ± 24.7 and 70.21 ± 32.4. Sixty to seventy percent of the calbindin-IR cells were Renshaw cells located in the ventral most region, and 5–6% correspond with big calbindin cells in upper lumbar L2/3 segments. Calbindin-IR V1 cells, including Renshaw cells and big calbindin-IR cells, were generated at E9.5 and E10.5. Few were generated at E11.5 and E12. The percentage of Renshaw cells that incorporated BrdU at E9.5 was significantly higher than at any other age in both upper and lower lumbar segments (p < 0.001 ANOVA followed by post hoc pairwise Tukey tests p < 0.05). Parvalbumin-IR V1 cells were mostly generated between E10.5 to E12 with very few incorporating BrdU at E9.5 and E12.5. E9.5 and E12.5 percentages of incorporation in parvalbumin V1-INs were significantly smaller than all other ages (p < 0.001 ANOVA followed by post hoc pairwise Tukey tests comparisons, p < 0.05). Significance is not indicated in the figure for simplicity. Scale bars: (in A) A–D, 200 μm; (in E1) E1, E2, 10 μm; (in F1, G1) F1–G2. 20 μm.
Figure 3.
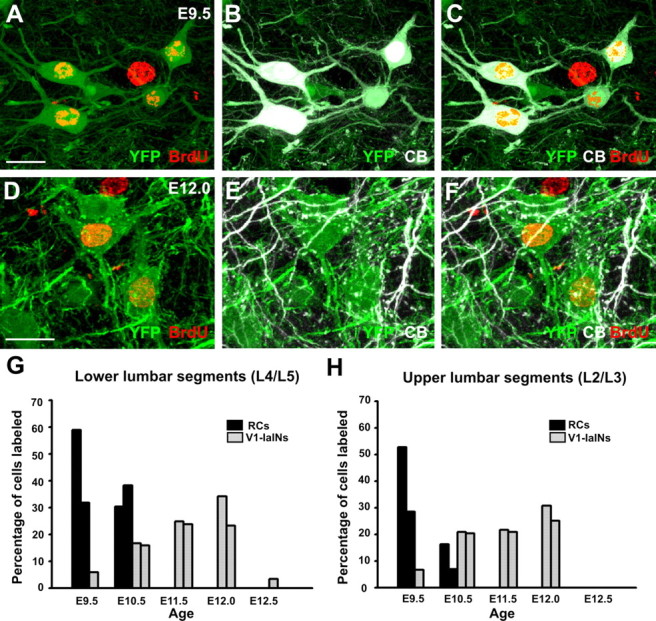
BrdU incorporation in Renshaw cells and V1-derived IaINs. A–C, High-magnification confocal images of V1 YFP (green in A–C) and calbindin-positive Renshaw cells (CB, white in B and C) showing generally strong BrdU labeling incorporated at E9.5 (red in A and C; because pure white masks red labeling, in C we added the red BrdU image on the YFP-CB, not just superimposed the three colors). The large nucleus of an unlabeled motoneuron in the middle of the image also incorporated BrdU at the same age. D–F, High-magnification confocal images of ventral spinal cord sections showing V1-derived IaINs (YFP green labeling in all three images) in a P15 animal injected with BrdU at E12.0 (BrdU is red in G and D). Superimposition of YFP and calbindin (E) shows IaINs surrounded by pericellular baskets of V1 calbindin-IR boutons (green and white). Only cells with dense pericellular baskets were sampled. G, H, Percentages of strongly BrdU-labeled Renshaw cells (black bars) and V1-derived IaINs (gray bars) in lower (G) and upper (H) lumbar segments. Each bar represents the average percentage calculated from an individual animal (calculated from 10 ventral horns each; 65.6 ± 17.1 and 56.0 ± 13.2 Renshaw cells and 28.7 ± 10.2 and 30.7 ± 5.4 V1-IaINs analyzed per animal in upper and lower lumbar segments, respectively). The results were consistent among the two animals studied at each age. Renshaw cells incorporated BrdU only after E9.5 or E10.5 injections. Increasingly more V1-derived IaINs incorporated BrdU at older embryonic ages, with a peak at E12. Almost no V1-IaINs were found with BrdU incorporation at E12.5. Scale bars: (in A, D) A–F, 20 μm.
The results shown in Figure 2 show greater variability in the percentage of calbindin-IR cells, including RCs, labeled by BrdU at E9.5 (and to a lesser extent at E10.5) compared to other groups. In addition to the unavoidable small number in these experiments (n = 3 animals per age and around 100 calbindin-IR V1 cells analyzed per animal; see Fig. 2 legend for sample details), there might also be a fundamental biological explanation for this larger variability. As suggested later by the embryo analyses, RCs cells and perhaps other groups within the early born population, appear to be generated during relatively short time windows. Given the error in estimating pregnancies (12 h; see Materials and Methods) and the brief availability of BrdU (2 h), small differences in the timing of injections would result in large differences in the number of labeled cells during periods in which generation of particular cell types rapidly changes. The results for RCs were confirmed in different animals in a following experiment.
In summary, calbindin-IR V1-INs constitute discrete subgroups of early generated V1-INs, while parvalbumin-IR V1-INs appear more heterogeneous and are usually generated later and through a wider period of neurogenesis.
V1-derived Ia inhibitory interneurons are generated at late embryonic ages
A subgroup of parvalbumin-IR V1-INs was previously identified as IaINs based on the presence of convergent inputs from calbindin-IR RC axons and parvalbumin/ VGLUT1-IR sensory proprioceptive axons (Alvarez et al., 2005; Siembab et al., 2010). The results described above suggest a late generation for V1-derived IaINs; however, parvalbumin expression alone does not define IaINs (Siembab et al., 2010). To directly analyze V1-derived IaINs, we selected V1 neurons receiving dense proximal innervations by V1-derived RCs (Siembab et al., 2010). To our knowledge, IaINs are the only ventral IN subtype known to receive significant projections from RCs (Jankowska, 1992). To identify IaINs according to synaptic inputs, we took advantage of the excellent depiction of somatodendritic surfaces and axons in En1-Cre/Thy1-YFP mice (Fig. 3A–F). V1-derived IaINs were identified in these animals as YFP-positive cells receiving a dense innervation on their somata and proximal dendrites from axons that were YFP (V1) and calbindin positive (V1-RCs). These cells are also contacted proximally by a high density of VGLUT1-IR proprioceptive synapses (see below and Siembab et al., 2010). As explained previously (Siembab et al., 2010), these criteria allow identification of an IN group that corresponds with IaINs, but we cannot estimate the exact percentage of IaINs detected because of the lack of other independent markers for this cell type.
In these sections we directly compared the amount of BrdU incorporation at different embryonic ages in V1-derived YFP-labeled RCs and in identifiable V1-derived YFP-positive IaINs in the same P15 ventral horns (Fig. 3G,H). Almost no V1-derived IaINs incorporated BrdU at E9.5 or E12.5 (n = 2 animals at each age; in Figure 3, G and H, each bar represents one animal; lack of bars indicates no cells found BrdU labeled; see figure legend for sample details). The numbers of V1-IaINs strongly labeled with BrdU increased from E10.5 to E11.5 and E12, being the maximum percentage detected at E12. The values were consistent between the two animals analyzed at each age. The early generation, larger variability in BrdU incorporation, and percentages of BrdU-labeled calbindin-IR V1 RCs described above were confirmed in these En1-Cre/Thy1-YFP animals.
In summary, RCs are generated in the first wave of neurogenesis from p1 progenitors, and IaINs are generated later. Larger variability in RC BrdU labeling compared to V1-IaINs suggests perhaps a narrower time window of neurogenesis.
Early V1-derived interneurons are distinguishable from later born interneurons by calbindin expression and their different positions and migration in early embryos
V1-INs leave the progenitor area as soon as the last cell cycle division is completed (Saueressig et al., 1999). This implies possible differences between early and late born V1-INs in available migratory routes and their interactions with elements of the developing neural tube. Moreover, the timing of expression of calcium binding proteins in different populations is unclear. Parvalbumin is upregulated postnatally in some V1-INs, but calbindin expression is robust in many neonatal V1-INs (Siembab et al. 2010), suggesting embryonic expression in more V1-INs than RCs. The types of V1-INs that express calbindin in embryo and the onset of its expression are unknown. To address these questions, we analyzed the localization of V1-INs and their calbindin content in early embryos (E9.5 to E12.5). First, we used the Thy1-YFP and Tau-LacZ reporter lines but did not consistently detect reporter expression in early embryos (data not shown). To optimize labeling, we used R26-tdTomato reporter mice (see Materials and Methods). In En1-Cre/R26-tdTomato mice V1-INs were not found at E9.5 (data not shown), but labeled cells were present at E10.5 (Fig. 4A). Given the ubiquitous activity of the CAG promoter and its location in the Rosa26 locus (which allows transcription from the earliest embryo stages: Soriano, 1999), it is unlikely that lack of reporter expression in the E9.5 spinal cord is due to inactivity of the promoter. Indeed, tdTomato labeling is clearly visible in engrailed-1-positive dorsal midbrain progenitors by E9.5 (data not shown). Furthermore, some tdTomato V1-INs were located in the intermediate zone (IZ) between the progenitor and mantle layers. Neurons located in the IZ represent newborn cells exiting the progenitor region and suggest upregulation of reporter expression soon after V1-INs become postmitotic. The differences in timing between the earliest BrdU incorporation (E9.5) and genetic labeling (E10.5) are, therefore, likely related to the time necessary for cells to transition from S-phase BrdU incorporation to last cell division and then to expression of engrailed-1, Cre recombination, and reporter expression. In V2 cells a 10 h delay was estimated between S-phase BrdU incorporation, translocation to the IZ, and upregulation of postmitotic transcription factors (Peng et al., 2007).
Figure 4.
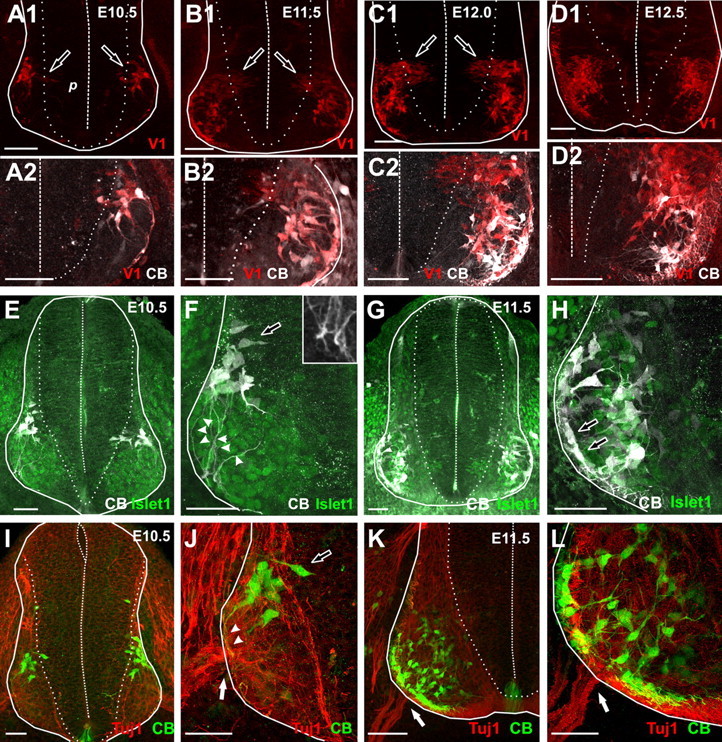
Location and calbindin immunoreactivity of early embryonic V1-INs. A–D, Confocal images of E10.5–E12.5 spinal cord cross sections showing tdTomato labeling of V1-INs (V1, red; A1–D1, low magnification; A2–D2, high magnification) and calbindin immunoreactivity (CB, white, Cy5; A2–D2). Solid lines indicate the boundaries of the early spinal cord. Dotted lines indicate the border between the ventricular progenitor area (p) and the mantle layer. Dashed line indicates the midline ventricle. A, E10.5 spinal cord. Few V1-INs are present in the neural tube. Most are located laterally and a few are leaving the progenitor area (arrows in A1). All V1-INs at this age express calbindin-IR (A2). B, E11.5 spinal cord. The numbers of V1-INs and calbindin-IR cells are increased and most are ventrolaterally located. Newly formed generated cells exiting the progenitor area (arrows in B1) are calbindin negative at this age (B2). C, E12 spinal cord. At this age there is a larger number of V1-INs exiting the progenitor area (C1), and these new V1-INs lack calbindin-IR (C2). More V1-INs are accumulated ventromedially, and these can be calbindin positive or negative (C2). D, E12.5 spinal cord. Very few or no V1-INs are exiting the progenitor area (D1) and the number of calbindin-negative V1-INs in the ventral horn has significantly increased. Many are located medial and dorsal to calbindin-IR V1 INs, but there is also significant intermixing (D2). E–H, Transverse sections of spinal cords from En1-Cre/R26-tdTomato embryos (tdTomato not shown) immunolabeled for calbindin (Cy5, white) and Islet1 (FITC, green). I–L, Similar sections from Cre-negative littermates immunolabeled for calbindin (FITC, green) and Tuj1 (Cy3 red). Islet 1 marks the position of motor pools; Tuj1 labels axonal microtubules in undifferentiated neurons including the exit region of motor axons (ventral roots; white arrows in J–L). E, I (low magnification) and F, J (high magnification) are E10.5. G, K and H, L are E11.5 respectively also at low and high magnifications. At E10.5 all calbindin-IR V1-INs are dorsal to Islet1-IR motoneuron pools (E, F). Calbindin-IR V1-INs exiting the progenitor area have mediolaterally oriented bipolar morphologies (open arrows in F and J). More lateral V1-INs located in the mantle layer have unipolar morphologies and send projections ventrally (arrowheads in F and J). These projections end in bulbs similar to growth cones (inset, F) and terminate close to the ventral root (I, J). At E11.5, the cells that were located dorsally at E10.5 have moved laterally around the motor pools and area, becoming positioned close to ventral roots. A second group of calbindin-IR V1-INs is located medial or intermingled with motoneurons. Scale bars: A1–D1, 100 μm; A2–L, 50 μm.
At E10.5 very few V1-INs were detected; these were all calbindin-immunoreactive and located close to the lateral surface of the embryonic neural tube in a narrow mid-dorsoventral plane dorsal to islet-1-positive motor pools (Fig. 4A,E,F), far from ventral roots labeled with Tuj1 antibodies (Fig. 4I,J). The most medial cells were in the IZ region emerging from the proliferative area and display the typical bipolar morphology of newly generated neurons. Interestingly, they already express calbindin at this stage (Fig. 4A,F,J). The more lateral cells are also calbindin positive and display a unipolar morphology characteristic of migrating cells after regressing their ventricularly directed neurites. They express higher levels of tdTomato compared to the more medial bipolar cells located in the IZ region, suggesting a medial to lateral progression in maturation. Many laterally located V1-INs send a neurite ventrally toward the ventral root exit (Fig. 4F,J). These neurites finish in end bulbs resembling the growth cones of spinal INs of similar age (Fig. 4F, inset; see Wentworth, 1984a).
The number of V1-INs increased at E11.5 and their area of distribution extended more ventrally, occupying positions both lateral and medial to islet-1 motor pools (Fig. 4B,G,H). At this age, most laterally located V1-INs are calbindin positive and likely correspond with earlier born V1-INs, while newborn V1 cells in the IZ now frequently lack calbindin. Within the more mature and lateral calbindin-IR V1 cells, one group lines the lateral border of the ventral horn and seems to correspond with V1-INs that were located dorsal to the motor pools at E10.5 (Fig. 4H). These cells appear to migrate following their ventrally directed neurites to settle in front of the ventral root (Fig. 4K,L). Cells following this lateral circumferential migratory route correspond to RC precursors and support the conclusion that RCs are the first born V1 cells that appear in the neural tube. A second group of calbindin-IR V1 cells is located medial to islet-1 motoneurons and display relatively mature multipolar morphologies, suggesting that they have stopped migrating and have settled medially and away from the RC region at the ventral root exit zone. Many of these V1 cells likely represent the weakly calbindin-IR V1-INs located in LVII dorsal to the RC area at postnatal day 1 (see Siembab et al., 2010, their Fig. 3). These cells fully downregulate calbindin expression later in development (Siembab et al., 2010) but share with RCs an early generation and embryonic calbindin expression. V1 calbindin-IR axons are first located in the ventral funiculus at E11.5 (Fig. 4H,L), but at this developmental stage do not yet send back synaptic collaterals into the motor pools.
At E12 large numbers of newborn V1-INs are added in tight packets of high cellular density located in the IZ; these cells never display calbindin immunoreactivity (Fig. 4C). Fewer newborn V1 cells are visible in the IZ at E12.5 (Fig. 4D). The number of non-calbindin-IR V1 cells increases from E12 to E12.5, and they become located medial and dorsal to calbindin-IR V1-INs (Fig. 4C,D). At later embryonic ages the ventral horn grows in size by the addition of more cells, and this generates morphogenetic transformations that intermix the populations of early and late born V1-INs (data not shown). In addition, the cellular growth of lamina IX motor pools relocates the ventral root more ventromedially, and along with them the clusters of developing RCs.
In summary, calbindin is a marker of early born V1-INs, and it is upregulated soon after the cells become postmitotic at the start of differentiation. Within this early group the very first V1-INs are RC precursors and follow a unique circumferential migration around motor pools that positions them among emerging motor axons. V1-INs in the IZ after E11.5 never express calbindin and initially become positioned medial and dorsal to motor pools and earlier generated calbindin-IR V1-INs. The tiled organization of early and late born V1-INs is later disrupted by histogenetic movements, while RCs retain a tight relationship with motor axons through spinal cord morphogenesis.
Renshaw cells and Ia inhibitory interneurons express different transcription factors in the postnatal spinal cord
In a previous preliminary study it was suggested that subpopulations of embryonic V1-INs could be differentiated based on the expression of the transcription factors MafB and FoxP2 (Geiman et al., 2007). In embryos, MafB was closely associated to RCs, while FoxP2 was present in unidentified V1-INs scattered more dorsally. Therefore, we analyzed here whether these transcription factors are respectively expressed in V1-derived RCs, and IaINs in the postnatal spinal cord. In preliminary analyses we found that MafB immunoreactivity was best detected at P0. In contrast, FoxP2 expression was similar at P0 and P5 but downregulates gradually during the second postnatal week. The analyses therefore focused at P0 (MafB) and P5 (FoxP2).
In the ventral horns of P0 spinal cords, MafB and FoxP2 are expressed in nonoverlapping V1-IN populations (Fig. 5A,B). Within V1-INs, MafB is present in 100% of ventral RCs (Fig. 5C–G) and also in two groups of scattered neurons that are calbindin negative at P0; one prominent group is located at the more dorsal distribution of the V1 group, the other consists of a few cells scattered ventromedially (Fig. 5A,B). Ventromedial cells express weaker MafB immunoreactivity. These groups contain fewer cells than the RC group. Overall, around 15% of V1-INs expressed MafB (9–10% of V1s are RCs and 5–6% are MafB-positive non-RCs). In addition, MafB is also widely expressed in non-V1s, particularly in the dorsal horn (Fig. 5C). In conclusion, MafB expression is not unique to RCs, but all RCs cells express this transcription factor at P0.
Figure 5.
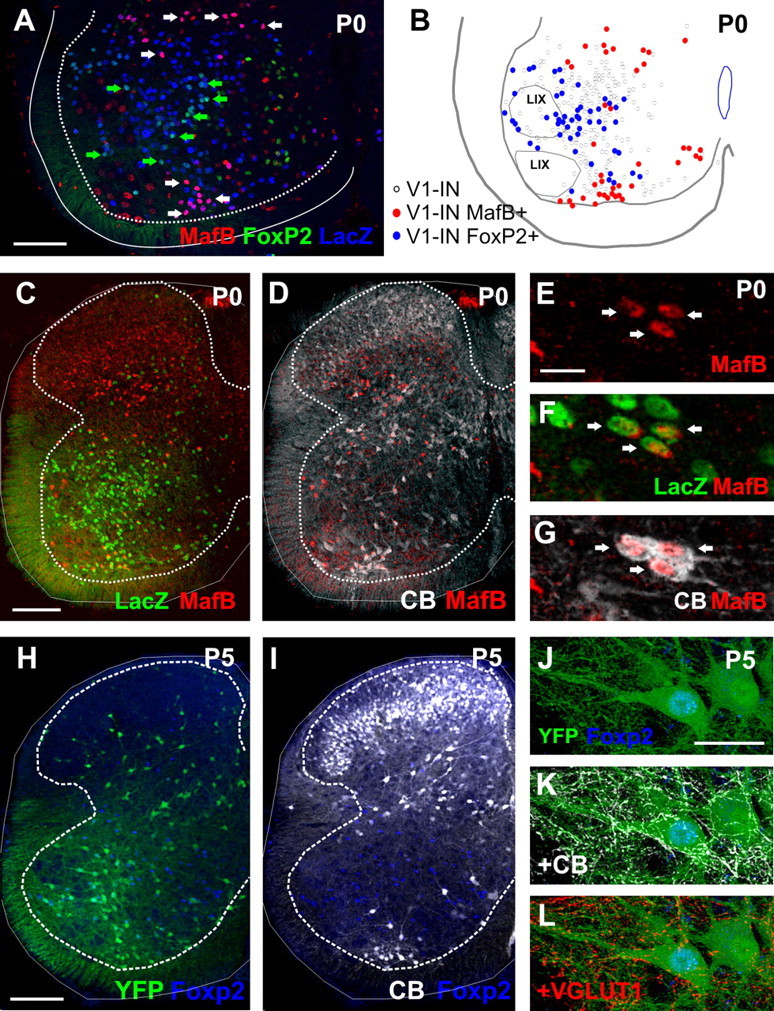
Expression of MafB and FoxP2 in postnatal V1-derived interneurons. A, Confocal image of a lumbar 5 spinal cord ventral horn showing triple immunolabeling for MafB (Cy3, red), FoxP2 (FITC, green), and LacZ-positive V1-INs (blue). White arrows indicate V1-INs containing high levels of MafB (thus appearing pink). Green arrows indicate V1-INs with high levels of FoxP2 (thus appearing as lighter blue). MafB and FoxP2 V1-INs are located in different regions and there is no colocalization between both subpopulations. B, Neurolucida plot of V1-INs classified according to MafB or FoxP2 expression. The positions of motor pools are indicated (LIX). C, D, Low-magnification confocal image from an En1-Cre/Tau-LacZ animal at P0 immunostained for MafB (Cy3, red; C, D), LacZ (FITC, green, C), and calbindin (Cy5, white, D; calbindin signals were lowered to allow visibility of the red marker). The ventral group of MafB-IR V1-INs is calbindin immunoreactive and coincides with Renshaw cells. E, G, High-magnification confocal images of P0 Renshaw cells (arrows) immunostained for MafB (Cy3, red), LacZ (FITC, green), and calbindin (Cy5, white). H, I, Low-magnification confocal images of lumbar spinal cord sections at P5 immunolabeled with FoxP2 (Alexa Fluor 405, blue; H, I), YFP (FITC, green; H), and calbindin (CB, Cy5, white; I). FoxP2-immunoreactive cells are for the most part localized to the ventral horn and some coincide with V1-INs, but these are never calbindin immunoreactive. J–L, High-magnification confocal images of a YFP (FITC, green) V1-IN immunostained for FoxP2 (Alexa Fluor 405, blue; J–L). This cell receives contacts from Renshaw cell axons that are both calbindin-immunoreactive (Cy5, white; K) and YFP-positive (J). It also receives contacts from VGLUT1 boutons (Cy3, red; L). This particular cell is therefore a V1-derived IaIN. Scale bars:in A, 200 μm; (in C, H) C, D, H, I, 100 μm; (in E, J) E–G, J–L, 20 μm.
FoxP2 is more widely expressed than MafB in the postnatal ventral horn, but fewer dorsal horn neurons express FoxP2. FoxP2 V1-INs are distributed at all dorsoventral locations, except in the Renshaw cell area and the dorsal most regions of the V1 distribution (Fig. 5A,B,H,I). Overall, FoxP2-immunoreactivity was found in 23% of LacZ and 33% of YFP V1-INs and in 66% of V1-derived IaINs identified in En1-Cre/Thy1-YFP animals by convergent inputs from calbindin-IR V1-derived RCs and VGLUT1-IR proprioceptors (Fig. 5J,L). One interpretation of these results is that only a subpopulation of V1-derived IaINs expresses FoxP2 or, alternatively, that by P5 FoxP2 immunoreactivity decreased to undetectable levels in about a third of V1-derived IaINs. Only 5% of the FoxP2 cells in the ventral horn of the spinal cord were identified as V1-derived IaINs at P5, but as pointed out above we cannot be sure about the numbers of IaINs we fail to identify by using these criteria, and therefore this percentage may be an underestimate. FoxP2 expression occurs also in many non-V1 INs; about 60% of all ventral horn FoxP2-IR cells were non-V1, and most of these were located medially in the ventral horn, away from V1 or IaIN typical locations.
In summary, in the postnatal spinal cord, MafB and FoxP2 are expressed in nonoverlapping subgroups of V1-INs and together account for ∼30–40% of all V1-INs (depending on animal model because of the slightly lower V1 labeling in En1-Cre/Thy1-YFP animals; see Materials and Methods and Siembab et al., 2010). Although not unique to RCs or IaINs, MafB is expressed in all RCs while FoxP2 is expressed in a substantial number of IaINs.
MafB and FoxP2 are upregulated in the embryonic spinal cord shortly after Renshaw cell and IaIN neurogenesis
Given the distinction of postnatal V1-INs according to transcription factor content, we analyzed transcription factor expression in the embryo to (1) study their relationships with early and late V1 populations and (2) confirm the time at which these two groups of V1-INs start to diverge from each other. Very weak or no MafB-immunoreactivity was found in RCs at E10.5 or in V1-INs located in the IZ (Fig. 6A,B), suggesting that upregulation of calbindin is more robust and perhaps earlier than MafB in newborn V1 cells. It is unlikely that this was caused by immunodetection failures, because many motoneurons expressed robust MafB at this age and the results were confirmed with two different MafB antibodies (Table 1) that give identical patterns of immunostaining in the embryonic spinal cord. Our immunolocalizations are also in agreement with previous in situ hybridization surveys and a mouse model that reports MafB expression (Eichmann et al., 1997; Hamada et al., 2003). In addition, we were able to detect MafB expression in dorsal horn INs as soon as they become postmitotic and move to the IZ (Fig. 6I, asterisk). MafB expression in calbindin-IR V1-INs was first reliably detected at E11.5 (Fig. 6E,F). At this age MafB is clearly present in migrating RCs located at the very lateral edge of the ventral horn, as well as in a few calbindin-negative V1-INs located more dorsally, but not in the more medial calbindin-IR V1-INs. At E12 and E12.5 MafB expression is robust in RCs and is downregulated in motoneurons (Fig. 6I,J,M,N).
Figure 6.
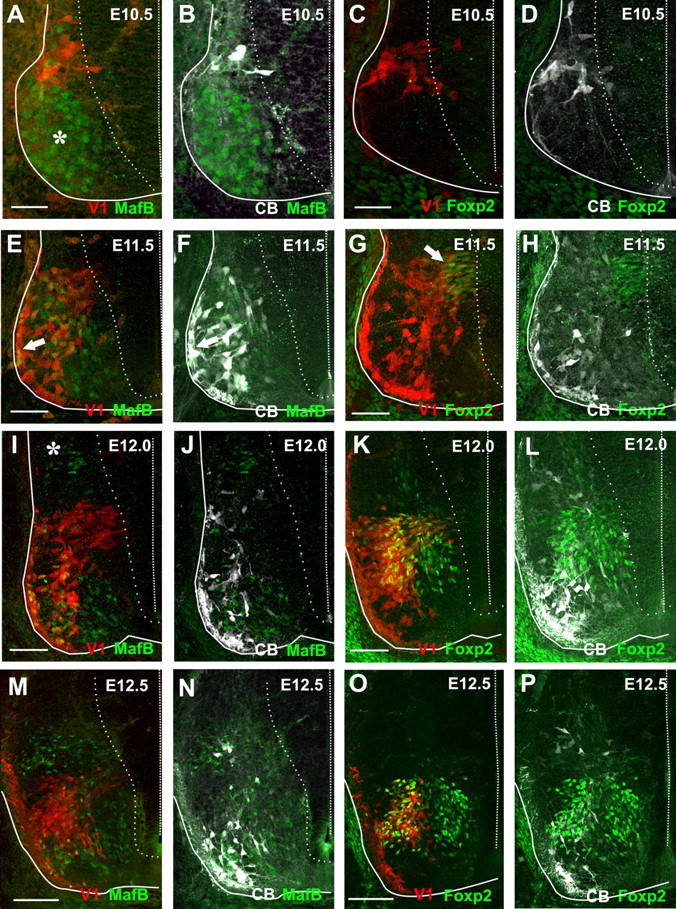
Expression of MafB and FoxP2 in V1-INs in early embryos. V1-INs are labeled in red in all panels (tdTomato), MafB- (A, B, E, F, I, J, M, and N) or FoxP2-immunoreactivities (C, D, G, H, K, L, O, and P) in green (FITC) and calbindin-IR in white (Cy5, B, D, F, H, J, L, N, and P). Solid lines delineate the embryonic spinal cord, while dashed lines mark the midline. Dotted lines indicate the edge of the progenitor area. A, B, The few calbindin-IR V1-INs present at E10.5 contain weak or no MafB expression. MafB expression is mostly present in motoneurons at this age (asterisk in A). C, D, No Foxp2 immunoreactivity is visible at E10.5. E, F, At E11.5 MafB expression is partially downregulated from motoneurons and it starts to be present in laterally located calbindin-IR V1-derived Renshaw cells (arrows). G, H, At E11.5 we can also first detect Foxp2 in V1-INs; these are mostly located exiting the progenitor area in the intermediate zone (arrow in G). None of these cells express calbindin (H). I, J, At E12.0 MafB expression is greatly downregulated from motoneurons and is present in most V1-derived Renshaw cells. A group of dorsal horn MafB-positive neurons exit the progenitor area at this age (asterisk in I). K, L, At E12.0 we detected FoxP2 in V1-INs leaving the progenitor area and also in V1-INs that have already migrated ventrally and display more complex morphologies. FoxP2 V1-INs are never calbindin positive (L). M, N, By E12.5 MafB is present in Renshaw cells, a few dorsally located V1-INs, and dorsal horn INs. O, P, At E12.5 Foxp2 is present in V1-INs located mostly dorsal and medial to calbindin-IR V1-INs. Scale bars: (in A, C, E, G) A--H, 50 μm; (in I, K, M, O), I–P, 100 μm.
FoxP2 immunoreactivity was not present in the E10.5 embryonic spinal cord (Fig. 6C,D) and was first detected at E11.5 in a group of packed V1-INs located in the IZ (Fig. 6G,H). Similar IZ newborn V1-INs expressing FoxP2 are found at E12 (Fig. 6K,L). At these ages, FoxP2 seems exclusively expressed by V1-INs in agreement with a recent detailed quantitative analysis (Morikawa et al., 2009). E12 and E12.5 contain increased numbers of FoxP2-expressing V1-INs located close to the motor pools (Fig. 6K,L,O,P). These cells never contained calbindin immunoreactivity, suggesting that each marker respectively identifies early and late born V1-INs. The presence of FoxP2 specifically in V1-INs that will later become IaINs could not be directly tested, because present criteria for IaIN identification are based on their synaptic connectivity, and synaptic connections are not established until later developmental times in mouse embryos. Renshaw cell calbindin-IR axons invade the ventral horn at E14–E15 (V. Siembab and F. J. Alvarez, unpublished observations), and Ia afferents synapse with ventral horn targets at later embryonic stages (E16-E17; Ladle et al., 2007). The properties of IaIN precursors before this age are unknown. The present studies suggest that FoxP2, perhaps in combination with other markers, may be useful to identify V1-IaINs throughout development.
In summary, FoxP2 expression is a feature of late born V1-INs and is upregulated in these cells as soon as they become postmitotic. In contrast, MafB is upregulated in RCs during their migration toward the ventral root. This observation confirms that these populations of V1-INs start to differentiate from each other shortly after they exit the cell cycle and before they settle into their final positions and start synaptogenesis.
Discussion
The results show that V1-INs can be divided into early and late generated groups and that each group respectively includes, but not exclusively, RCs and IaINs. The early V1 group is characterized by calbindin upregulation soon after they are generated. Within this group RCs are among the first generated, specifically express the transcription factor MafB, and follow a circumferential migration that places them close to motor axons. In contrast, IaINs belong to a group of V1-INs generated later and express FoxP2. FoxP2 expression appears more widespread in the embryo than postnatally. The proportion of V1-INs expressing FoxP2 increases from 18% at E11 to 59% at E12 (Morikawa et al., 2009), in agreement with the appearance of late V1-INs. But we found FoxP2 in fewer V1-INs at P0 and P5. A plausible interpretation is that FoxP2 is a generalized marker of late V1-INs, including IaINs, but by P0 it is downregulated in some cells.
Influence of time of neurogenesis on V1 subgroups
The results suggest that RCs are born first and are generated in a narrower time window than IaINs, implying that RCs constitute a more homogenous population produced by the first neurogenetic divisions of p1 progenitors. Temporal specification of phenotypes is not always the mechanism followed by ventral progenitors to generate diversity. For instance, the p2 domain generates excitatory V2a-INs and inhibitory V2b-INs through asymmetric divisions and Notch/Delta lateral signaling (Peng et al., 2007). Interestingly, V2a INs in zebrafish differentiate into one type of IN, excitatory circumferential ipsilateral descending (CiD) IN, which displays functional gradations according to time of neurogenesis. Early born V2a/CiDs are large, dorsally located, and active during stronger movements such as escape or fast swimming, while later born neurons are smaller, more ventrally located, and recruited during slower and weaker sustained swimming (Kimura et al., 2006; McLean and Fetcho, 2009). Mammalian V1-INs differ from this pattern, since RCs are generated first but are smaller and more ventrally located than later born IaINs. Moreover, V1-IN dorsoventral positions are only weakly related to generation times. The larger variety of INs generated by mammalian progenitor domains and more complex cellular intermixing obscures birth date gradations reflected in cell location. It is nonetheless interesting that mechanisms imposing positional and functional gradients within a class of zebrafish INs are used in mammals to generate distinct functional subtypes, in this case RCs and IaINs.
Differences in neurogenesis can promote diversity by several mechanisms. Fate may be determined cell autonomously depending on cell cycle number. This mechanism is akin to generation of diversity from Drosophila neuroblasts where progenitors modify their transcription factor complement after each division, influencing the fate of daughter cells produced in successive cycles (Isshiki et al., 2001). In the mammalian brain, single progenitors can sequentially generate different cell types by restricting their fate potential over time as demonstrated in retina (Cepko et al., 1996; Watanabe and Raff, 1990) and neocortical pyramidal cells (McConnell and Kaznowski, 1991). These changes are accompanied by temporal changes in transcription factor expression in progenitors (Leone et al., 2008). Similar changes can occur in ventral neural tube progenitors because of fluctuating levels of sonic hedgehog and retinoic acid during development (Maden, 2001; Ulloa and Briscoe, 2007), as shown for example in the pMN domain, resulting in a switch from motoneuron genesis to oligodendrogenesis (Soula et al., 2001; Zhou et al., 2001). The mechanisms operating in p1 progenitors are unknown, but it is intriguing that some regions of the p1 domain downregulate expression of the transcription factor Dbx1 at E10 (Pierani et al., 2001), after RC generation. Thus, changes in the p1 domain may not be induced exclusively by a progenitor time clock but also by a changing environment. At the extreme of this second interpretation, newborn cells might be induced to diversify by the environment into which they are born, independent of the status of the progenitors. These mechanisms are not exclusive, since changes in genetic determination could modify competences to respond to temporally regulated environmental influences.
One striking feature of developing RCs that seems dependent on their very early birth date is their unique migration toward motor axons in ventral roots. Migrating neurons are unipolar or asymmetrically bipolar (Wentworth, 1984a,b), reflecting cellular movements through extension of a leading neurite followed by nuclear translocation and retraction of trailing neurites (see Noctor et al., 2001; Bortone and Polleux, 2009). Thus, the neurites observed at E10.5 predict the cell body positions found at E11.5. This population of ventral root-directed V1-INs represent developing RCs, and this migratory pathway places them in a unique position to interact with motor axons. Despite evidence for other possible spinal INs that could be weakly linked to motor axons (Machacek and Hochman, 2006; O'Donovan et al., 2010), RCs remain the main intraspinal target of motor axons. Their specific circumferential migration route may be responsible for their strong relationship with motor axons and seems unavailable to later generated V1-INs. It is possible that developing RCs are endowed with specific chemotropism for ventral roots; for example, such long neurites directed toward ventral roots were not present in other V1-INs. Alternatively, all V1-INs could be attracted to the ventral root but stop medial to motor pools that may act as a barrier for IN migration. This could explain the paucity of INs in adult lamina IX. Their position medial to motoneurons places these other V1-INs in a prime location to receive inputs from Ia afferent axons that will later invade lamina IX in the same ventrolateral direction. These conclusions extend previous studies that concluded that the early migration of ventral INs (Leber and Sanes, 1995) and V1-INs (Matise and Joyner, 1997) consists in a common route of mediolateral translocation to the surface followed by ventral migration, settling medial to motor pools. By identifying various embryonic subpopulations of V1-INs, we propose that migratory routes differ. RCs follow a specific route and settle lateral, not medial, to motoneurons.
Early differential gene expression
The early differentiation of V1-IN populations is reflected not only in their migration but also in differences in transcription factor expression. MafB and FoxP2 are upregulated shortly after cellular birth. MafB upregulates in RCs during cell migration; FoxP2 is upregulated in late-generated V1-INs as they exit the progenitor zone. Moreover, early-generated V1-INs differ from FoxP2 V1-INs by the early upregulation of calbindin expression. These observations suggest that the differentiation of early and late V1-INs and their subgroups (RCs within the early group) starts at the time of birth (i.e., there is no homogeneous V1 population in the early embryo that later diversifies). Thus, time of neurogenesis is immediately translated into different V1 phenotypes, ruling out integration into synaptic circuits as a major factor determining V1-IN diversity. In fact, the final location of different groups of V1-INs in the embryonic spinal cord predicts some of their major inputs (see above). The assembly of all properties necessary for adult IN function is, however, a sequential process (for review, see Alvarez and Fyffe, 2007), and some properties may arise or be refined later by mechanisms dependent on circuit formation and activity (see for example gephyrin clustering in RCs; Geiman et al., 2000; Gonzalez-Forero et al., 2005). RC properties like calbindin expression and localization among motor axons appear to be primary properties that appear before synaptic connections form.
The results, however, also suggest that neither FoxP2 nor MafB can be regarded as exclusive of V1-INs, IaINs, or RCs in the spinal cord. Thus, it is unlikely that these transcription factors alone control differentiation of these INs. It is more plausible that transcription factor combinations, expressed either simultaneously or sequentially, are responsible for their differentiation, as occurs during motoneuron subtype specification (Jessell, 2000; Price and Briscoe, 2004). Similarly, motor abnormalities observed in MafB and FoxP2 knock-out animals cannot be ascribed solely to V1-IN dysfunction. MafB is involved, among other functions, in development of the medullar respiratory pre-Bötzinger complex, and knock-outs die at birth from respiratory failure (Blanchi et al., 2003). FoxP2 is also widely expressed in brain, and knock-out mice display an underdeveloped cerebellum, dying around P21 (Shu et al., 2001, 2005). Future experiments using conditional alleles (see French et al., 2007) will be necessary to define the exact roles of FoxP2 and MafB in V1-INs. At present, these two transcription factors can now be used for identification of RCs and late-born cells within the V1 group.
In conclusion, our study shows some of the processes that diversify V1-INs (summarized in Fig. 7). V1-INs can be divided into early- and late-generated subpopulations expressing different markers. Moreover, RCs and IaINs, respectively, belong to each of these groups. Thus, the results support the idea that RCs and IaINs differentiate from each other in early embryo, the determinants being time of birth, transcription factor expression, and migration. Synaptic connections form later using sets of predetermined INs strategically positioned to receive specific kinds of inputs.
Figure 7.
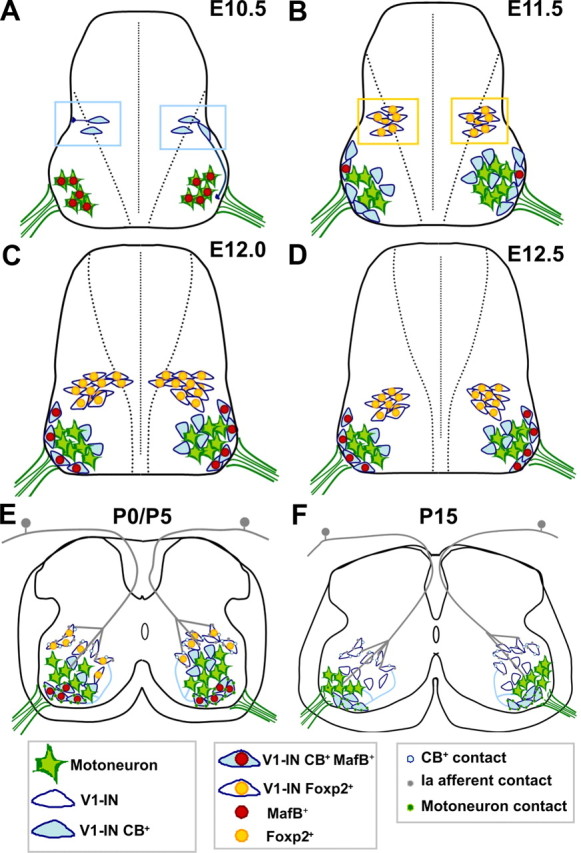
Summary of Renshaw cell and V1-derived IaIN differentiation. A, At lumbar levels, V1-INs first exit the progenitor area at E10.5, upregulate immediately calbindin expression, and most appear to be Renshaw cell precursors. These cells first migrate laterally and are located dorsal to motoneurons. Once at this lateral position they extend ventral projections toward the ventral root. These ventral projections usually follow a circumferential path around motor pools at the lateral edge of the spinal cord. At this age MafB is largely expressed in motoneurons. FoxP2 is not expressed at E10.5 by any cell in the spinal cord. B, At E11.5, differentiating Renshaw cells migrate ventrally and position themselves at the motor axon exit region. At this age MafB expression is upregulated in Renshaw cells and downregulated in motoneurons. Other calbindin-IR V1-INs are located more medially to motoneurons, and these cells lack MafB. They likely develop into phenotypes other than Renshaw cells. Finally, new V1-INs exit the progenitor area at this age; these are calbindin negative and express FoxP2. Some of these “later born” V1 cells will differentiate into V1-derived IaINs. C, At E12 a large number of FoxP2-positive V1-INs are added and migrate ventrally. MafB is now expressed by all Renshaw cells. D, At E12.5 there are no more V1-INs added, and FoxP2-expressing V1-INs become located dorsal and medial to calbindin-IR V1-INs. E, During the first postnatal week, MafB and FoxP2 start to downregulate from V1-INs. At P0/P5 MafB is present in calbindin-IR V1-derived Renshaw cells that receive strong synaptic input from motor axons. These cells send projections back to motoneurons and also to other V1-INs more dorsally located. Until P5, FoxP2 expression remains in many dorsal V1-INs. Some receive convergent inputs from Ia afferents and Renshaw cells and can be defined as V1-derived IaINs. Ia afferents have invaded the ventral horn at late embryonic ages, and in their trajectory toward the motor pools they contact many V1-INs. F, At P15, Renshaw cells and V1-derived IaINs are fully matured.
Note added in proof.
A parallel study showing similar early generation of Renshaw cells from p1 progenitors and a specific transcription factor pathway leading to MafB expression in these cells has recently been published: Stam FJ, Hendricks TJ, Zhang J, Geiman EJ, Francius C, Labosky PA, Clotman F, Goulding M (2012) Renshaw cell interneuron specialization is controlled by a temporally restricted transcription factor program. Development 139:179–190.
Footnotes
This work was supported by NIH Grant NS047357 to F.J.A. We thank specially Maria Berrocal for her invaluable contribution generating the animals used in this study and troubleshooting many of the techniques at the start of this project. Special thanks to Dr. Martyn Goulding (Salk Institute) who provided us with the En1cre/+ animals used here and was a continuous source of input during the development of this study. We also want to acknowledge Dr. Silvia Arber (Biozentrum, University of Basel, Switzerland) and Dr. Robert Brownstone (Dalhousie University, Halifax, Nova Scotia) for sharing with us different strains of reporter mice from their colonies. We also like to thank Drs. Thomas Jessell and Jay B. Bikoff (Columbia University, New York, NY) for their discussions on this project and data sharing. Finally, we thank Dr. Ronald Griffith for comments on the manuscript.
References
- Altman J, Bayer SA. Development of the human spinal cord. Oxford: Oxford UP; 2001. [Google Scholar]
- Alvarez FJ, Fyffe RE. The continuing case for the Renshaw cell. J Physiol. 2007;584:31–45. doi: 10.1113/jphysiol.2007.136200. [DOI] [PMC free article] [PubMed] [Google Scholar]
- Alvarez FJ, Jonas PC, Sapir T, Hartley R, Berrocal MC, Geiman EJ, Todd AJ, Goulding M. Postnatal phenotype and localization of spinal cord V1 derived interneurons. J Comp Neurol. 2005;493:177–192. doi: 10.1002/cne.20711. [DOI] [PMC free article] [PubMed] [Google Scholar]
- Barber RP, Phelps PE, Houser CR, Crawford GD, Salvaterra PM, Vaughn JE. The morphology and distribution of neurons containing choline acetyltransferase in the adult rat spinal cord: an immunocytochemical study. J Comp Neurol. 1984;229:329–346. doi: 10.1002/cne.902290305. [DOI] [PubMed] [Google Scholar]
- Barber RP, Phelps PE, Vaughn JE. Generation patterns of immunocytochemically identified cholinergic neurons at autonomic levels of the rat spinal cord. J Comp Neurol. 1991;311:509–519. doi: 10.1002/cne.903110406. [DOI] [PubMed] [Google Scholar]
- Blanchi B, Kelly LM, Viemari JC, Lafon I, Burnet H, Bévengut M, Tillmanns S, Daniel L, Graf T, Hilaire G, Sieweke MH. MafB deficiency causes defective respiratory rhythmogenesis and fatal central apnea at birth. Nat Neurosci. 2003;6:1091–1100. doi: 10.1038/nn1129. [DOI] [PubMed] [Google Scholar]
- Bortone D, Polleux F. KCC2 expression promotes the termination of cortical interneuron migration in a voltage-sensitive calcium-dependent manner. Neuron. 2009;62:53–71. doi: 10.1016/j.neuron.2009.01.034. [DOI] [PMC free article] [PubMed] [Google Scholar]
- Brownstone RM, Bui TV. Spinal interneurons providing input to the final common path during locomotion. Prog Brain Res. 2010;187:81–95. doi: 10.1016/B978-0-444-53613-6.00006-X. [DOI] [PMC free article] [PubMed] [Google Scholar]
- Buffelli M, Burgess RW, Feng G, Lobe CG, Lichtman JW, Sanes JR. Genetic evidence that relative synaptic efficacy biases the outcome of synaptic competition. Nature. 2003;424:430–434. doi: 10.1038/nature01844. [DOI] [PubMed] [Google Scholar]
- Butt SJ, Cobos I, Golden J, Kessaris N, Pachnis V, Anderson S. Transcriptional regulation of cortical interneuron development. J Neurosci. 2007;27:11847–11850. doi: 10.1523/JNEUROSCI.3525-07.2007. [DOI] [PMC free article] [PubMed] [Google Scholar]
- Cepko CL, Austin CP, Yang X, Alexiades M, Ezzeddine D. Cell fate determination in the vertebrate retina. Proc Natl Acad Sci U S A. 1996;93:589–595. doi: 10.1073/pnas.93.2.589. [DOI] [PMC free article] [PubMed] [Google Scholar]
- Eccles JC, Fatt P, Koketsu K. Cholinergic and inhibitory synapses in a pathway from motor-axon collaterals to motoneurones. J Physiol. 1954;126:524–562. doi: 10.1113/jphysiol.1954.sp005226. [DOI] [PMC free article] [PubMed] [Google Scholar]
- Eccles JC, Fatt P, Landgren S. The inhibitory pathway to motoneurones. Prog Neurobiol. 1956;2:72–82. [PubMed] [Google Scholar]
- Eichmann A, Grapin-Botton A, Kelly L, Graf T, Le Douarin NM, Sieweke M. The expression pattern of the mafB/kr gene in birds and mice reveals that the kreisler phenotype does not represent a null mutant. Mech Dev. 1997;65:111–122. doi: 10.1016/s0925-4773(97)00063-4. [DOI] [PubMed] [Google Scholar]
- Ericson J, Rashbass P, Schedl A, Brenner-Morton S, Kawakami A, van Heyningen V, Jessell TM, Briscoe J. Pax6 controls progenitor cell identity and neuronal fate in response to graded Shh signaling. Cell. 1997;90:169–180. doi: 10.1016/s0092-8674(00)80323-2. [DOI] [PubMed] [Google Scholar]
- Feng G, Mellor RH, Bernstein M, Keller-Peck C, Nguyen QT, Wallace M, Nerbonne JM, Lichtman JW, Sanes JR. Imaging neuronal subsets in transgenic mice expressing multiple spectral variants of GFP. Neuron. 2000;28:41–51. doi: 10.1016/s0896-6273(00)00084-2. [DOI] [PubMed] [Google Scholar]
- Ferreira J, Paolella G, Ramos C, Lamond AI. Spatial organization of large-scale chromatin domains in the nucleus: a magnified view of single chromosome territories. J Cell Biol. 1997;139:1597–1610. doi: 10.1083/jcb.139.7.1597. [DOI] [PMC free article] [PubMed] [Google Scholar]
- Fetcho JR, Bhatt DH. Genes and photons: new avenues into the neuronal basis of behavior. Curr Opin Neurobiol. 2004;14:707–714. doi: 10.1016/j.conb.2004.10.008. [DOI] [PubMed] [Google Scholar]
- Fetcho JR, McLean DL. Some principles of organization of spinal neurons underlying locomotion in zebrafish and their implications. Ann NY Acad Sci. 2010;1198:94–104. doi: 10.1111/j.1749-6632.2010.05539.x. [DOI] [PMC free article] [PubMed] [Google Scholar]
- French CA, Groszer M, Preece C, Coupe AM, Rajewsky K, Fisher SE. Generation of mice with a conditional Foxp2 null allele. Genesis. 2007;45:440–446. doi: 10.1002/dvg.20305. [DOI] [PMC free article] [PubMed] [Google Scholar]
- Geiman EJ, Knox MC, Alvarez FJ. Postnatal maturation of gephyrin/glycine receptor clusters on developing Renshaw cells. J Comp Neurol. 2000;426:130–142. doi: 10.1002/1096-9861(20001009)426:1<130::aid-cne9>3.0.co;2-7. [DOI] [PubMed] [Google Scholar]
- Geiman EJ, Gray PA, Goulding MD. FoxP2 and MafB subdivide ventral interneuron populations in the developing spinal cord. Soc Neurosci Abstr. 2007;33:670.2. [Google Scholar]
- Gonzalez-Forero D, Pastor AM, Geiman EJ, Benítez-Temiño B, Alvarez FJ. Regulation of gephyrin cluster size and inhibitory synaptic currents on Renshaw cells by motor axon excitatory inputs. J Neurosci. 2005;25:417–429. doi: 10.1523/JNEUROSCI.3725-04.2005. [DOI] [PMC free article] [PubMed] [Google Scholar]
- Goulding M. Circuits controlling vertebrate locomotion: moving in a new direction. Nat Rev Neurosci. 2009;10:507–518. doi: 10.1038/nrn2608. [DOI] [PMC free article] [PubMed] [Google Scholar]
- Goulding M, Lanuza G, Sapir T, Narayan S. The formation of sensorimotor circuits. Curr Opin Neurobiol. 2002;12:508–515. doi: 10.1016/s0959-4388(02)00371-9. [DOI] [PubMed] [Google Scholar]
- Grillner S, Jessell TM. Measured motion: searching for simplicity in spinal locomotor networks. Curr Opin Neurobiol. 2009;19:572–586. doi: 10.1016/j.conb.2009.10.011. [DOI] [PMC free article] [PubMed] [Google Scholar]
- Hamada M, Moriguchi T, Yokomizo T, Morito N, Zhang C, Takahashi S. The mouse mafB 5′-upstream fragment directs gene expression in myelomonocytic cells, differentiated macrophages and the ventral spinal cord in transgenic mice. J Biochem. 2003;134:203–210. doi: 10.1093/jb/mvg130. [DOI] [PubMed] [Google Scholar]
- Higashijima S, Masino MA, Mandel G, Fetcho JR. Engrailed-1 expression marks a primitive class of inhibitory spinal interneuron. J Neurosci. 2004;24:5827–5839. doi: 10.1523/JNEUROSCI.5342-03.2004. [DOI] [PMC free article] [PubMed] [Google Scholar]
- Hippenmeyer S, Vrieseling E, Sigrist M, Portmann T, Laengle C, Ladle DR, Arber S. A developmental switch in the response of DRG neurons to ETS transcription factor signaling. PLoS Biol. 2005;3:e159. doi: 10.1371/journal.pbio.0030159. [DOI] [PMC free article] [PubMed] [Google Scholar]
- Isshiki T, Pearson B, Holbrook S, Doe CQ. Drosophila neuroblasts sequentially express transcription factors which specify the temporal identity of their neuronal progeny. Cell. 2001;106:511–521. doi: 10.1016/s0092-8674(01)00465-2. [DOI] [PubMed] [Google Scholar]
- Jankowska E. Interneuronal relay in spinal pathways from proprioceptors. Prog Neurobiol. 1992;38:335–378. doi: 10.1016/0301-0082(92)90024-9. [DOI] [PubMed] [Google Scholar]
- Jessell TM. Neuronal specification in the spinal cord: inductive signals and transcriptional codes. Nat Rev Genet. 2000;1:20–29. doi: 10.1038/35049541. [DOI] [PubMed] [Google Scholar]
- Kaufman MH. Atlas of mouse development. Ed 6. London: Elsevier Academic; 2004. [Google Scholar]
- Kiehn O. Locomotor circuits in the mammalian spinal cord. Annu Rev Neurosci. 2006;29:279–306. doi: 10.1146/annurev.neuro.29.051605.112910. [DOI] [PubMed] [Google Scholar]
- Kim KK, Adelstein RS, Kawamoto S. Identification of neuronal nuclei (NeuN) as Fox-3, a new member of the Fox-1 gene family of splicing factors. J Biol Chem. 2009;284:31052–31061. doi: 10.1074/jbc.M109.052969. [DOI] [PMC free article] [PubMed] [Google Scholar]
- Kimura Y, Okamura Y, Higashijima S. alx, a zebrafish homolog of Chx10, marks ipsilateral descending excitatory interneurons that participate in the regulation of spinal locomotor circuits. J Neurosci. 2006;26:5684–5697. doi: 10.1523/JNEUROSCI.4993-05.2006. [DOI] [PMC free article] [PubMed] [Google Scholar]
- Ladle DR, Pecho-Vrieseling E, Arber S. Assembly of motor circuits in the spinal cord: driven to function by genetic and experience-dependent mechanisms. Neuron. 2007;56:270–283. doi: 10.1016/j.neuron.2007.09.026. [DOI] [PubMed] [Google Scholar]
- Leber SM, Sanes JR. Migratory paths of neurons and glia in the embryonic chick spinal cord. J Neurosci. 1995;15:1236–1248. doi: 10.1523/JNEUROSCI.15-02-01236.1995. [DOI] [PMC free article] [PubMed] [Google Scholar]
- Leone DP, Srinivasan K, Chen B, Alcamo E, McConnell SK. The determination of projection neuron identity in the developing cerebral cortex. Curr Opin Neurobiol. 2008;18:28–35. doi: 10.1016/j.conb.2008.05.006. [DOI] [PMC free article] [PubMed] [Google Scholar]
- Li WC, Higashijima S, Parry DM, Roberts A, Soffe SR. Primitive roles for inhibitory interneurons in developing frog spinal cord. J Neurosci. 2004;24:5840–5848. doi: 10.1523/JNEUROSCI.1633-04.2004. [DOI] [PMC free article] [PubMed] [Google Scholar]
- Machacek DW, Hochman S. Noradrenaline unmasks novel self-reinforcing motor circuits within the mammalian spinal cord. J Neurosci. 2006;26:5920–5928. doi: 10.1523/JNEUROSCI.4623-05.2006. [DOI] [PMC free article] [PubMed] [Google Scholar]
- Maden M. Role and distribution of retinoic acid during CNS development. Int Rev Cytol. 2001;209:1–77. doi: 10.1016/s0074-7696(01)09010-6. [DOI] [PubMed] [Google Scholar]
- Matise MP, Joyner AL. Expression patterns of developmental control genes in normal and Engrailed-1 mutant mouse spinal cord reveal early diversity in developing interneurons. J Neurosci. 1997;17:7805–7816. doi: 10.1523/JNEUROSCI.17-20-07805.1997. [DOI] [PMC free article] [PubMed] [Google Scholar]
- McConnell SK, Kaznowski CE. Cell cycle dependence of laminar determination in developing neocortex. Science. 1991;254:282–285. doi: 10.1126/science.254.5029.282. [DOI] [PubMed] [Google Scholar]
- Mc Donough SM, Clowry GJ, Miller S, Eyre JA. Reciprocal and Renshaw (recurrent) inhibition are functional in man at birth. Brain Res. 2001;899:66–81. doi: 10.1016/s0006-8993(01)02151-5. [DOI] [PubMed] [Google Scholar]
- McLean DL, Fetcho JR. Spinal interneurons differentiate sequentially from those driving the fastest swimming movements in larval zebrafish to those driving the slowest ones. J Neurosci. 2009;29:13566–13577. doi: 10.1523/JNEUROSCI.3277-09.2009. [DOI] [PMC free article] [PubMed] [Google Scholar]
- Miller MW, Nowakowski RS. Use of bromodeoxyuridine-immunohistochemistry to examine the proliferation, migration and time of origin of cells in the central nervous system. Brain Res. 1988;457:44–52. doi: 10.1016/0006-8993(88)90055-8. [DOI] [PubMed] [Google Scholar]
- Morikawa Y, Hisaoka T, Senba E. Characterization of Foxp2-expressing cells in the developing spinal cord. Neuroscience. 2009;162:1150–1162. doi: 10.1016/j.neuroscience.2009.05.022. [DOI] [PubMed] [Google Scholar]
- Mullen RJ, Buck CR, Smith AM. NeuN, a neuronal specific nuclear protein in vertebrates. Development. 1992;116:201–211. doi: 10.1242/dev.116.1.201. [DOI] [PubMed] [Google Scholar]
- Noctor SC, Flint AC, Weissman TA, Dammerman RS, Kriegstein AR. Neurons derived from radial glial cells establish radial units in neocortex. Nature. 2001;409:714–720. doi: 10.1038/35055553. [DOI] [PubMed] [Google Scholar]
- Nornes HO, Carry M. Neurogenesis in spinal cord of mouse: an autoradiographic analysis. Brain Res. 1978;159:1–6. doi: 10.1016/0006-8993(78)90105-1. [DOI] [PubMed] [Google Scholar]
- Nornes HO, Das GD. Temporal pattern of neurogenesis in spinal cord of rat. I. An autoradiographic study–time and sites of origin and migration and settling patterns of neuroblasts. Brain Res. 1974;73:121–138. doi: 10.1016/0006-8993(74)91011-7. [DOI] [PubMed] [Google Scholar]
- O'Donovan MJ, Bonnot A, Mentis GZ, Chub N, Pujala A, Alvarez FJ. Mechanisms of excitation of spinal networks by stimulation of the ventral roots. Ann N Y Acad Sci. 2010;1198:63–71. doi: 10.1111/j.1749-6632.2010.05535.x. [DOI] [PMC free article] [PubMed] [Google Scholar]
- Packard DS, Jr, Menzies RA, Skalko RG. Incorportaiton of thymidine and its analogue, bromodeoxyuridine, into embryos and maternal tissues of the mouse. Differentiation. 1973;1:397–404. doi: 10.1111/j.1432-0436.1973.tb00137.x. [DOI] [PubMed] [Google Scholar]
- Peng CY, Yajima H, Burns CE, Zon LI, Sisodia SS, Pfaff SL, Sharma K. Notch and MAML signaling drives Scl-dependent interneuron diversity in the spinal cord. Neuron. 2007;53:813–827. doi: 10.1016/j.neuron.2007.02.019. [DOI] [PMC free article] [PubMed] [Google Scholar]
- Phelps PE, Barber RP, Vaughn JE. Generation patterns of four groups of cholinergic neurons in rat cervical spinal cord: a combined tritiated thymidine autoradiographic and choline acetyltransferase immunocytochemical study. J Comp Neurol. 1988;273:459–472. doi: 10.1002/cne.902730403. [DOI] [PubMed] [Google Scholar]
- Phelps PE, Barber RP, Vaughn JE. Embryonic development of choline acetyltransferase in thoracic spinal motor neurons: somatic and autonomic neurons may be derived from a common cellular group. J Comp Neurol. 1991;307:77–86. doi: 10.1002/cne.903070108. [DOI] [PubMed] [Google Scholar]
- Pierani A, Moran-Rivard L, Sunshine MJ, Littman DR, Goulding M, Jessell TM. Control of interneuron fate in the developing spinal cord by the progenitor homeodomain protein Dbx1. Neuron. 2001;29:367–384. doi: 10.1016/s0896-6273(01)00212-4. [DOI] [PubMed] [Google Scholar]
- Price SR, Briscoe J. The generation and diversification of spinal motor neurons: signals and responses. Mech Dev. 2004;121:1103–1115. doi: 10.1016/j.mod.2004.04.019. [DOI] [PubMed] [Google Scholar]
- Rakic P. Evolution of the neocortex: a perspective from developmental biology. Nat Rev Neurosci. 2009;10:724–735. doi: 10.1038/nrn2719. [DOI] [PMC free article] [PubMed] [Google Scholar]
- Renshaw B. Central effects of centripetal impulses in axons of spinal ventral roots. J Neurophysiol. 1946;9:191–204. doi: 10.1152/jn.1946.9.3.191. [DOI] [PubMed] [Google Scholar]
- Sapir T, Geiman EJ, Wang Z, Velasquez T, Mitsui S, Yoshihara Y, Frank E, Alvarez FJ, Goulding M. Pax6 and engrailed 1 regulate two distinct aspects of renshaw cell development. J Neurosci. 2004;24:1255–1264. doi: 10.1523/JNEUROSCI.3187-03.2004. [DOI] [PMC free article] [PubMed] [Google Scholar]
- Saueressig H, Burrill J, Goulding M. Engrailed-1 and netrin-1 regulate axon pathfinding by association interneurons that project to motor neurons. Development. 1999;126:4201–4212. doi: 10.1242/dev.126.19.4201. [DOI] [PubMed] [Google Scholar]
- Shu W, Yang H, Zhang L, Lu MM, Morrisey EE. Characterization of a new subfamily of winged-helix/forkhead (Fox) genes that are expressed in the lung and act as transcriptional repressors. J Biol Chem. 2001;276:27488–27497. doi: 10.1074/jbc.M100636200. [DOI] [PubMed] [Google Scholar]
- Shu W, Cho JY, Jiang Y, Zhang M, Weisz D, Elder GA, Schmeidler J, De Gasperi R, Sosa MA, Rabidou D, Santucci AC, Perl D, Morrisey E, Buxbaum JD. Altered ultrasonic vocalization in mice with a disruption in the Foxp2 gene. Proc Natl Acad Sci U S A. 2005;102:9643–9648. doi: 10.1073/pnas.0503739102. [DOI] [PMC free article] [PubMed] [Google Scholar]
- Siembab VC, Smith CA, Zagoraiou L, Berrocal MC, Mentis GZ, Alvarez FJ. Target selection of proprioceptive and motor axon synapses on neonatal V1-derived Ia inhibitory interneurons and Renshaw cells. J Comp Neurol. 2010;518:4675–4701. doi: 10.1002/cne.22441. [DOI] [PMC free article] [PubMed] [Google Scholar]
- Soriano P. Generalized lacZ expression with the ROSA26 Cre reporter strain. Nat Genet. 1999;21:70–71. doi: 10.1038/5007. [DOI] [PubMed] [Google Scholar]
- Soula C, Danesin C, Kan P, Grob M, Poncet C, Cochard P. Distinct sites of origin of oligodendrocytes and somatic motoneurons in the chick spinal cord: oligodendrocytes arise from Nkx2.2-expressing progenitors by a Shh-dependent mechanism. Development. 2001;128:1369–1379. doi: 10.1242/dev.128.8.1369. [DOI] [PubMed] [Google Scholar]
- Taupin P. BrdU immunohistochemistry for studying adult neurogenesis: paradigms, pitfalls, limitations, and validation. Brain Res Rev. 2007;53:198–214. doi: 10.1016/j.brainresrev.2006.08.002. [DOI] [PubMed] [Google Scholar]
- Ulloa F, Briscoe J. Morphogens and the control of cell proliferation and patterning in the spinal cord. Cell Cycle. 2007;6:2640–2649. doi: 10.4161/cc.6.21.4822. [DOI] [PubMed] [Google Scholar]
- Wang Z, Li L, Goulding M, Frank E. Early postnatal development of reciprocal Ia inhibition in the murine spinal cord. J Neurophysiol. 2008;100:185–196. doi: 10.1152/jn.90354.2008. [DOI] [PMC free article] [PubMed] [Google Scholar]
- Watanabe T, Raff MC. Rod photoreceptor development in vitro: intrinsic properties of proliferating neuroepithelial cells change as development proceeds in the rat retina. Neuron. 1990;4:461–467. doi: 10.1016/0896-6273(90)90058-n. [DOI] [PubMed] [Google Scholar]
- Wentworth LE. The development of the cervical spinal cord of the mouse embryo. II. A Golgi analysis of sensory, commissural, and association cell differentiation. J Comp Neurol. 1984a;222:96–115. doi: 10.1002/cne.902220109. [DOI] [PubMed] [Google Scholar]
- Wentworth LE. The development of the cervical spinal cord of the mouse embryo. I. A Golgi analysis of ventral root neuron differentiation. J Comp Neurol. 1984b;222:81–95. doi: 10.1002/cne.902220108. [DOI] [PubMed] [Google Scholar]
- Zhou Q, Choi G, Anderson DJ. The bHLH transcription factor Olig2 promotes oligodendrocyte differentiation in collaboration with Nkx2.2. Neuron. 2001;31:791–807. doi: 10.1016/s0896-6273(01)00414-7. [DOI] [PubMed] [Google Scholar]