

Abstract
Physiological dependence and associated withdrawal episodes are thought to constitute a motivational force that sustains ethanol (alcohol) use/abuse and may contribute to relapse in alcoholics. Although no animal model duplicates alcoholism, models for specific factors, like the withdrawal syndrome, are useful for identifying potential genetic and neural determinants of liability in humans. We generated congenic mice that confirm a quantitative trait locus (QTL) on chromosome 4 with a large effect on predisposition to alcohol withdrawal. Using c-Fos expression as a high-resolution marker of neuronal activation, congenic mice demonstrated significantly less neuronal activity associated with ethanol withdrawal than background strain mice in the substantia nigra pars reticulata (SNr), subthalamic nucleus (STN), rostromedial lateral globus pallidus, and ventral pallidum. Notably, neuronal activation in subregions of the basal ganglia associated with limbic function was more intense than in subregions associated with sensorimotor function. Bilateral lesions of caudolateral SNr attenuated withdrawal severity after acute and repeated ethanol exposures, whereas rostrolateral SNr and STN lesions did not reduce ethanol withdrawal severity. Caudolateral SNr lesions did not affect pentylenetetrazol-enhanced convulsions. Our results suggest that this QTL impacts ethanol withdrawal via basal ganglia circuitry associated with limbic function and that the caudolateral SNr plays a critical role. These are the first analyses to elucidate circuitry by which a confirmed addiction-relevant QTL influences behavior. This mouse QTL is syntenic with human chromosome 9p. Given the growing body of evidence that a gene(s) on chromosome 9p influences alcoholism, our results can facilitate human research on alcohol dependence and withdrawal.
Keywords: seizure, c-Fos, substantia nigra, lesion, Mpdz, MUPP1
Introduction
Alcoholism and alcohol (ethanol) abuse affect up to 30% of Americans (Hasin et al., 2007) and are among the most highly heritable addictive disorders (Goldman et al., 2005). Withdrawal is a hallmark of alcohol physiological dependence and constitutes a motivational force that perpetuates alcohol use/abuse and contributes to relapse (Little et al., 2005). Unfortunately, because of its complexity, the circuitry underlying genetic differences in risk for alcohol dependence/withdrawal remain mostly unknown, hindering effective treatment and prevention.
Although no animal model duplicates clinically defined alcoholism, models for specific factors, including the withdrawal syndrome, are useful for identifying potential genetic and neural determinants of liability in humans. The aim of this study was to elucidate neural circuitry associated with ethanol withdrawal and impacted by a quantitative trait locus (QTL) on chromosome 4 (Alcw2) with a substantial effect on ethanol withdrawal in mice (Buck et al., 1997; Shirley et al., 2004). Notably, Alcw2 is syntenic with human chromosome 9p, and at least four studies identify 9p markers associated with alcoholism (Long et al., 1998; Williams et al., 2005) (D. Goldman and C. Ehlers, personal communication). c-Fos is a high-resolution histological marker of neuronal stimulation (Morgan et al., 1987; Herdegen and Leah, 1998) and identifies a distinct activation pattern associated with ethanol withdrawal (Dave et al., 1990; Morgan et al., 1992; Wilce et al., 1994; Knapp et al., 1998; Kozell et al., 2005; Borlikova et al., 2006). Lesion studies also indicate the involvement of specific brain regions in ethanol withdrawal (Kostowski and Trzaskowska, 1980; Chakravarty and Faingold, 1998; Ripley et al., 2004). The integration of c-Fos expression studies and focused lesions is a powerful approach to identify circuitry involved in complex phenotypes (Choi et al., 2007; Squire and Bayley, 2007) but has not previously been used to define neural systems recruited in the process of ethanol physiological dependence and withdrawal.
Previous analyses identified brain regions that differ between standard inbred strains in c-Fos expression associated with ethanol withdrawal (Kozell et al., 2005). Because of the near elimination of genetic “noise” from loci elsewhere in the genome, comparisons of congenic and background strains are invaluable to isolate a QTL on a uniform genetic background to address its influence on neural activity and identify brain regions potentially involved in mediating its impact on behavior. To dissociate the influence of Alcw2 from that of other ethanol withdrawal QTLs elsewhere in the genome (Buck et al., 1997, 2002), we compared the pattern of neuronal activation associated with withdrawal in Alcw2 congenic [possessing Alcw2 from the C57BL/6J (B6) donor strain superimposed on a genetic background that is >98% DBA/2J (D2) strain] and background strains. This congenic displays less severe withdrawal than background strain animals (Fehr et al., 2002). Additionally, we assessed the impact on ethanol withdrawal of focused lesions of brain regions that exhibit markedly different neuronal activation between congenic and background strains. Finally, because Alcw2 status may be correlated with seizure response to pentylenetetrazol (PTZ) (Fehr et al., 2004), we compared substantia nigra pars reticulata (SNr)- and sham-lesioned animals for pentylenetetrazol-enhanced convulsions.
Materials and Methods
Animals.
All of the animals used in this study were bred in our colony in the Department of Comparative Medicine at Oregon Health & Science University. D2 inbred strain breeders were purchased from the Jackson Laboratory. The D2.B6-Alcw2 congenic (with the Alcw2 interval from the B6 donor strain introgressed onto a D2 background) was developed in our laboratory (Fehr et al., 2002) [ISCS1 (interval-specific congenic strain 1)]. Mice were group-housed 2–5/cage by strain and sex. Mouse chow (#5001; Purina) and water were available ad libitum. Procedure and colony rooms were kept at a temperature of 21 ± 1°C. Lights were on in the colony from 6:00 A.M. to 6:00 P.M., and behavioral testing was initiated between 7:00 A.M. and 9:00 A.M. All procedures were approved by the Oregon Health & Science University and Veterans Affairs Medical Center Care and Use Committees in accordance with United States Department of Agriculture and United States Public Health Service guidelines. A total of 40 adult (60–90 d old) naive congenic and D2 mice were used for the c-Fos immunohistochemical analyses. An additional 174 D2 mice were used for the lesion analyses and were 60–70 d old at the time of surgery.
c-Fos immunohistochemistry.
c-Fos immunostaining was performed as described previously (Kozell et al., 2005). Notably, the congenic and background strain mice were not tested for ethanol withdrawal convulsions to avoid potential confounds of evoked convulsions on c-Fos immunoreactivity. Briefly, mice were administered a sedative-hypnotic dose of ethanol (4 g/kg, 20% v/v in saline, i.p.) or an equivalent volume of vehicle (sterile 0.9% saline) and then returned to their home cage and left undisturbed for 7 h. This time was selected based on previous work showing that acute ethanol withdrawal becomes apparent beginning ∼4 h postethanol and peaks ∼6–7 h postethanol exposure in D2.B6-Alcw2 congenic and background strain mice (Fehr et al., 2002). The mice were killed by cervical dislocation, and the brain was removed and placed in ice-cold 4% paraformaldehyde in 0.1 m phosphate buffer (PB) overnight. The following day, the 4% paraformaldehyde solution was replaced with 0.1 m PB containing 30% sucrose until the brain no longer floated and was processed for immunohistochemical analysis. Brains were coronally sectioned (30 μm) on a freezing microtome, and the tissue was stored in 10 mm PB containing 0.02% sodium azide until processing. Within an experiment, all of the experimental groups were processed at the same time. The sections were first rinsed three times in 10 mm PB before being incubated in 1.5% hydrogen peroxide in 10 mm PBS for 15 min to block endogenous peroxidase activity and then washed six times in 10 mm PBS. Sections were blocked for 2 h in immunoreaction buffer (10 mm PBS containing 0.25% Triton X-100 and 5% dry milk) without antibody; and rabbit anti-c-Fos antibody (1:10,000; Oncogene Science) was then added, and the incubation was continued for 72 h at 4°C. The sections were rinsed three times in 10 mm PBS and incubated with biotinylated goat anti-rabbit IgG (1:200; Vector Laboratories) in 10 mm PBS. The sections were subsequently incubated with horseradish peroxidase avidin–biotin complex in 10 mm PBS for 1.5 h at room temperature (ABC Elite peroxidase kit; Vector Laboratories). The sections were rinsed three times in 10 mm PBS and placed in 0.05 m Tris, pH 7.4, for 5 min. The chromatic reaction was completed with diaminobenzidine (50 mg/100 ml of 0.05 m Tris, Sigma-Aldrich) in the presence of 0.01% nickel ammonium sulfate solution and 0.035% hydrogen peroxide. Omission of the primary antibody to the sections was used as a staining control. The sections were mounted onto slides, dehydrated, and coverslipped in Permount (Thermo Fisher Scientific).
For quantitative morphometric analysis of c-Fos-positive cells, an Olympus BX60 light microscope and Leica DFC 480 imaging system were used to obtain a permanent record of cell distribution. The experimenter was blind to the experimental condition for each subject. Methods for analysis of the 25 brain regions studied here have been described previously (Hitzemann and Hitzemann, 1997; Demarest et al., 1998; Kozell et al., 2005). Initially, representative sections were analyzed for each brain section as follows (Paxinos and Franklin, 2001): the central and basolateral nuclei of the amygdala (plate 42), lateral globus pallidus (LGP) (plate 35), and rostromedial LGP (plate 33), medial globus pallidus (MGP) and medial MGP (plate 42), subthalamic nucleus (STN) and medial STN (plate 48), SNr (rostral and dorsomedial, plate 55; caudal, plate 61), rostral SN pars compacta (plate 55), ectorhinal-perirhinal cortex (plate 49), cingulate and prelimbic cortices (plate 18), ventral pallidum (VP) (plate 30), nucleus accumbens core and shell (plate 20), dorsolateral and dorsomedial striatum (plate 20), lateral and medial septum (plate 27), the bed nucleus of the stria terminalis (plate 30), the ventromedial thalamic nucleus (plate 45) and intermediate layers of superior colicullus (plate 61). All images were taken at 10×, and signals were quantified using Image Pro Plus (Media Cybernetics). Standardized brain region templates based on established anatomical markers were used. Standardized threshold parameters (160, light intensity range from 0 to 255) were used to identify and quantify individual c-Fos-positive neurons. Sample size estimates were based on previous studies (Hitzemann and Hitzemann, 1997; Demarest et al., 1998; Kozell et al., 2005).
To definitively demonstrate differences between strains implicated by representative section analyses, c-Fos activation patterns throughout the rostrocaudal extent of six regions were assessed with additional analysis of the following sections: rostral SNr (plates 53, 57), caudal SNr (plates 59, 63), dorsomedial SNr (plates 53, 57), VP (plates 26, 28, 32), rostromedial LGP (plates 31, 32), and STN (plates 46, 50). For each section, the cFos-positive neuron density (c-Fos-positive neurons/mm2) was calculated. The mean densities for a brain region were compared across experimental groups. In our experience, results using this method and using representative sections are comparable. This is consistent with our previous work indicating that the sample sizes used are sufficient to overcome potential artifacts associated with assessing representative sections (Hitzemann and Hitzemann, 1997).
Electrolytic lesions.
Adult male D2 mice were anesthetized by intraperitoneal injection of 0.05 ml of an anesthetic mixture (50 mg/10 ml of xylazine, 500 mg/10 ml of ketamine, and 10 mg/10 ml of acepromazine in 0.9% saline) and then placed in a stereotactic instrument (Cartesian Research). The skull surface was exposed and a burr hole was drilled. An insulated 0.1 mm tungsten wire electrode with only a conductive tip was lowered to the lesion site. Bilateral lesions were performed using a 0.4 mA current for 4 s. The coordinates were estimated based on coordinates for the B6 strain (Paxinos and Franklin, 2001) and determined empirically for D2 mice, and were as follows (in mm): rostrolateral SNr, 2.55 caudal to bregma [anterioposterior (AP), −2.55], 1.65 lateral to midsaggital suture [mediolateral (ML), ±1.65], 4.65 deep from the skull surface [dorsoventral (DV), −4.65]; caudolateral SNr, AP, −3.10; ML, ±1.7; DV, −4.55; STN, AP, −1.45; ML, ±1.45; DV, −4.5. The procedure for sham-lesioned animals was identical except that no current was passed. Thionin staining was used to confirm lesion locations as well as determine the rostrocaudal extent of the lesions of SNr. Lateral lesions were defined as spanning both rostrolateral and caudolateral SNr.
Acute and repeated ethanol withdrawal in lesioned mice.
Physiological dependence is operationally defined as the manifestation of physical disturbances (withdrawal syndrome) after alcohol administration is suspended. McQuarrie and Fingl (1958) first demonstrated a state of withdrawal CNS hyperexcitability after acute alcohol administration. Alcohol withdrawal severity was examined in SNr-lesioned, STN-lesioned, appropriate sham-lesioned, and naive (unoperated) D2 animals by monitoring handling-induced convulsions (HICs) associated with withdrawal, which is a sensitive index of alcohol withdrawal severity (Goldstein and Pal, 1971; Crabbe et al., 1991). Details of the acute ethanol withdrawal procedure have been published (Metten et al., 1998). Individual baseline HICs were measured the day before surgery. Seven to ten days after lesion, baseline (before ethanol) HICs were measured immediately before administration of ethanol (4 g/kg, i.p., 20% v/v in saline), and HIC testing continued hourly between 2 and 12 h after ethanol administration. To create an index of ethanol withdrawal response that is independent of individual differences in baseline HIC scores and reflects differences in withdrawal convulsion severity, postethanol HIC scores were corrected for the individual's average baseline HIC score as in previous work (Metten et al., 1998). Ethanol withdrawal severity scores were calculated as the area under the curve (AUC) (the summed postethanol HIC scores) over the full time course after ethanol. Individual ethanol withdrawal severity scores correspond to these AUC values. A subset of the SNr-lesioned, sham-lesioned, and unoperated control mice were also assessed for pentylenetetrazol-enhanced HICs 1 week after they were tested for acute ethanol withdrawal.
Because repeated alcohol exposure and withdrawal is an important feature of the human condition, we also tested the effect of SNr lesions on withdrawal after repeated ethanol exposures. Withdrawal after repeated ethanol exposures was compared in a different group of SNr- and sham-lesioned animals using a procedure adapted from Crabbe et al. (1991). Seven to ten days after lesion, baseline HICs were measured immediately before administration of 4 g/kg ethanol at hour 0 (10:00 A.M.). Ethanol administration was repeated at hour 8 and hour 20, for a total of three administrations. After each ethanol injection, the animals were returned to their home cages. HIC testing began at hour 22 and continued hourly through hour 34. Additionally, a group of sham-lesioned mice were injected with vehicle (saline) at hour 0 and 8 and with ethanol at hour 20, and withdrawal severity in this acute ethanol withdrawal group was compared with that in sham-lesioned mice that underwent the repeated ethanol exposure procedure.
PTZ-enhanced HICs in lesioned mice.
SNr-lesioned, sham-lesioned, and unoperated control D2 mice were assessed for pentylenetetrazol-enhanced HICs (at 14–17 d after surgery, 7 d after ethanol). These were compared with a group of naive (no ethanol, unoperated) age-matched D2 mice. The mice were tested for baseline (predrug) HICs immediately before intraperitoneal administration of 30 mg/kg PTZ (6,7,8,9-tetrahydro-5H-tetrazoloazepine). PTZ-enhanced HICs were measured 1, 3, 5, 8, 10, 15, 20, 35, 50, and 65 min after PTZ. This time period was selected based on the time course of PTZ-elicited convulsions in a panel of mouse strains (Crabbe et al., 1991). This PTZ dose increases HIC intensity but does not induce other types of convulsions (e.g., tonic hindlimb extensor or wild running) that are associated with higher doses of this drug. To create an index of PTZ response that is independent of individual differences in baseline HIC scores, all PTZ-enhanced HIC scores were corrected for the individual's baseline scores. PTZ-enhanced HIC severity scores were calculated as the area under the curve as in previous work (Fehr et al., 2002).
Statistics.
For comparisons of ethanol withdrawal associated c-Fos activation in congenic and background strain mice, the data were not normally distributed based on a significant Shapiro–Wilks test and were therefore analyzed using nonparametric Kruskal–Wallis one-way ANOVA; this generates a Mann–Whitney U statistic for a comparison of two groups, or an H statistic for a comparison of more than two groups. When appropriate, the Kolmogorov–Smirnoff test with Bonferroni correction for multiple comparisons was used for post hoc analyses. This statistical analysis was also applied to behavioral data of SNr- (or STN-lesioned) versus appropriate sham-lesioned animals as the HIC AUC scores were not normally distributed. All data were analyzed using Systat 12 statistical software (Systat Software). Unless noted otherwise, the significance level was p < 0.05 (two-tailed).
Results
c-Fos induction in Alcw2 congenic and background strain mice
To isolate the influence of Alcw2 from that of other ethanol withdrawal QTLs elsewhere in the genome (Buck et al., 1997, 2002), neuronal activation associated with ethanol withdrawal was compared in Alcw2 congenic and background strain mice. c-Fos was selected because the ethanol withdrawal syndrome is associated with a distinct pattern of neuronal activation as assessed by its induction (Kozell et al., 2005). In contrast, expression of other immediate early gene products (i.e., zif268) is generally insensitive to ethanol withdrawal, although its expression is induced in the central amygdala (Borlikova et al., 2006). To avoid potential confounds of evoked convulsions on c-Fos immunoreactivity, the mice used in the immunohistochemical analyses were not tested for ethanol withdrawal convulsions. None of the mice used in this study exhibited spontaneous convulsions in their home cage after ethanol.
Table 1 summarizes the numbers of c-Fos-positive neurons in ethanol-withdrawn and control congenic and D2 background strain mice across 25 brain regions emphasizing the basal ganglia and associated cortical and limbic circuitry. As expected, little or no c-Fos expression was detected in control animals for most of the brain regions evaluated. Ethanol withdrawal was associated with significantly (p < 0.05) increased numbers of c-Fos-positive neurons in 24 of the 25 brain regions assessed, and six of these regions also showed significant effects of strain and treatment (Table 1). These include the VP (H(3,40) = 22.0; p = 6.6 × 10⁻⁵), rostromedial LGP (H(3,40) = 23.3; p = 3.5 × 10⁻⁵), medial MGP (H(3,40) = 20.4; p = 1.4 × 10⁻⁴), STN (H(3,40) = 23.1; p = 3.9 × 10⁻⁵), and SNr (rostral SNr, H(3,40) = 25.0, p = 1.5 × 10⁻⁵; dorsomedial SNr, H(3,40) = 20.1, p = 1.6 × 10⁻⁴; caudal SNr, H(3,40) = 23.2, p = 3.7 × 10⁻⁵). Post hoc analyses confirmed significantly less c-Fos induction in ethanol withdrawn congenic versus background strain mice in the VP (p = 0.01), rostromedial LGP (p = 1.2 × 10⁻⁴), STN (p = 1.1 × 10⁻³), dorsomedial SNr (p = 0.049), rostral and caudal SNr (p = 0.048 and p = 0.048, respectively); and a similar trend was detected in the medial MGP (p = 0.08). Analysis of the density of c-Fos-positive neurons throughout the rostrocaudal extent of these six regions also showed significantly less c-Fos induction in ethanol-withdrawn congenic mice than ethanol-withdrawn background mice in these regions (Table 2). All of these regions are part of the extended basal ganglia. Notably, neuronal activation associated with ethanol withdrawal was more intense in medial subregions of the basal ganglia, including the rostromedial LGP and medial STN, which are associated with limbic function, compared with lateral subregions of the LGP and STN that are associated with sensorimotor function rather than limbic function. Figure 1 illustrates the extended basal ganglia circuit, highlighting the connectivity of the limbic basal ganglia system, based on anatomical and electrophysiological studies (Maurice et al., 1998a,b; Karachi et al., 2005). The representative c-Fos immunohistochemical photomicrographs for the VP (Fig. 2a,b), LGP (c,d), STN (e,f), SNr (g,h), as well as the limbic subregions rostromedial LGP, medial STN, and dorsomedial SNr, are shown in Figure 2.
Table 1.
Number of c-Fos-positive neurons in Alcw2 congenic and D2 background strain mice
| Congenic |
D2 |
ANOVA | |||
|---|---|---|---|---|---|
| Saline | Ethanol | Saline | Ethanol | ||
| Extended basal ganglia | |||||
| Dorsomedial striatum | 0 ± 0 | 6 ± 2 | 0 ± 0 | 13 ± 4 | T |
| Dorsolateral striatum | 0 ± 0 | 9 ± 2 | 0 ± 0 | 14 ± 2 | T |
| Nucleus accumbens, shell | 43 ± 9 | 83 ± 9 | 21 ± 9 | 97 ± 10 | T |
| Nucleus accumbens, core | 17 ± 5 | 59 ± 8 | 8 ± 3 | 65 ± 9 | T |
| LGP | 0 ± 0 | 114 ± 24 | 0 ± 0 | 192 ± 31 | T |
| Rostromedial LGP | 0 ± 0 | 80 ± 19 | 0 ± 0 | 156 ± 17 | T, S |
| MGP | 1 ± 1 | 86 ± 16 | 1 ± 1 | 157 ± 18 | T |
| Medial MGP | 1 ± 0 | 51 ± 10 | 0 ± 0 | 85 ± 12 | T |
| VP | 0 ± 0 | 98 ± 19 | 0 ± 0 | 158 ± 20 | T, S |
| SNr, rostral | 1 ± 1 | 131 ± 32 | 1 ± 1 | 242 ± 25 | T, S |
| SNr, caudal | 2 ± 1 | 227 ± 41 | 2 ± 1 | 326 ± 19 | T, S |
| Dorsomedial SNr | 1 ± 0 | 53 ± 12 | 0 ± 0 | 85 ± 11 | T, S |
| SNc | 0 ± 0 | 9 ± 5 | 0 ± 0 | 13 ± 4 | T |
| STN | 0 ± 0 | 183 ± 32 | 0 ± 0 | 302 ± 28 | T, S |
| Medial STN | 0 ± 0 | 101 ± 20 | 0 ± 0 | 149 ± 14 | T |
| Extended amygdala | |||||
| CeA | 23 ± 5 | 62 ± 11 | 5 ± 2 | 59 ± 12 | T |
| BLA | 20 ± 7 | 54 ± 9 | 14 ± 4 | 56 ± 10 | T |
| BNST | 7 ± 2 | 51 ± 9 | 2 ± 1 | 59 ± 8 | T |
| Septum | |||||
| Lateral septum | 42 ± 8 | 46 ± 8 | 39 ± 13 | 49 ± 9 | |
| Medial septum | 6 ± 2 | 11 ± 2 | 3 ± 2 | 9 ± 1 | T |
| Cortex | |||||
| Cingulate, area 1 | 25 ± 3 | 45 ± 8 | 20 ± 7 | 53 ± 7 | T |
| Prelimbic | 58 ± 8 | 100 ± 12 | 46 ± 11 | 108 ± 13 | T |
| Ectorhinal-perirhinal cortex | 38 ± 2 | 166 ± 9 | 39 ± 6 | 170 ± 12 | T |
| SNr outputs | |||||
| Ventromedial thalamus | 0 ± 0 | 64 ± 18 | 1 ± 1 | 91 ± 14 | T |
| Superior colliculus, intermediate layers | 78 ± 18 | 109 ± 26 | 27 ± 9 | 164 ± 28 | T |
Brain regional numbers of c-Fos-positive neurons in Alcw2 congenic and background strain mice. Congenic and background strain (D2) mice were administered 4 gm/kg ethanol (n = 14 and 16, respectively) or saline control (n = 5 per strain). Seven hours later, the brains were removed and processed for immunohistochemical analysis. Values represent the number of c-Fos-immunoreactive neurons (mean ± SEM) in representative sections. Significant effects of treatment (T) and strain (S), based on the results of Kruskal–Wallis one-way ANOVA, are indicated.
Table 2.
Mean c-Fos-positive neuron density
| Congenic |
D2 |
ANOVA | post hoc | |||
|---|---|---|---|---|---|---|
| Saline | Ethanol | Saline | Ethanol | |||
| Rostral SNr | 0 ± 0 | 290 ± 83 | 1 ± 0 | 771 ± 62 | H(3,40) = 27.4; p < 10−4 | p = 9.6 × 10⁻³ |
| Caudal SNr | 2 ± 1 | 374 ± 87 | 4 ± 2 | 766 ± 38 | H(3,40) = 25.5; p < 10−4 | p = 1.2 × 10⁻² |
| Dorsomedial SNr | 0 ± 0 | 616 ± 190 | 4 ± 3 | 1515 ± 118 | H(3,40) = 25.0; p < 10−4 | p = 1.5 × 10⁻² |
| Ventral pallidum | 1 ± 1 | 285 ± 74 | 0 ± 0 | 818 ± 45 | H(3,40) = 29.7; p < 10−4 | p = 2.6 × 10⁻⁴ |
| Rostromedial LGP | 0 ± 0 | 385 ± 98 | 0 ± 0 | 996 ± 54 | H(3,40) = 29.6; p < 10−4 | p = 6.0 × 10⁻³ |
| Subthalamic nucleus | 0 ± 0 | 1256 ± 313 | 12 ± 10 | 2611 ± 130 | H(3,40) = 25.2; p < 10−4 | p = 1.9 × 10⁻³ |
The number of labeled cells/mm2 ± SEM in six brain regions is shown. Densities of c-Fos-positive neurons in discrete brain regions. The densities of c-Fos-positive neurons were measured throughout the rostrocaudal extent of the six brain regions that displayed significant effects of strain in Table 1. Values represent the mean density of c-Fos-immunoreactive neurons ±SEM/mm2. In each region, the results of a Kruskal–Wallis one-way ANOVA and the post hoc comparison between ethanol withdrawn congenic and background strain mice are indicated.
Figure 1.

Schematic representation of the limbic basal ganglia circuit activation associated with acute ethanol withdrawal. The limbic basal ganglia circuit (dark shaded areas) starts with the limbic prefrontal cortex [medial PFC (mPFC)], which specifically projects to the ventral striatum [nucleus accumbens (NAc)] and to the medial STN (mSTN). The NAc innervates the VP and the rostromedial LGP (rmLGP). Both VP and rostromedial LGP send and receive projections from the medial STN. The VP and medial STN both send projections to the dorsomedial SNr (dmSNr). The dorsomedial SNr projects indirectly, through specific limbic regions of the thalamus, back to the medial PFC (Maurice et al., 1998a,b; Karachi et al., 2005). The dashed black and solid white lines represent glutamatergic and GABAergic projections, respectively, within the limbic basal ganglia circuitry. mMGP, Medial MGP; au, internal capsule; CPu, caudate putamen.
Figure 2.
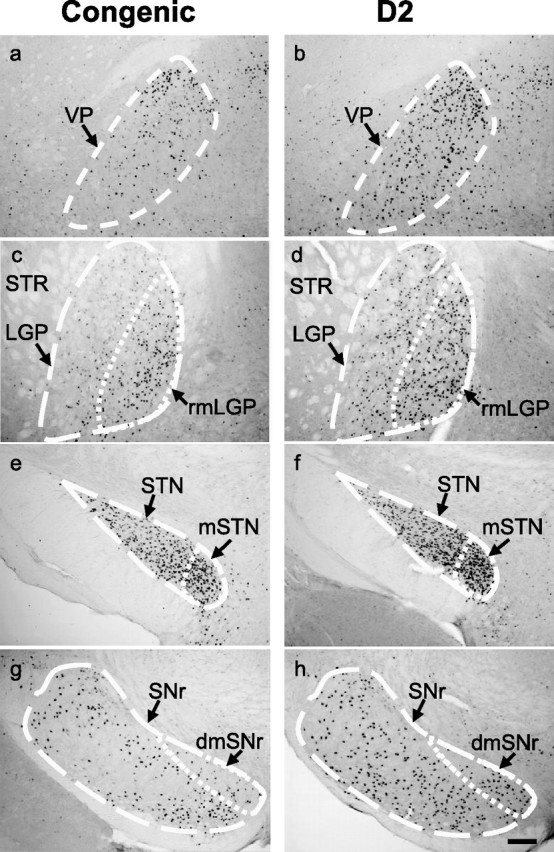
Photomicrographs of c-Fos expression in representative brain regions in ethanol withdrawn Alcw2 congenic and background strain (D2) mice. a–h, Congenic mice showed significantly fewer c-Fos-immunoreactive cells within the VP (a), rostromedial subregion of the lateral globus pallidas (rmLGP) (c), STN (e), and SNr (g) than D2 background strain mice (b,d,f,h), respectively. Subregions associated with limbic function [e.g., rmLGP, medial STN (mSTN), and dorsomedial SNr (dmSNr)] are delineated in panels c–h. c–f, The medial subregions of the rostral LGP (c,d) and STN (e,f) were more intensively activated than the lateral subregions. In rostral SNr, the limbic subregion (i.e., dmSNr) showed increased neuronal activity associated with ethanol withdrawal in both strains but to a lesser degree in congenic versus background strain mice (g,h). STR, Striatum. Scale bar, 100 μm.
Ethanol withdrawal was also associated with increased numbers of c-Fos-immunoreactive neurons in additional brain regions (Table 1). Neither the dorsal nor ventral striatum (nucleus accumbens) showed genotype-dependent induction of c-Fos, although there were significant effects of treatment in all of the striatal regions assessed, including the dorsolateral striatum (U(1,40) = 260; p = 0.0003), dorsomedial striatum (U(1,40) = 260; p = 0.0003), and nucleus accumbens core (U(1,40) = 293; p = 8.0 × 10⁻⁶) and shell (U(1,40) = 277; p = 7.3 × 10⁻⁵). Significant effects of treatment were apparent in substantia nigra pars compacta (U(1,40) = 254; p = 0.0007) and two major SNr projection areas, the ventromedial thalamus (U(1,40) = 282; p = 3.3 × 10⁻⁵) and intermediate layers of the superior colliculus (U(1,40) = 222; p = 0.03). Significant main effects of treatment were also apparent in the extended amygdala [central nucleus of the amygdala (CeA), U(1,40) = 266, p = 0.0003; basolateral amygdala (BLA), U(1,40) = 254, p = 0.0012; bed nucleus of the stria terminalis (BNST), U(1,40) = 299, p = 3.3 × 10⁻⁶], as well as the medial septum (U(1,40) = 222; p = 0.03) and limbic cortical regions including the cingulate (U(1,40) = 244; p = 0.003), prelimbic (U(1,40) = 256; p = 0.0009) and ectorhinal-perirhinal (U(1,40) = 280; p = 3.5 × 10⁻⁶) cortices. No effect of treatment or strain was apparent in the lateral septum.
Focused lesions
Focused lesions were performed to further evaluate the role of the SNr and STN in acute and repeated ethanol withdrawal. Baseline HIC scores did not differ between lesioned and sham-lesioned animals either before surgery or 7 d after surgery (SNr, H(3,90) = 2.32, p = 0.5; STN, H(3,64) = 0.96, p = 0.8). Moreover, sham-lesioned SNr (n = 21) and naive (n = 10) animals did not differ in their ethanol withdrawal severities (H(3,62) = 4.1; p = 0.25), indicating that the surgical procedure did not affect ethanol withdrawal severity.
SNr lesions
Electrophysiological and immunohistochemical analyses suggest that the rostral and caudal SNr are functionally distinct (e.g., in their regulation of a variety of seizure phenotypes) (Moshé and Albala, 1984; Velísková et al., 1996; Fan et al., 1997; Thompson et al., 2000; Velísková and Moshé, 2001) with the caudal SNr, especially the caudolateral SNr, suggested to be proconvulsant (Moshé et al., 1994; Fan et al., 1997). We therefore tested the effect of bilateral lesions of caudolateral and rostrolateral subregions of SNr on acute ethanol withdrawal severity (Fig. 3). Using coordinates from a mouse brain atlas (Paxinos and Franklin, 2001), confirmed lesions of rostrolateral SNr extended from −2.5 to −3.1 mm AP from Bregma and occasionally extended into the adjacent rostromedial SNr, substantia nigra pars compacta (SNc), and/or cerebral peduncles (Fig. 3a,b). Confirmed lesions of caudolateral SNr extended from approximately −3.1 to −3.8 mm AP from Bregma, and occasionally extended into the adjacent substantia nigra pars lateris, and/or cerebral peduncles (Fig. 3a,d). In the lateral SNr-lesioned group, the entire extent of rostrolateral and caudolateral SNr was lesioned. Representative photomicrographs rostrolateral and caudolateral SNr-lesioned animals are shown (Fig. 3c,e).
Figure 3.
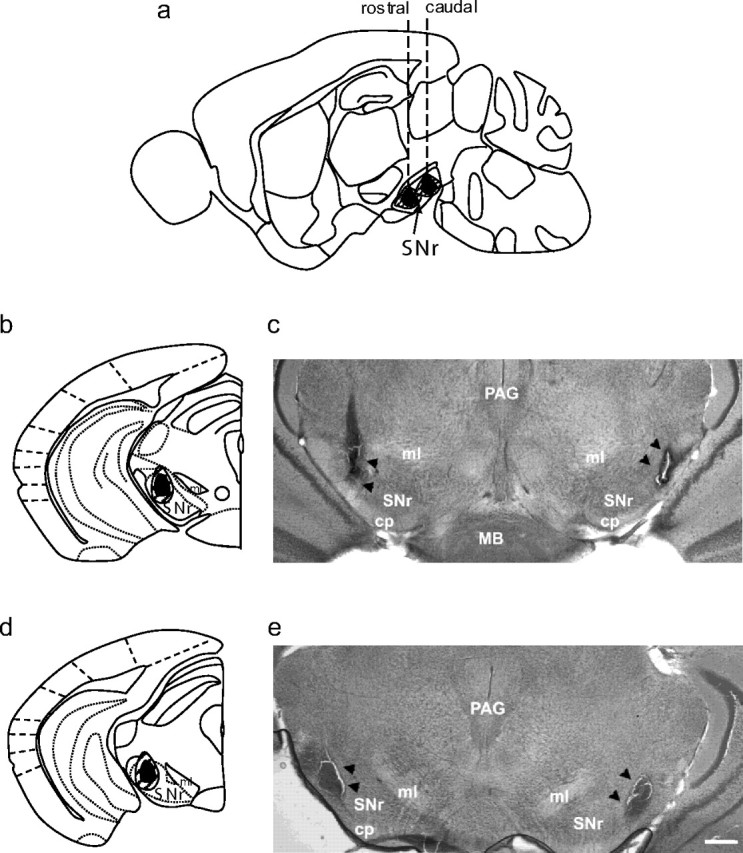
SNr lesions. a, Schematic diagram of a sagital brain section depicting the rostrocaudal and dorsoventral extent of lesions in the rostral SNr (with the left dashed line corresponding to coronal sections shown in b and c) or caudal SNr (with the right dashed line corresponding to coronal sections shown in d and e). b, d, Diagrams of coronal sections of the rostral and caudal SNr indicating the mediolateral and dorsoventral extents of rostrolateral and caudolateral SNr lesions, respectively (only 1 side is shown). Lateral SNr lesions extended from rostrolateral to caudolateral SNr. Black shaded areas represent the minimal lesion area, and the hatched areas represent more extensive lesions observed in some animals. c, e, Low-magnification (2×) photomicrographs of brain sections showing a representative bilateral rostrolateral SNr lesion (c) and bilateral caudolateral SNr lesion (e). Black arrowheads indicate the lesioned area. cp, Cerebral peduncle; PAG, periaqueductal gray; MB, mammillary body; ml, medial lemniscus. Scale bar, 250 μm.
One-way ANOVA showed significant differences in acute ethanol withdrawal severity among the caudolateral, rostrolateral, and lateral SNr-lesioned and sham-lesioned groups (H(3,43) = 21.5; p = 0.0008). Bilateral lesions restricted to the caudolateral SNr significantly attenuated ethanol withdrawal severity compared with sham-lesioned animals (p = 5.8 × 10⁻⁴). In contrast, animals with bilateral lesions restricted to the rostrolateral SNr did not differ from sham-lesioned mice in their ethanol withdrawal severities (p = 0.8). Bilateral lesions encompassing both the rostrolateral and caudolateral SNr (lateral SNr) significantly reduced ethanol withdrawal severity, compared with the sham-lesioned animals (p = 4.8 × 10⁻³) (Fig. 4). Neither unilateral lesions of caudolateral SNr, nor lesions located near but not within the SNr, altered ethanol withdrawal convulsion severity compared with sham-lesioned animals (data not shown).
Figure 4.

Attenuation of acute ethanol withdrawal severity by caudolateral SNr lesions. a, Bilateral SNr-lesioned and sham-lesioned D2 mice were scored for baseline HICs immediately before administration of 4 g/kg ethanol (arrow marks ethanol injection at time 0) and hourly between 2 and 12 h after ethanol administration. Data represent the mean raw scores ±SEM for baseline and postethanol HICs. Alcohol administration initially lowers HIC scores (0–4 h). Later, convulsion scores increase above baseline, indicating a state of withdrawal hyperexcitability, which peaked ∼6 h after ethanol administration. b, Caudolateral SNr lesions significantly reduced ethanol withdrawal scores calculated as AUC (corrected for baseline HIC scores) compared with sham-lesioned groups (p < 0.001). Similarly, animals with lateral SNr lesions (spanning caudal and rostral lateral SNr) showed significantly less severe ethanol withdrawal than sham-lesioned animals (p < 0.005). In contrast, rostrolateral SNr lesions did not alter ethanol withdrawal convulsion severity compared with sham-lesioned control animals (p = 0.8). **p < 0.005.
Repeated episodes of ethanol intoxication intensified withdrawal severity, with sham-lesioned animals showing significantly more severe withdrawal after repeated ethanol administrations than after a single ethanol injection (p = 0.04) (Fig. 5). Mice with confirmed caudolateral SNr lesions showed significant attenuation in withdrawal severity after repeated intermittent ethanol exposure compared with sham-lesioned control animals (p = 1 × 10⁻³) (Fig. 5). Thus, bilateral caudolateral SNr lesions attenuated both acute and repeated alcohol withdrawal severity.
Figure 5.

Caudolateral SNr lesions also reduce withdrawal severity after repeated ethanol administration. a, Bilateral caudolateral SNr-lesioned and sham-lesioned D2 mice were scored for baseline HICs. Lesioned mice (n = 12) and one group of sham-lesioned mice (n = 11) received three injections of 4 g/kg ethanol at hour 0, 8, and 20. In the second group of sham-lesioned mice, the first and second injections were replaced with saline, and ethanol was administered only once at hour 20 (n = 6). All mice were tested for HICs hourly beginning at hour 22 and through hour 34. Data represent the mean raw scores ±SEM for baseline and postethanol HICs. b, Repeated episodes of ethanol intoxication and withdrawal significantly enhanced ethanol withdrawal severity (AUC, corrected for baseline HIC scores) compared with acute ethanol withdrawn animals (p < 0.05). Mice with bilateral caudolateral SNr lesions displayed significantly less severe ethanol withdrawal than sham-lesioned animals after repeated episodes of ethanol intoxication and withdrawal (p = 0.001). *p < 0.05; **p < 0.005.
STN lesions
A total of 57 mice were tested, including 11 with bilateral lesions of the STN, 11 with unilateral lesions of the STN, 17 with lesions near but not within the STN, and 18 sham-lesioned controls. Confirmed lesions of STN extended throughout the entire rostrocaudal STN, from −1.7 to −2.3 mm AP from Bregma, and also occasionally included the adjacent zona incerta, lateral hypothalamus, and/or cerebral peduncles. No significant difference in AUC values was apparent between bilateral STN-lesioned and sham-lesioned mice (p = 0.13) (Fig. 6). Although the data suggest the possibility of a shift in the withdrawal time course in STN-lesioned animals, statistical analyses of these data did not detect a significant difference. Nonparametric analysis comparison of HIC scores at individual time points did not detect a significant difference in withdrawal severity between STN- and sham-lesioned animals, although a trend was observed at hour 5 (U(1,29) = 117; p = 0.07, uncorrected for multiple comparisons) and hour 6 (U(1,29) = 127; p = 0.14, uncorrected for multiple comparisons). Additionally, no differences in ethanol withdrawal convulsions were apparent between unilateral-lesioned and sham-lesioned animals.
Figure 6.

STN lesions did not alter ethanol withdrawal severity. a, Schematic of histological sections depicting the extent of confirmed STN lesions (only 1 side is shown). Black shaded areas represent the minimal lesion area, and the hatched areas represent more extensive lesions observed in some animals. b, Bilateral STN-lesioned and sham-lesioned D2 mice were scored for baseline HICs immediately before administration of 4 g/kg ethanol (arrow marks ethanol injection at time 0) and hourly between 2 and 12 h after ethanol administration. Data represent the mean raw scores ±SEM for baseline and postethanol HICs. Although the data suggest the possibility of a shift in the withdrawal time course in STN-lesioned animals, statistical analyses of these data did not detect a significant difference at any time point, or in the overall time course. Inset, Bilateral STN lesions did not reduce ethanol withdrawal scores calculated as AUC, compared with the sham-lesioned group (p = 0.6). cp, Cerebral peduncle.
PTZ-enhanced HICs in caudolateral SNr-lesioned animals
One week after ethanol withdrawal testing, caudolateral SNr-lesioned D2 mice were compared with sham-lesioned and unoperated control D2 mice for their HIC severities after PTZ (30 mg/kg, i.p.) administration which exerts its convulsant effects by impairing GABAA-mediated neurotransmission (Corda et al., 1991; Kulkarni and George, 1995). Because these animals were previously tested with ethanol, PTZ-enhanced convulsion severity was compared in unoperated mice that were previously tested with ethanol (AUC, 172 ± 34; n = 6) and naive age-matched D2 mice (AUC, 192 ± 24; n = 11); no difference was detected (U(1,17) = 37; p = 0.7). Additionally, baseline (before PTZ) HIC scores also did not differ from those obtained 1 week previously before ethanol exposure (U(1,32) = 137; p = 0.3). Thus, the PTZ-enhanced convulsion severity was not altered by the ethanol withdrawal testing performed 1 week previous. No differences in PTZ-enhanced HICs between caudolateral SNr-lesioned, sham-lesioned, and unoperated control mice were detected (H(2,16) = 0.43; p = 0.8) (Fig. 7).
Figure 7.

Bilateral SNr lesions did not alter PTZ-enhanced convulsions. Bilateral caudolateral SNr-lesioned, sham-lesioned, and no surgery control groups all received a single dose of PTZ (30 mg/kg, i.p.). HICs were measured 1, 3, 5, 8, 10, 15, 20, 35, 50, and 65 min postPTZ administration. PTZ-enhanced convulsions, calculated as the AUC, did not differ between caudolateral SNr-lesioned (n = 4), sham-lesioned (n = 6), and unoperated control (n = 6) D2 mice (H(2,16) = 0.43; p = 0.8).
Discussion
Currently, the structures responsible for the onset, propagation, and cessation of generalized alcohol withdrawal convulsions are not known. The present studies are the first to elucidate neural circuitry by which a confirmed alcohol withdrawal QTL influences behavior and suggest that Alcw2 impacts behavior via its influence on basal ganglia circuitry associated with limbic function. Additionally, our study is the first to use focused lesions to assess the influence of the SNr on ethanol withdrawal, and show that the caudolateral SNr plays a critical role in acute and repeated ethanol withdrawal, whereas lesions of the rostral SNr and STN did not affect ethanol withdrawal convulsion severity.
Neuronal activation in subregions of the basal ganglia associated with limbic function (i.e., VP, rostromedial LGP, medial MGP, and dorsomedial SNr) was more intense than in subregions associated with sensorimotor function. Within extended limbic basal ganglia circuitry, the VP and accumbens core regulate limbic seizures (Churchill et al., 1992) and may play a similar role in ethanol withdrawal convulsions. This circuit also plausibly contributes to other behaviors associated with the withdrawal syndrome (i.e., tremors, depression-like behavior, anxiety-like behavior, emotionality, and stereotypy). Lesions spanning VP and ventral globus pallidus alleviate tremors, depressive mood, and emotional activity (Narabayashi, 1997). Notably, ethanol-withdrawn Alcw2 congenic animals exhibit less severe depression-like behavior than background strain animals (L. Milner and K. Buck, unpublished observations). The VP is implicated in anxiety-like behavior (Nikolaus et al., 2000), although it should be kept in mind that measurement of withdrawal-related anxiety-like behavior in mice is confounded by decreased locomotion (Kliethermes, 2005). The rostromedial LGP influences stereotypy (Grabli et al., 2004), and the VP affects locomotion and reward-related behavior (Kretschmer, 2000; June et al., 2003). Although many signs of the ethanol withdrawal syndrome are genetically correlated with HIC severity (i.e., tremors, hypoactivity, emotionality) (Kosobud and Crabbe, 1986; Belknap et al., 1987; Feller et al., 1994), others are not (i.e., tail stiffness) (Kosobud and Crabbe, 1986). Thus, assessment of withdrawal HICs can inform analyses for correlated withdrawal signs but represents only part of the complex syndrome of alcohol withdrawal (Wilson et al., 1984). Future studies will be needed to determine to what degree the brain circuitry identified here also affects other withdrawal signs. Additionally, it is well documented that alcohol withdrawal HIC severity is genetically correlated with alcohol preference drinking (Metten et al., 1998; our unpublished data). The SNr receives projection from the central nucleus of the amygdala (Shinonaga et al., 1992) which has a prominent role in alcohol preference (Dhaher et al., 2008). Future studies will assess the contribution of this circuit to the relationship between ethanol preference and withdrawal.
c-Fos induction in Alcw2 congenic animals expands during results using standard inbred strains (Kozell et al., 2005). We identified six brain regions with less c-Fos induction in ethanol-withdrawn congenic versus background strains. c-Fos induction in these six regions also differed between ethanol-withdrawn D2 and B6 progenitor strains. Therefore, lower c-Fos activation in these regions is associated with less severe withdrawal severity. However, c-Fos induction remained substantial in ethanol-withdrawn Alcw2 congenic animals, but was negligible in B6 mice (Kozell et al., 2005), suggesting that neuronal activation in the basal ganglia is influenced by additional withdrawal QTLs. Furthermore, several brain regions that did not differ in c-Fos induction between ethanol-withdrawn Alcw2 congenic and background strains did differ between D2 and B6 strains (e.g., dorsolateral caudate–putamen and lateral septum) (Kozell et al., 2005). This suggests that neural activation in these brain regions is not affected by Alcw2 status and instead is influenced by withdrawal QTLs elsewhere in the genome (e.g., chromosomes 1, 11, and 19) (Buck et al., 1997, 2002).
In addition to our studies implicating the SNr in acute and repeated ethanol withdrawal, evidence indicates that the SNr is involved in chronic ethanol withdrawal. Intranigral microinjection of a GABAA receptor agonist suppressed audiogenic seizures associated with chronic ethanol withdrawal (Frye et al., 1983; Gonzalez and Hettinger, 1984), demonstrating that inhibition of SNr activity attenuated withdrawal. This is consistent with our finding that SNr lesions attenuate withdrawal. Withdrawal was more severe after repeated ethanol exposure than using the acute model and, perhaps for this reason, SNr lesions virtually abolished withdrawal convulsions using the acute model, whereas SNr-lesioned animals showed a 65% reduction in withdrawal convulsivity using the repeated model. Decreased withdrawal severity was comparable using both models, so this may represent a scalar limit. It is also plausible that additional brain regions are recruited after repeated ethanol exposure so SNr lesions no longer entirely block withdrawal convulsions.
Our results demonstrate that the caudolateral SNr plays a critical role in ethanol withdrawal, whereas lesions restricted to rostrolateral SNr did not affect withdrawal convulsions. Numerous analyses support the premise that there are functional differences between caudal and rostral SNr (Moshé et al., 1994; Shehab et al., 1996; Velísková et al., 1998; Galanopoulou et al., 2003; Ravizza et al., 2003; Velisek et al., 2005). Additionally, NMDA and metabotropic glutamate receptor densities are greater in caudal versus rostral SNr (Hedberg et al., 2003). Many neurons in caudal, but not rostral, SNr express 5-HT2C receptor mRNA (Eberle-Wang et al., 1997). The rostral and caudal SNr mediate distinct facilitatory and inhibitory effects on seizures (Moshé and Albala, 1984; Velísková et al., 1996; Fan et al., 1997; Velísková and Moshé, 2001). Caudal SNr is active during the preclonic period and may facilitate seizure initiation/propagation, whereas rostral SNr becomes involved after a motor seizure occurs (Collins et al., 1986; Velísková et al., 2005). Thus, regionally specific receptor expression and/or intrinsic properties of SNr neurons may influence site-specific effects on withdrawal.
Although the SNr is critical to alcohol withdrawal, SNr lesions did not alter PTZ-enhanced convulsions. Consistent with this observation, Alcw2 congenic and background strains do not differ in PTZ-enhanced HICs (Reilly et al., 2008). However, Alcw2 congenic animals exhibited less severe convulsions in response to SB242084, a 5-HT2C receptor antagonist, than background strain animals. The 5-HT2C receptor is the only protein shown to interact in vivo with the multi-PDZ domain protein (Becamel et al., 2001), the product of a quantitative trait gene (Mpdz) that underlies Alcw2 (Shirley et al., 2004). SNr is rich in 5-HT2C receptors, which primarily excite SNr neurons (Rick et al., 1995). This excitation increases SNr extracellular GABA (Invernizzi et al., 2007) and limits the development and propagation of limbic seizures (Pasini et al., 1996). Intranigral microinjection of a GABAA receptor agonist suppresses seizures associated with ethanol withdrawal (Frye et al., 1983; Gonzalez and Hettinger, 1984). Thus, this QTL may affect ethanol withdrawal via Mpdz allelic variation that affects the rate fidelity of 5-HT2C receptor transmission in SNr. This will be tested directly in future studies examining the effect of SNr-directed pharmacological and RNAi manipulation of 5-HT2C receptor function on withdrawal. The STN is a pivotal structure within the basal ganglia and provides a major excitatory glutamatergic input to SNr (Van Der Kooy and Hattori, 1980; Robledo and Fegér, 1990). Surprisingly, STN lesions did not significantly affect withdrawal convulsions. In kindled animals, analyses of the temporal sequence of ictal discharges propagated in the corticolimbic basal ganglia system show that discharges arrive first at the SNr and then spread to STN (Shi et al., 2007). Together, these results support the idea that the SNr might play an important role in initiating/gating ethanol withdrawal convulsions, but additional future work will be necessary to test this.
Our studies contribute significantly to understanding the genetic and neural determination of alcohol withdrawal, but there are some limitations. Our c-Fos expression results are based on a survey emphasizing the basal ganglia and associated circuitry that, although an important first step, will need to be expanded in future studies using unbiased stereological counting procedure (Mura et al., 2004). We focused on one immediate early gene product and one time after ethanol. Because not all neuronal populations express Fos protein during stimulation (Strassman and Vos, 1993; Willoughby et al., 1995), future studies using other immediate early genes and assessing more time points may identify additional brain regions of interest. The congenic used contains a number of genes in the introgressed interval in addition to the QTL, thus it is possible that additional genes influenced the c-Fos expression pattern. More definitive confirmation that QTL status influences neural activation in the implicated brain regions will likely require verification using Mpdz transgenic and knock-out models and/or RNA interference. Although there are no reports of regional differences in brain ethanol concentration in mice, a previous study indicates that ethanol distribution may differ in the striatum compared with other regions in rats (Chen et al., 2007). However, we found very little c-Fos induction in the striatum of ethanol-withdrawn congenic and background strain animals, and this induction did not differ. Nonetheless, it will be interesting to determine in future work whether regional differences in ethanol concentration exist in mice and whether this is related to regional and/or genetic differences in neural activation associated with withdrawal. Finally, although focused lesions were performed, incidental activation/lesion of neuronal populations or passing fibers near the stimulating electrode attributable to current spread must be considered.
Footnotes
This work was supported by Public Health Service Grants AA011114, AA10760, DA05228, AA11034, and AA13484 and a Veterans Affairs Merit grant. We are grateful to Drs. Charles Meshul, John Belknap, John Crabbe, and Pam Metten for many helpful discussions of these experiments and their comments on a draft of this manuscript.
References
- Becamel C, Figge A, Poliak S, Dumuis A, Peles E, Bockaert J, Lubbert H, Ullmer C. Interaction of serotonin 5-hydroxytryptamine type 2C receptors with PDZ10 of the multi-PDZ domain protein MUPP1. J Biol Chem. 2001;276:12974–12982. doi: 10.1074/jbc.M008089200. [DOI] [PubMed] [Google Scholar]
- Belknap JK, Laursen SE, Crabbe JC. Ethanol and nitrous oxide produce withdrawal-induced convulsions by similar mechanisms in mice. Life Sci. 1987;41:2033–2040. doi: 10.1016/0024-3205(87)90477-2. [DOI] [PubMed] [Google Scholar]
- Borlikova GG, Le Merrer J, Stephens DN. Previous experience of ethanol withdrawal increases withdrawal-induced c-fos expression in limbic areas, but not withdrawal-induced anxiety and prevents withdrawal-induced elevations in plasma corticosterone. Psychopharmacology (Berl) 2006;185:188–200. doi: 10.1007/s00213-005-0301-3. [DOI] [PubMed] [Google Scholar]
- Buck KJ, Metten P, Belknap JK, Crabbe JC. Quantitative trait loci involved in genetic predisposition to acute alcohol withdrawal in mice. J Neurosci. 1997;17:3946–3955. doi: 10.1523/JNEUROSCI.17-10-03946.1997. [DOI] [PMC free article] [PubMed] [Google Scholar]
- Buck KJ, Rademacher BS, Metten P, Crabbe JC. Mapping murine loci for physical dependence on ethanol. Psychopharmacology (Berl) 2002;160:398–407. doi: 10.1007/s00213-001-0988-8. [DOI] [PubMed] [Google Scholar]
- Chakravarty DN, Faingold CL. Comparison of neuronal response patterns in the external and central nuclei of inferior colliculus during ethanol administration and ethanol withdrawal. Brain Res. 1998;783:102–108. doi: 10.1016/s0006-8993(97)01193-1. [DOI] [PubMed] [Google Scholar]
- Chen JC, Lin CC, Ng CC, Chiu TF, Shyr MH. Uneven distribution of ethanol in rat brain following acute administration, with the highest level in the striatum. J Stud Alcohol Drugs. 2007;68:649–653. doi: 10.15288/jsad.2007.68.649. [DOI] [PubMed] [Google Scholar]
- Choi DC, Furay AR, Evanson NK, Ostrander MM, Ulrich-Lai YM, Herman JP. Bed nucleus of the stria terminalis subregions differentially regulate hypothalamic-pituitary-adrenal axis activity: implications for the integration of limbic inputs. J Neurosci. 2007;27:2025–2034. doi: 10.1523/JNEUROSCI.4301-06.2007. [DOI] [PMC free article] [PubMed] [Google Scholar]
- Churchill L, Cross RS, Pazdernik TL, Nelson SR, Zahm DS, Heimer L, Kalivas PW. Patterns of glucose use after bicuculline-induced convulsions in relationship to γ-aminobutyric acid and mu-opioid receptors in the ventral pallidum–functional markers for the ventral pallidum. Brain Res. 1992;581:39–45. doi: 10.1016/0006-8993(92)90341-6. [DOI] [PubMed] [Google Scholar]
- Collins RC, Santori EM, Der T, Toga AW, Lothman EW. Functional metabolic mapping during forelimb movement in rat. I. Stimulation of motor cortex. J Neurosci. 1986;6:448–462. doi: 10.1523/JNEUROSCI.06-02-00448.1986. [DOI] [PMC free article] [PubMed] [Google Scholar]
- Corda MG, Orlandi M, Lecca D, Carboni G, Frau V, Giorgi O. Pentylenetetrazol-induced kindling in rats: effect of GABA function inhibitors. Pharmacol Biochem Behav. 1991;40:329–333. doi: 10.1016/0091-3057(91)90562-g. [DOI] [PubMed] [Google Scholar]
- Crabbe JC, Merrill C, Belknap JK. Acute dependence on depressant drugs is determined by common genes in mice. J Pharmacol Exp Ther. 1991;257:663–667. [PubMed] [Google Scholar]
- Dave JR, Tabakoff B, Hoffman PL. Ethanol withdrawal seizures produce increased c-fos mRNA in mouse brain. Mol Pharmacol. 1990;37:367–371. [PubMed] [Google Scholar]
- Demarest K, Hitzemann B, Mahjubi E, McCaughran J, Jr, Hitzemann R. Further evidence that the central nucleus of the amygdala is associated with the ethanol-induced locomotor response. Alcohol Clin Exp Res. 1998;22:1531–1537. [PubMed] [Google Scholar]
- Dhaher R, Finn D, Snelling C, Hitzemann R. Lesions of the extended amygdala in C57BL/6J mice do not block the intermittent ethanol vapor-induced increase in ethanol consumption. Alcohol Clin Exp Res. 2008;32:197–208. doi: 10.1111/j.1530-0277.2007.00566.x. [DOI] [PubMed] [Google Scholar]
- Eberle-Wang K, Mikeladze Z, Uryu K, Chesselet MF. Pattern of expression of the serotonin-2C receptor messenger RNA in the basal ganglia of adult rats. J Comp Neurol. 1997;384:233–247. [PubMed] [Google Scholar]
- Fan XD, Zhang X, Yu PH, Li XM, Juorio AV. Induction of preconvulsive behavior and Fos expression by dopamine-induced nigral lesion in the rat. Brain Res. 1997;751:31–36. doi: 10.1016/s0006-8993(96)01386-8. [DOI] [PubMed] [Google Scholar]
- Fehr C, Shirley RL, Belknap JK, Crabbe JC, Buck KJ. Congenic mapping of alcohol and pentobarbital withdrawal liability loci to a <1 centimorgan interval of murine chromosome 4: identification of Mpdz as a candidate gene. J Neurosci. 2002;22:3730–3738. doi: 10.1523/JNEUROSCI.22-09-03730.2002. [DOI] [PMC free article] [PubMed] [Google Scholar]
- Fehr C, Shirley RL, Metten P, Kosobud AEK, Belknap JK, Crabbe JC, Buck KJ. Potential pleiotropic effects of Mpdz on vulnerability to seizures. Genes Brain Behav. 2004;3:8–19. doi: 10.1111/j.1601-183x.2004.00035.x. [DOI] [PubMed] [Google Scholar]
- Feller DJ, Bassir JM, Crabbe JC, Le Fevre CA. Audiogenic seizure susceptibility in WSP and WSR mice. Epilepsia. 1994;35:861–867. doi: 10.1111/j.1528-1157.1994.tb02524.x. [DOI] [PubMed] [Google Scholar]
- Frye GD, McCown TJ, Breese GR. Characterization of susceptibility to audiogenic seizures in ethanol-dependent rats after microinjection of γ-aminobutyric acid (GABA) agonists into the inferior colliculus, substantia nigra or medial septum. J Pharmacol Exp Ther. 1983;227:663–670. [PMC free article] [PubMed] [Google Scholar]
- Galanopoulou AS, Kyrozis A, Claudio OI, Stanton PK, Moshé SL. Sex-specific KCC2 expression and GABAA receptor function in rat substantia nigra. Exp Neurol. 2003;183:628–637. doi: 10.1016/s0014-4886(03)00213-9. [DOI] [PubMed] [Google Scholar]
- Goldman D, Oroszi G, O'Malley S, Anton R. COMBINE genetics study: the pharmacogenetics of alcoholism treatment response: genes and mechanisms. J Stud Alcohol. 2005;(Suppl):56–64. doi: 10.15288/jsas.2005.s15.56. discussion 33. [DOI] [PubMed] [Google Scholar]
- Goldstein DB, Pal N. Alcohol dependence produced in mice by inhalation of ethanol: grading the withdrawal reaction. Science. 1971;172:288–290. doi: 10.1126/science.172.3980.288. [DOI] [PubMed] [Google Scholar]
- Gonzalez LP, Hettinger MK. Intranigral muscimol suppresses ethanol withdrawal seizures. Brain Res. 1984;298:163–166. doi: 10.1016/0006-8993(84)91162-4. [DOI] [PubMed] [Google Scholar]
- Grabli D, McCairn K, Hirsch EC, Agid Y, Féger J, François C, Tremblay L. Behavioural disorders induced by external globus pallidus dysfunction in primates: I. Behavioural study. Brain. 2004;127:2039–2054. doi: 10.1093/brain/awh220. [DOI] [PubMed] [Google Scholar]
- Hasin DS, Stinson FS, Ogburn E, Grant BF. Prevalence, correlates, disability, and comorbidity of DSM-IV alcohol abuse and dependence in the United States: results from the National Epidemiologic Survey on Alcohol and Related Conditions. Arch Gen Psychiatry. 2007;64:830–842. doi: 10.1001/archpsyc.64.7.830. [DOI] [PubMed] [Google Scholar]
- Hedberg TG, Velísková J, Sperber EF, Nunes ML, Moshé SL. Age-related differences in NMDA/metabotropic glutamate receptor binding in rat substantia nigra. Int J Dev Neurosci. 2003;21:95–103. doi: 10.1016/s0736-5748(02)00125-9. [DOI] [PubMed] [Google Scholar]
- Herdegen T, Leah JD. Inducible and constitutive transcription factors in the mammalian nervous system: control of gene expression by Jun, Fos and Krox, and CREB/ATF proteins. Brain Res Brain Res Rev. 1998;28:370–490. doi: 10.1016/s0165-0173(98)00018-6. [DOI] [PubMed] [Google Scholar]
- Hitzemann B, Hitzemann R. Genetics ethanol and the Fos response: a comparison of the C57BL/6J and DBA/2J inbred mouse strains. Alcohol Clin Exp Res. 1997;21:1497–1507. [PubMed] [Google Scholar]
- Invernizzi RW, Pierucci M, Calcagno E, Di Giovanni G, Di Matteo V, Benigno A, Esposito E. Selective activation of 5-HT(2C) receptors stimulates GABA-ergic function in the rat substantia nigra pars reticulata: a combined in vivo electrophysiological and neurochemical study. Neuroscience. 2007;144:1523–1535. doi: 10.1016/j.neuroscience.2006.11.004. [DOI] [PubMed] [Google Scholar]
- June HL, Foster KL, McKay PF, Seyoum R, Woods JE, Harvey SC, Eiler WJ, Grey C, Carroll MR, McCane S, Jones CM, Yin W, Mason D, Cummings R, Garcia M, Ma C, Sarma PV, Cook JM, Skolnick P. The reinforcing properties of alcohol are mediated by GABAA1 receptors in the ventral pallidum. Neuropsychopharmacology. 2003;28:2124–2137. doi: 10.1038/sj.npp.1300239. [DOI] [PubMed] [Google Scholar]
- Karachi C, Yelnik J, Tandé D, Tremblay L, Hirsch EC, François C. The pallidosubthalamic projection: an anatomical substrate for nonmotor functions of the subthalamic nucleus in primates. Mov Disord. 2005;20:172–180. doi: 10.1002/mds.20302. [DOI] [PubMed] [Google Scholar]
- Kliethermes CL. Anxiety-like behaviors following chronic ethanol exposure. Neurosci Biobehav Rev. 2005;28:837–850. doi: 10.1016/j.neubiorev.2004.11.001. [DOI] [PubMed] [Google Scholar]
- Knapp DJ, Duncan GE, Crews FT, Breese GR. Induction of Fos-like proteins and ultrasonic vocalizations during ethanol withdrawal: further evidence for withdrawal-induced anxiety. Alcohol Clin Exp Res. 1998;22:481–493. [PubMed] [Google Scholar]
- Kosobud A, Crabbe JC. Ethanol withdrawal in mice bred to be genetically prone or resistant to ethanol withdrawal seizures. J Pharmacol Exp Ther. 1986;238:170–177. [PubMed] [Google Scholar]
- Kostowski W, Trzaskowska E. Effects of lesion of the locus coeruleus and clonidine treatment on ethanol withdrawal syndrome in rats. Pol J Pharmacol Pharm. 1980;32:617–623. [PubMed] [Google Scholar]
- Kozell LB, Hitzemann R, Buck KJ. Acute alcohol withdrawal is associated with c-Fos expression in the basal ganglia and associated circuitry: C57BL/6J and DBA/2J inbred mouse strain analyses. Alcohol Clin Exp Res. 2005;29:1939–1948. doi: 10.1097/01.alc.0000187592.57853.12. [DOI] [PubMed] [Google Scholar]
- Kretschmer BD. Functional aspects of the ventral pallidum. Amino Acids. 2000;19:201–210. doi: 10.1007/s007260070050. [DOI] [PubMed] [Google Scholar]
- Kulkarni SK, George B. Pentylenetetrazol-induced kindling in animals: protective effect of BR-16A. Indian J Exp Biol. 1995;33:424–427. [PubMed] [Google Scholar]
- Little HJ, Stephens DN, Ripley TL, Borlikova G, Duka T, Schubert M, Albrecht D, Becker HC, Lopez MF, Weiss F, Drummond C, Peoples M, Cunningham C. Alcohol withdrawal and conditioning. Alcohol Clin Exp Res. 2005;29:453–464. doi: 10.1097/01.alc.0000156737.56425.e3. [DOI] [PubMed] [Google Scholar]
- Long JC, Knowler WC, Hanson RL, Robin RW, Urbanek M, Moore E, Bennett PH, Goldman D. Evidence for genetic linkage to alcohol dependence on chromosomes 4 and 11 from an autosome-wide scan in an American Indian population. Am J Med Genet. 1998;81:216–221. doi: 10.1002/(sici)1096-8628(19980508)81:3<216::aid-ajmg2>3.0.co;2-u. [DOI] [PubMed] [Google Scholar]
- Maurice N, Deniau JM, Glowinski J, Thierry AM. Relationships between the prefrontal cortex and the basal ganglia in the rat: physiology of the corticosubthalamic circuits. J Neurosci. 1998a;18:9539–9546. doi: 10.1523/JNEUROSCI.18-22-09539.1998. [DOI] [PMC free article] [PubMed] [Google Scholar]
- Maurice N, Deniau JM, Menetrey A, Glowinski J, Thierry AM. Prefrontal cortex-basal ganglia circuits in the rat: involvement of ventral pallidum and subthalamic nucleus. Synapse. 1998b;29:363–370. doi: 10.1002/(SICI)1098-2396(199808)29:4<363::AID-SYN8>3.0.CO;2-3. [DOI] [PubMed] [Google Scholar]
- McQuarrie D, Fengl E. Effects of single doses and chronic administration of ethanol on experimental seizures in mice. J Pharmacol Exp Ther. 1958;124:264–271. [PubMed] [Google Scholar]
- Metten P, Belknap JK, Crabbe JC. Drug withdrawal convulsions and susceptibility to convulsants after short-term selective breeding for acute ethanol withdrawal. Behav Brain Res. 1998;95:113–122. doi: 10.1016/s0166-4328(97)00216-7. [DOI] [PubMed] [Google Scholar]
- Morgan JI, Cohen DR, Hempstead JL, Curran T. Mapping patterns of c-fos expression in the central nervous system after seizure. Science. 1987;237:192–197. doi: 10.1126/science.3037702. [DOI] [PubMed] [Google Scholar]
- Morgan PF, Nadi NS, Karanian J, Linnoila M. Mapping rat brain structures activated during ethanol withdrawal: role of glutamate and NMDA receptors. Eur J Pharmacol. 1992;225:217–223. doi: 10.1016/0922-4106(92)90023-o. [DOI] [PubMed] [Google Scholar]
- Moshé SL, Albala BJ. Nigral muscimol infusions facilitate the development of seizures in immature rats. Brain Res. 1984;315:305–308. doi: 10.1016/0165-3806(84)90165-2. [DOI] [PubMed] [Google Scholar]
- Moshé SL, Brown LL, Kubová H, Velísková J, Zukin RS, Sperber EF. Maturation and segregation of brain networks that modify seizures. Brain Res. 1994;665:141–146. doi: 10.1016/0006-8993(94)91164-9. [DOI] [PubMed] [Google Scholar]
- Mura A, Murphy CA, Feldon J, Jongen-Relo AL. The use of stereological counting methods to assess immediate early gene immunoreactivity. Brain Res. 2004;1009:120–128. doi: 10.1016/j.brainres.2004.02.054. [DOI] [PubMed] [Google Scholar]
- Narabayashi H. Pallidotomy revisited. Analysis of posteroventral pallidotomy. Stereotact Funct Neurosurg. 1997;69:54–61. doi: 10.1159/000099852. [DOI] [PubMed] [Google Scholar]
- Nikolaus S, Huston JP, Hasenöhrl RU. Anxiolytic-like effects in rats produced by ventral pallidal injection of both N- and C-terminal fragments of substance P. Neurosci Lett. 2000;283:37–40. doi: 10.1016/s0304-3940(00)00902-2. [DOI] [PubMed] [Google Scholar]
- Pasini A, Tortorella A, Gale K. The anticonvulsant action of fluoxetine in substantia nigra is dependent upon endogenous serotonin. Brain Res. 1996;724:84–88. doi: 10.1016/0006-8993(96)00291-0. [DOI] [PubMed] [Google Scholar]
- Paxinos G, Franklin K. The mouse brain in stereotaxic coordinates. Ed 2. Orlando, FL: Academic; 2001. [Google Scholar]
- Ravizza T, Friedman LK, Moshé SL, Velísková J. Sex differences in GABA(A)ergic system in rat substantia nigra pars reticulata. Int J Dev Neurosci. 2003;21:245–254. doi: 10.1016/s0736-5748(03)00069-8. [DOI] [PubMed] [Google Scholar]
- Reilly MT, Milner LC, Shirley RL, Crabbe JC, Buck KJ. 5-HT2C and GABAB receptors influence handling-induced convulsion severity in chromosome 4 congenic and DBA/2J background strain mice. Brain Res. 2008;1198:124–131. doi: 10.1016/j.brainres.2008.01.024. [DOI] [PMC free article] [PubMed] [Google Scholar]
- Rick CE, Stanford IM, Lacey MG. Excitation of rat substantia nigra pars reticulata neurons by 5-hydroxytryptamine in vitro: evidence for a direct action mediated by 5-hydroxytryptamine 2C receptors. Neuroscience. 1995;69:903–913. doi: 10.1016/0306-4522(95)00283-o. [DOI] [PubMed] [Google Scholar]
- Ripley TL, Borlikova G, Lyons S, Stephens DN. Selective deficits in appetitive conditioning as a consequence of ethanol withdrawal. Eur J Neurosci. 2004;19:415–425. doi: 10.1111/j.0953-816x.2003.03114.x. [DOI] [PubMed] [Google Scholar]
- Robledo P, Féger J. Excitatory influence of rat subthalamic nucleus to substantia nigra pars reticulata and the pallidal complex: electrophysiological data. Brain Res. 1990;518:47–54. doi: 10.1016/0006-8993(90)90952-8. [DOI] [PubMed] [Google Scholar]
- Shehab S, Simkins M, Dean P, Redgrave P. Regional distribution of the anticonvulsant and behavioural effects of muscimol injected into the substantia nigra of rats. Eur J Neurosci. 1996;8:749–757. doi: 10.1111/j.1460-9568.1996.tb01260.x. [DOI] [PubMed] [Google Scholar]
- Shi LH, Luo F, Woodward DJ, McIntyre DC, Chang JY. Temporal sequence of ictal discharges propagation in the corticolimbic basal ganglia system during amygdala kindled seizures in freely moving rats. Epilepsy Res. 2007;73:85–97. doi: 10.1016/j.eplepsyres.2006.08.008. [DOI] [PMC free article] [PubMed] [Google Scholar]
- Shinonaga Y, Takada M, Mizuno N. Direct projections from the central amygdaloid nucleus to the globus pallidus and substantia nigra in the cat. Neuroscience. 1992;51:691–703. doi: 10.1016/0306-4522(92)90308-o. [DOI] [PubMed] [Google Scholar]
- Shirley RL, Walter NA, Reilly MT, Fehr C, Buck KJ. Mpdz is a quantitative trait gene for drug withdrawal seizures. Nat Neurosci. 2004;7:699–700. doi: 10.1038/nn1271. [DOI] [PubMed] [Google Scholar]
- Squire LR, Bayley PJ. The neuroscience of remote memory. Curr Opin Neurobiol. 2007;17:185–196. doi: 10.1016/j.conb.2007.02.006. [DOI] [PMC free article] [PubMed] [Google Scholar]
- Strassman AM, Vos BP. Somatotopic and laminar organization of fos-like immunoreactivity in the medullary and upper cervical dorsal horn induced by noxious facial stimulation in the rat. J Comp Neurol. 1993;331:495–516. doi: 10.1002/cne.903310406. [DOI] [PubMed] [Google Scholar]
- Thompson K, Anantharam V, Behrstock S, Bongarzone E, Campagnoni A, Tobin AJ. Conditionally immortalized cell lines, engineered to produce and release GABA, modulate the development of behavioral seizures. Exp Neurol. 2000;161:481–489. doi: 10.1006/exnr.1999.7305. [DOI] [PubMed] [Google Scholar]
- Van Der Kooy D, Hattori T. Single subthalamic nucleus neurons project to both the globus pallidus and substantia nigra in rat. J Comp Neurol. 1980;192:751–768. doi: 10.1002/cne.901920409. [DOI] [PubMed] [Google Scholar]
- Velísek L, Velísková J, Ravizza T, Giorgi FS, Moshé SL. Circling behavior and [14C]2-deoxyglucose mapping in rats: possible implications for autistic repetitive behaviors. Neurobiol Dis. 2005;18:346–355. doi: 10.1016/j.nbd.2004.10.012. [DOI] [PubMed] [Google Scholar]
- Velísková J, Moshé SL. Sexual dimorphism and developmental regulation of substantia nigra function. Ann Neurol. 2001;50:596–601. doi: 10.1002/ana.1248. [DOI] [PubMed] [Google Scholar]
- Velísková J, Velísek L, Nunes ML, Moshé SL. Developmental regulation of regional functionality of substantial nigra GABAA receptors involved in seizures. Eur J Pharmacol. 1996;309:167–173. doi: 10.1016/0014-2999(96)00341-x. [DOI] [PubMed] [Google Scholar]
- Velísková J, Kubová H, Friedman LK, Wu R, Sperber EF, Zukin RS, Moshé SL. The expression of GABAA receptor subunits in the substantia nigra is developmentally regulated and region-specific. Ital J Neurol Sci. 1998;19:205–210. doi: 10.1007/BF02427602. [DOI] [PubMed] [Google Scholar]
- Velísková J, Miller AM, Nunes ML, Brown LL. Regional neural activity within the substantia nigra during peri-ictal flurothyl generalized seizure stages. Neurobiol Dis. 2005;20:752–759. doi: 10.1016/j.nbd.2005.05.007. [DOI] [PMC free article] [PubMed] [Google Scholar]
- Wilce P, Beckmann A, Shanley B, Matsumoto I. Gene expression during ethanol withdrawal. [Suppl] Alcohol Alcohol. 1994;2:97–102. [PubMed] [Google Scholar]
- Williams AH, Brown WM, Langefeld CD. Multilocus and interaction-based genome scan for alcoholism risk factors in Caucasian Americans: the COGA study. BMC Genet. 2005;6(Suppl 1):S37. doi: 10.1186/1471-2156-6-S1-S37. [DOI] [PMC free article] [PubMed] [Google Scholar]
- Willoughby JO, Mackenzie L, Medvedev A, Hiscock JJ. Distribution of Fos-positive neurons in cortical and subcortical structures after picrotoxin-induced convulsions varies with seizure type. Brain Res. 1995;683:73–87. doi: 10.1016/0006-8993(95)00366-x. [DOI] [PubMed] [Google Scholar]
- Wilson JR, Erwin VG, DeFries JC, Petersen DR, Cole-Harding S. Ethanol dependence in mice: direct and correlated responses to ten generations of selective breeding. Behav Genet. 1984;14:235–256. doi: 10.1007/BF01065544. [DOI] [PubMed] [Google Scholar]