

Abstract
Lipoprotein kinetic parameters are determined from mass spectrometry data after administering mass isotopes of amino acids, which label proteins endogenously. The standard procedure is to model the isotopic content of the labeled precursor amino acid and of proteins of interest as tracer-to-tracee ratio (TTR). It is shown here that even though the administered tracer alters amino acid mass and turnover, apolipoprotein synthesis is unaltered and hence the apolipoprotein system is in a steady state, with the total (labeled plus unlabeled) masses and fluxes remaining constant. The correct model formulation for apolipoprotein kinetics is shown to be in terms of tracer enrichment, not of TTR. The needed mathematical equations are derived. A theoretical error analysis is carried out to calculate the magnitude of error in published results using TTR modeling. It is shown that TTR modeling leads to a consistent underestimation of the fractional synthetic rate. In constant-infusion studies, the bias error percent is shown to equal approximately the plateau enrichment, generally <10%. It is shown that, in bolus studies, the underestimation error can be larger. Thus, for mass isotope studies with endogenous tracers, apolipoproteins are in a steady state and the data should be fitted by modeling enrichments.
Supplementary key words: amino acid metabolism, fractional synthetic rate, mass isotopes, tracer kinetics, tracer-to-tracee ratio, precursor-product relationship
Beginning in the 1970s, apolipoprotein kinetics were routinely studied with exogenous tracers, for instance by isolating VLDL or LDL from a subject, radioiodinating it, and injecting it back into the subject (1–4). Endogenous labeling, with a labeled precursor of the metabolite of interest, has the virtue of labeling the synthetic pathways and not altering tracer metabolic properties, as might happen with exogenous labeling. Whole body cholesterol metabolism was studied with tritiated water (5), and tri-tiated leucine has been used to study lipoprotein kinetics (6–8). Highly sensitive gas chromatography-mass spectrometry and refinements thereof, and the availability of synthetic amino acids and other molecules that are multiply labeled with mass isotopes, have altered the field to the point that endogenous labeling with mass isotopes is now the norm in human turnover studies (9).
An important aspect of mass isotopes is that the amount of tracer introduced is not negligible in relation to the amount in plasma of the tracee. Cobelli, Toffolo, and Foster (10) and Foster et al. (11) considered this problem and advocated the use of tracer-to-tracee ratio (TTR) in place of the previously standard use of tracer enrichment in atoms percent excess or moles percent excess (12–15). Since then, nearly all investigators have used TTR in analyzing mass isotope data to calculate lipoprotein turnover parameters. In what follows, we revisit this issue and derive the mathematical relationships needed for the analysis of tracer data from endogenous labeling. In particular, we show that the apolipoprotein system is in a steady state and that the correct formulation is in terms of tracer enrichment or concentration, not TTR. We show that compartmental models and the usual fractional synthetic rate (FSR) equations are valid provided that they are written for tracer enrichments but not for TTRs. The error in using TTR is shown for constant-infusion studies to be in the range of the plateau tracer enrichment, usually 5–10%; the error is shown to be higher for bolus studies.
The word “enrichment” (E) is used here solely to denote tracer concentration, defined as the amount of tracer divided by the sum of the amounts of tracer and tracee (16). The word is used sometimes to denote TTR, but not here.
CONSTANT TRACEE FLUX IMPLIES THAT PROTEIN AMOUNT CHANGES WITH TIME
That mass isotope tracers have nonnegligible mass has been recognized from early on. Matthews et al. (16) adjusted for it by assuming that the total flux is increased by a constant tracer infusion, so that a tracer balance can be written as:
| (Eq. 1) |
where Q is the tracee flux, i is the constant infusion rate of the tracer, Ep is the plasma enrichment of the traced molecule (amino acid in Ref. 16), and Ei is the infusion enrichment. With a radiotracer, because of its negligible mass, there would be no i on the left side of the equation, and the right side would be the infusion rate of radioactivity.
The question relevant to lipoprotein turnover is whether every component of the flux changes similarly. Foster et al. (11) assume that incorporation into specific proteins follows the same pattern. This approach is shown by them to lead to simple equations for protein kinetics. The tracee masses and fluxes are constant, and linear differential equations can be written for TTR, the equations identical in form to those written for radiotracers.
Figure 1 shows the essential part of their model (Fig. 1 in Ref. 11) for leucine incorporation into VLDL apolipoprotein B (apoB), leaving out other pathways. Before tracer infusion, there is Uleu of unlabeled leucine, being incorporated into VLDL apoB with a rate constant of kleu; UB is the tracee mass of VLDL apoB. During the tracer study, by the assumption of tracee steady state, Uleu, kleu, and UB do not change; at any time t, there is mleu(t) of tracer, being incorporated into labeled VLDL apoB with the same rate constant as the tracee, kleu. [Since an apoB molecule has multiple leucine molecules, a labeled leucine combines with unlabeled leucine in the same apoB molecule, so this model is not precise, but it is easily rectified by combining the two apoB pools into one. None of the results below are affected, and the figure is drawn to be close to Fig. 1 in Foster et al. (11).] Thus, the constant tracee flux assumption predicts that, compared with the steady state before the study, more leucine should be incorporated into VLDL apoB during the tracer study and the total amount of VLDL apoB should increase correspondingly. If the TTR of leucine in VLDL apoB approaches 5%, which is typical, then, under the constant tracee flux assumption, VLDL apoB mass should be higher by 5% at the end of the constant infusion.
Fig. 1.
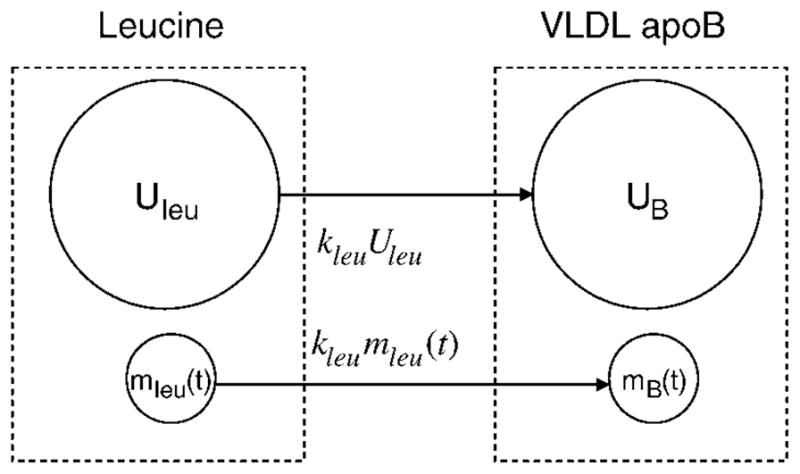
Adapted from Ref. 11 to show the essential part of their Fig. 1. Leucine pools and synthesis of a protein of interest [e.g., VLDL apolipoprotein B (apoB)]. The larger pool is for the tracee, and the smaller pool is for the tracer. Under the assumption of tracee steady state, tracee incorporation into VLDL apoB is unaltered during the study, but tracer mass and incorporation change with time, indicated by (t); the tracer incorporation rate constant is the same as for the tracee. Other pathways for leucine and for VLDL apoB are not shown. The dashed rectangles denote total leucine and VLDL apoB.
THE CONSTANT TRACEE FLUX ASSUMPTION LEADS TO A CONTRADICTION
There are two reasons why the assumption of constant tracee masses and fluxes may be invalid. One is that the assumption of constant tracee flux, applied simultaneously to multiple amino acids, leads to a contradiction. The other is that there is evidence that apolipoprotein synthesis is unaltered by tracer infusion. These reasons are elaborated on below.
Consider a study with a primed constant infusion of a tracer of leucine and a simultaneous bolus injection of a tracer of glycine, as in Parhofer et al. (17). Figure 2A shows three amino acids that go into the synthesis of apoB. The assumption that the tracee remains in a steady state can be applied to each of the three amino acids. The incorporation from each tracee pool is shown as constant, whereas the incorporation from each tracer pool varies with time, denoted by (t). Figure 2B shows the hypothetical total rate of incorporation of each precursor (tracer plus tracee) resulting from the assumption of tracee steady state. The values before tracer infusion are at the mol%s of the three amino acids in apoB. The total incorporation rate of leucine increases to a higher steady state, that of glycine increases sharply and declines with the clearance of the glycine tracer, and that of alanine remains unchanged. Thus, if the tracee fluxes are constant, the relative amounts of leucine, glycine, and alanine in newly synthesized apoB begin at the known values for apoB, but soon after the tracer study begins, newly synthesized apoB has 14% leucine and 9% glycine, the percentages changing every moment, a stoichiometric impossibility as this would mean a changing amino acid composition of the protein.
Fig. 2.

Schemata of three amino acid precursors, and their rates of incorporation into a specific apolipoprotein in a hypothetical study with a primed constant infusion of a tracer of leucine and a simultaneous bolus injection of a tracer of glycine. Under the assumption of tracee steady state, A shows the precursor pools, with the small pools representing tracers. If the tracee (unlabeled) masses Uleu, Ugly, and Uala are constant, the rates of incorporation vary with time, as given by the formulas under the arrows and as shown in B. The numbers along the y axis are in arbitrary units. The curves begin at the leucine, glycine, and alanine contents of apolipoprotein B before tracer infusion. Soon after 0 h, leucine is at 14 instead of 12.5, and glycine is at 9 instead of 4.5, resulting in a changing stoichiometry of the apoB product, an impossibility. C shows the tracer-to-tracee ratio (TTR) data from Fig. 4 of Parhofer et al. (17), presented here, under the assumption of tracee steady state, as the change in total mass of VLDL apoB. If tracee apoB were constant, total apoB increased by nearly 4% to a new steady level, according to the leucine TTR data, whereas the glycine TTR data would suggest that total apoB increased quickly by nearly 4% and then declined. The dashed horizontal line indicates that an untraced amino acid should be interpreted as no change in VLDL apoB. Thus, the assumption of a tracee steady state is contradicted by the data of Parhofer et al. (17). AA, amino acid.
This can also been seen in the composition of the product, VLDL apoB. Under the assumption of constant tracee mass, the TTR in VLDL apoB leucine or glycine is equivalent to the change in total VLDL apoB. If leucine TTR is 4% at some time, then VLDL apoB at that moment is 4% higher than before the study. Likewise, if glycine TTR in VLDL apoB is 2%, then VLDL apoB is up by 2% at that moment. For an amino acid such as alanine, there is no tracer and so total VLDL apoB should be unchanging. Figure 2C shows the VLDL apoB TTR data from Parhofer et al. (17), with the TTR values presented here, under the tracee constancy assumption, as changes in total VLDL apoB mass. The horizontal line indicates that an untraced amino acid such as alanine would imply no change in VLDL apoB. The three curves in Fig. 2C show very different behaviors for total VLDL apoB. Thus, the data of Parhofer et al. (17) are inconsistent with the tracee steady state assumption. The data of Demant et al. (18), with simultaneous leucine bolus and phenylalanine constant infusion, would also support this conclusion. Indeed, any double-tracer study in which the TTRs of the two tracers in VLDL apoB are not identical contradicts the assumption of tracee steady state.
APOLIPOPROTEIN SYNTHESIS UNAFFECTED BY AMINO ACID INFUSION
The other reason for the likely invalidity of a constant tracee flux to apolipoproteins is that there is no evidence that infusion of a single amino acid affects apolipoprotein synthesis. Apolipoprotein synthesis is regulated by many factors affecting transcription, mRNA stability, translation, and posttranslational degradation, but a single amino acid availability is not known to be such a factor.
Cohn et al. (14) and Lichtenstein et al. (19) measured VLDL apoB a number of times during a 15 h constant-infusion study. No time trend in VLDL apoB mass was seen, whereas VLDL apoB TTR increased to ~6%. This constancy has been replicated in a number of studies by that group (20–23), in which multiple VLDL apoB fractions were obtained during the study. Other studies (24–31) have also found no change in apolipoprotein concentrations during constant-infusion studies. There appear to be no reports of an increase in VLDL apoB mass during a constant-infusion study.
Davis and coworkers (32) have shown in pigs that, once the neonatal phase is over, amino acid infusion or protein intake increases muscle protein synthesis, but the effect on liver protein synthesis is quite modest, as was found earlier in rats (33, 34). Of particular relevance to apolipoproteins, Motil et al. (35) studied two different protein intakes in five women and found that leucine oxidation increased with protein intake but lysine incorporation into apoB did not. These animal and human studies are consistent with cell culture studies showing that a significant fraction of newly synthesized apoB is degraded, with secretion determined largely by lipid availability (36). Intracellular apoB degradation has been estimated by compartmental modeling to be ~90% in HepG2 cells (37, 38) and >30% in primary hepatocytes (39).
Thus, there is no reason to expect that a tracer amino acid infusion alters apolipoprotein synthesis. Assuming that apolipoprotein synthesis is unaltered by tracer infusion avoids the contradiction implied by the constant tracee flux assumption and is consistent with the published data cited above.
PRECURSOR ENRICHMENT IS FORCING FUNCTION FOR APOLIPOPROTEIN KINETICS
We next show that the introduction of tracer alters tracee incorporation (as opposed to the total of tracer and tracee) into apolipoproteins. Consider Fig. 3, which shows, for amino acid 1, the tracer with mass m1(t) and tracee with mass U1(t) at the site of synthesis of the apolipoprotein of interest. The rate of incorporation into the protein remains at f1S before and after tracer is introduced, where S is the protein synthesis and f1 is the fraction from amino acid 1. Since the tracer and tracee are indistinguishable, the tracer incorporation rate is obtained simply by multiplying f1S by the tracer fraction of the pool, , which is the enrichment Ep(t) of the precursor pool. The tracee incorporation rate, therefore, is (1 − Ep(t))f1S, compared with f1S in the absence of tracer.
Fig. 3.

The tracer and tracee precursor pools for an amino acid whose tracer is introduced. Both pool sizes can vary with time, indicated by (t), but the total (tracer plus tracee) incorporation rate into an apolipoprotein is unchanged. The separate incorporation rates of tracer and tracee are proportional to their respective masses, as given by the formulas. The fluxes on other pathways, such as oxidation, clearance, or other storage pools, may bear different relationships to the masses, as indicated by question marks to mean “unknown.”
Thus, for any apolipoprotein, after tracer infusion: 1) the apolipoprotein synthesis and the rate of incorporation from each amino acid remain unaltered; 2) tracee flux to the apolipoprotein is altered; and 3) tracer flux to the apolipoprotein equals precursor pool enrichment multiplied by the incorporation rate of that amino acid.
These points are illustrated by the bar graphs in Fig. 4; tracer content is shown by hatched areas. Two experimental designs are considered. The left panels are for a primed constant infusion. The top left panel shows the mass of free amino acid in the precursor pool at four different times. There is no tracer at time zero; with the introduction of tracer, the total mass increases and remains at a constant level from 1 to 15 h, as does the mass of tracer. The middle left panel shows the rate of apolipoprotein synthesis at the four times. The total synthesis, S, remains constant, whereas a fraction of the synthesis is labeled after time zero. By the principle of isotopic indistinguishability (40), the tracer fraction of the synthesis equals the tracer fraction in the precursor pool:
| (Eq. 2) |
where S stands for synthetic rate (mass/time), P stands for the amount of precursor (free amino acid), the subscript L refers to the label, T refers to the total mass, C refers to the constant-infusion design, and 1, 8, and 15 refer to the time. The bottom left panel shows the mass of amino acid in the apolipoprotein of interest at the four times. The total amount, M, remains constant, whereas an increasing fraction of the mass is labeled over 15 h, approaching the fraction in the precursor pool (and the synthetic pathway) given in Eq. 2.
Fig. 4.

Schematic bar graphs showing the changes with time in precursor amino acid (P), incorporation rate into apolipoprotein (S), and amino acid (AA) in apolipoprotein (M) for two types of tracer studies. The full height of each bar represents the total of tracer and tracee, whereas the hatched portion is for the tracer. The subscript T stands for total (tracer plus tracee), L stands for tracer (label), C stands for constant infusion, B stands for bolus, and 1, 8, and 15 indicate 1, 8, and 15 h. The left panels are for a primed constant infusion. The upper left panel shows that the tracer in the precursor increases and stays at a constant fraction from 1 to 15 h. The middle left panel shows that apolipoprotein incorporation is unchanged, with the tracer contributing that same fraction from 1 to 15 h. The bottom left panel shows that the apolipoprotein mass remains the same while the amount of label increases from 0 to 1 to 8 h, approaching a plateau at 15 h. The right panels are for a bolus study. The upper right panel shows that the tracer in the precursor increases and then declines from 1 to 15 h. The middle right panel shows that the apolipoprotein incorporation is unchanged, with the tracer contributing a fraction equal to its fraction in the precursor. The bottom right panel shows that the apolipoprotein mass remains the same while the amount of label increases from 0 to 1 h and then decreases to 15 h.
The right side of Fig. 4 is for a bolus injection. The top right panel shows the mass of free amino acid in the precursor pool at the four times. The difference from constant infusion is that there is a much greater perturbation at 1 h, with a high tracer content that decreases with time. The middle right panel shows the rate of apolipoprotein synthesis at the four times. As with constant infusion, total synthesis, S, remains constant, whereas the labeled fraction increases and decreases with the precursor pool:
| (Eq. 3) |
where the subscript B refers to the bolus injection design. This is analogous to Eq. 2. The bottom right panel shows the mass of amino acid in the apolipoprotein of interest at the four times. As with constant infusion, the total amount, M, remains constant, whereas the labeled fraction changes over 15 h.
Figure 4 illustrates how, with a constant-infusion or bolus study, the precursor amino acid pool can be in an unsteady state while apolipoprotein synthesis and mass remain constant, with the rate of tracer incorporation proportional to tracer enrichment in the precursor.
UNSTEADY-STATE PRECURSOR/ STEADY-STATE APOLIPOPROTEIN
These ideas are summarized in the schematic model in Fig. 5 for the kinetics of an amino acid and an apolipoprotein of interest. The model is similar to that used by many researchers for apoB (41–44). The details, regarding the number of pools and their connectivity, may vary with the apolipoprotein being studied and with the mode of tracer administration. The key element here is the dashed horizontal line that separates the free amino acid model from the apolipoprotein model. Before the tracer study, the study subject is in a steady state: that is, the masses and fluxes of the free amino acid and of the protein are constant with time. When the mass isotope tracer is introduced, it clearly increases the total amount of the free amino acid in plasma. This may or may not lead to changes in the rate constants and alter the masses and fluxes of the unlabeled free amino acid as well as of the total (labeled plus unlabeled) amino acid. Modeling amino acid turnover has been described by Cobelli et al. (40). Clearly, the free amino acid part of the system is in an unsteady state.
Fig. 5.

Scheme of the amino acid and apolipoprotein systems. When a tracer is introduced, that amino acid is in an unsteady state, but the apolipoprotein remains in a steady state. The dashed line separates the unsteady amino acid system from the steady apolipoprotein system. The number of pools is for illustrative purposes. The unaltered synthesis paths are shown by double arrows. Total masses are denoted by M, and fluxes are denoted by R. Tracer masses are denoted by m; labeled fluxes, which equal the corresponding total fluxes multiplied by the source pool enrichments, are given in terms of total fluxes and tracer-to-total mass ratios or enrichments. For instance, the total flux from protein pool 1 to pool 2 is R21, and the corresponding tracer flux is R21m1(t)/M1, or R21 multiplied by the tracer enrichment in pool 1. Tracer quantities are shown in italics, below or to the right of the corresponding total quantities.
We next consider the double arrows crossing the horizontal line, indicating synthesis or incorporation of the amino acid into the apolipoprotein of interest (two arrows are given to allow for the possibility of synthesis into multiple lipoprotein fractions). This flux (mass per unit of time) is not limited by the amount of a single amino acid in the precursor pool. Whether the mass of that pool increases by 5% or even by 100%, it is not rate-limiting for apolipoprotein synthesis; hence, the total synthetic flux (labeled plus unlabeled) is not affected.
Moving down to the apolipoprotein part of the model, since the synthetic rates are not affected, the total (labeled plus unlabeled) masses and fluxes of the apolipoprotein remain constant during the tracer study. Thus, there is a steady state for total apolipoprotein. As labeled amino acid is incorporated into protein, the tracer content of the protein masses will change, much as with exogenous tracers.
KEY FEATURES OF ENDOGENOUS LABELING
Thus, the key features of endogenous labeling, with radioactive or mass isotopes, are as follows.
1) By using a labeled precursor, not rate-limiting for the synthesis of the apolipoprotein of interest, even in nontracer amounts (whether as a bolus or as a primed constant infusion), the synthetic pathways are labeled without affecting the steady state of the apolipoprotein: the masses, fluxes, and rate constants of apolipoprotein turnover are not affected.
2) In contrast, the precursor itself is in an unsteady state, with the introduction of the label altering the total masses and possibly fluxes and/or rate constants.
3) The kinetics of the apolipoprotein differ in a subtle way from those of an exogenous radiolabel, in which the amount of tracer is so small that the tracee (unlabeled) masses, fluxes, and rate constants may be assumed to be constant. With endogenous labeling with a mass isotope, the total masses, fluxes, and rate constants do not change but the amounts of tracer and tracee do change in the course of the study.
MATHEMATICAL MODELING OF APOLIPOPROTEIN KINETICS
Since mass isotopes, unlike radiotracers, have significant mass, it is possible that conventional pool models may not apply. We first show that, since the apolipoprotein system is in a steady state, with constant total masses and fluxes, it is possible to use pool models for tracer enrichment. Consider Fig. 5, which shows two protein pools both receiving newly synthesized protein. Total (labeled plus unlabeled) masses are denoted by M, total fluxes by R, and tracer masses by m. As in Fig. 3, tracer fluxes equal total fluxes multiplied by the source pool enrichments. For instance, the total flux from protein pool 1 to pool 2 is R21, and the corresponding tracer flux is R21m1(t)/M1, or R21 multiplied by y1(t), the tracer enrichment in pool 1. (Tracer quantities are shown in italics, below or to the right of the corresponding total quantities.) The rate of change of m1(t), tracer mass in pool 1, is given by a differential equation:
| (Eq. 4) |
where w(t) is the precursor enrichment, equal to m0(t)/M0(t). The equation can be rewritten in terms of tracer enrichment, since m1(t) equals M1y1(t), and M1 is constant:
| (Eq. 5) |
where L values are rate constants, with Lij defined as the flux into pool i from pool j divided by the mass of pool i. Proceeding similarly, a differential equation for tracer enrichment in pool 2 is obtained:
| (Eq. 6) |
It is seen that the differential equations 5 and 6 are linear and stationary with constant coefficients, identical to what would be obtained with exogenous tracers. Thus, although mass isotopes introduce a nonnegligible mass into the precursor pools, the apolipoprotein system is modeled as with exogenous tracers (45–49).
| (Eq. 7) |
is the classic pool model in matrix-vector notation, where y(t) is the tracer enrichment vector in moles percent excess, A is the matrix of rate constants (Aii is the negative of the total flux out of pool i divided by the mass of that pool, and Aij is the flux into pool i from pool j divided by the mass of pool i), si is the direct synthetic flux into pool i divided by the mass of pool i, and w(t) is the precursor tracer enrichment function, which may not be describable by a pool model since the precursor system is in an unsteady state.
To clarify, consider a single pool for a protein, as is done in modeling apolipoprotein [a] (50) or apoC-III (51). The mass balance for the tracer is written as:
| (Eq. 8) |
where S is the synthetic rate, equal to R, the flux out of the pool. Since the protein is in a steady state, M is constant, and so the equation can be rewritten as:
| (Eq. 9) |
With a primed constant infusion, if the precursor enrichment w can be assumed constant, an analytical solution is available:
| (Eq. 10) |
Both w and y are tracer enrichments.
It is not possible to write a linear differential equation for TTR because tracee mass and flux are not constant. The equation for TTR analogous to equation 8 is the following:
| (Eq. 11) |
| (Eq. 12) |
This is a nonlinear differential equation, which has to be solved along with a separate differential equation for Mu(t), the subscript u denoting the unlabeled tracee. In general, there is no simple solution.
Thus, the linear differential equations with constant coefficients used in various modeling programs such as SAAM (49) and Poolfit (52) are valid only for tracer enrichments, not for TTR.
MATHEMATICAL MODELING OF PRECURSOR KINETICS
As seen in the top panels of Fig. 4, the precursor is not in a steady state. Total and tracer masses and fluxes are varying with time. Cobelli et al. (40) have discussed various possibilities. We have seen that tracee fluxes to proteins are affected, since the total apolipoprotein synthesis is not altered while part of it gets labeled, as seen in the middle panels of Fig. 4. The modeling of the precursor is quite complex, and data may not be available to do justice to the problem. As Barrett et al. (53) stated, “The kinetics of amino acids are complex, so a possible approach to incorporating plasma amino acid data into the development and fitting of a compartmental model to tracer data is to use a forcing function. In this way, the system can be decoupled and the plasma amino acid data can be used as the source of tracer.” Following their reasoning, the precursor is merely a forcing function. So any model (or even no model) is adequate as long as the observed data for the precursor are fitted well. The data fitted can be TTR or enrichment.
As seen above, the model for apolipoprotein turnover requires precursor tracer enrichment. Therefore, regardless of how the precursor data are fitted, they have to be converted to enrichments for use as w(t) in equation 7 for any apolipoprotein model.
ERROR IN USING TTR
Since most investigators have calculated kinetic parameters from TTR data, and not enrichments, the question arises of the magnitude of error in reported results. Some theoretical analysis is provided here to give an idea of the magnitude of the error.
Since TTR equals E/(1 − E), it is always greater than E. We can also compare the shapes of the two curves by looking at the time derivative of TTR:
| (Eq. 13) |
Since the denominator on the right side is always <1, the slope of TTR is always greater in magnitude than that of E: if E is increasing, TTR increases faster; if E is decreasing, TTR decreases faster. Figure 6A shows an illustration of this for a single pool receiving a bolus injection (the rest of the figure will be described below).
Fig. 6.

In a bolus study, precursor TTR is higher and sharper than precursor tracer enrichment (E). A: Theoretical situation with a single precursor pool whose enrichment declines monoexponentially. B: TTR data taken from Parhofer et al. (17) and enrichments calculated from their TTR data, along with fitted curves. The area under the TTR curve is 39% higher in A and 35% higher in B than the corresponding area under the enrichment curve. This overestimation of the forcing function leads to an underestimate of fractional synthetic rates with TTR modeling.
The error in using TTR instead of enrichment E is given by: error = TTR − E. The error is a positive bias, which can be expressed as a fraction:
| (Eq. 14) |
Thus, the TTR curve is greater than the E curve by a fraction that equals TTR. If TTR is 10%, then E is 9.09%, and the error is 0.91%, which is 10% of the enrichment. The relative error increases from zero at zero enrichment to a maximum at the peak.
We consider three simple situations that are amenable to theoretical analysis. In what follows, FSRTTR is used to denote the FSR computed by TTR modeling, and FSRE denotes the correct FSR from modeling enrichment.
ERROR IN FSRTTR OF A SINGLE RAPID POOL WITH A CONSTANT INFUSION
Many investigators have used primed constant infusion and modeled the apolipoprotein of interest by a single pool (29, 30, 41, 50, 54–70). The FSR is calculated by fitting the TTR data by an increasing exponential:
| (Eq. 15) |
where r is the FSR of interest. However, the modeling should be done for enrichment, which leads to:
| (Eq. 16) |
where k is the true FSR, E is the enrichment, and P is the plateau enrichment of the precursor, E and P expressed as fractions. TTR is given by:
| (Eq. 17) |
This is not a simple increasing exponential, but for the usual values of P (<0.1), it can be fitted by an increasing exponential quite adequately, which may be a reason that this error has not been reported. A general result for the error is not available; individual data sets have to be fitted both ways to calculate the errors. However, if we assume that the initial increase of the TTR data is well fitted by an increasing exponential, the initial slope of the fitted curve (equation 15) must equal that of the true TTR response (equation 17). By equating the time derivatives of the two equations, we get:
| (Eq. 18) |
At very early times, this becomes, approximately
| (Eq. 19) |
which leads to r = k(1 − P).
Thus, the FSR calculated by fitting the TTR data by an increasing exponential roughly equals the true FSR multiplied by (1 − P), an underestimate by a fraction roughly equal to the plateau enrichment.
ERROR IN FSRTTR OF SLOWLY TURNING-OVER APOLIPOPROTEINS WITH A CONSTANT INFUSION
Some studies have used primed constant infusions and looked at slowly turning-over apolipoproteins such as LDL apoB, apoC-III, and apolipoprotein [a], proteins whose enrichments show a linear increase with time during the course of the study; the FSR has been calculated in a “model-free” approach by fitting the early TTR data by a straight line and dividing the slope by the precursor TTR (19, 71–73):
| (Eq. 20) |
The correct model-free method is to use the enrichment plateau and slope:
| (Eq. 21) |
As shown above, the TTR denominator has a positive bias equal to plateau(TTR). The numerator, being a slope estimated by fitting a number of points, is more complicated to analyze. The ideal situation, in which protein enrichment data are available continuously from zero until the maximum on the linear portion, is solved in Appendix 1:
| (Eq. 22) |
where g is the highest enrichment reached in the protein. Table 1 shows the error in a slow FSR calculated from TTR modeling. It is seen that the protein enrichment has little influence on the error, which is primarily determined by the error in the plateau. Thus, FSR from TTR data underestimates the true FSR of a slow pool by roughly the plateau enrichment(e.g., if the plateau enrichment is 10%, FSR from TTR underestimates the true FSR of a slow pool by ~10%). The result is similar to that obtained for a fast apolipoprotein pool in equation 19.
TABLE 1.
Bias error in FSR using TTR slope/plateau instead of enrichment values
| g, Top of Line | Plateau Enrichment
|
|||
|---|---|---|---|---|
| 5 | 8 | 10 | 15 | |
| % | % | |||
| 0.1 | −4.93 | −7.93 | −9.93 | −14.94 |
| 0.5 | −4.64 | −7.65 | −9.66 | −14.68 |
| 1.0 | −4.28 | −7.30 | −9.32 | −14.36 |
FSR, fractional synthetic rate; TTR, tracer-to-tracee ratio. The column heads give four typical plateau enrichment values. The left column gives three possible values for the top enrichment on the linear portion of the apolipoprotein enrichment data. The other columns give the bias error in percent in computing FSR from TTR data for each combination of plateau enrichment and g. Thus, if the enrichment plateau is 10% and the linear portion increases from 0 to 0.5%, FSR calculated from the TTR plateau and the slope of the TTR data will be 9.66% lower than the correct FSR (from the enrichment plateau and the slope of the enrichment data).
ERROR IN FSRTTR OF SLOWLY TURNING-OVER APOLIPOPROTEINS WITH A BOLUS INJECTION
For a slowly turning-over apolipoprotein, we can ignore the clearance of tracer from that protein during the study so that the amount of tracer in the protein at the end of the study can be equated to the amount incorporated from the precursor over the duration of the study:
| (Eq. 23) |
The equation can be solved for the true FSR:
| (Eq. 24) |
(The equation simplifies to equation 21 when the precursor is at a constant level.) With TTR modeling, which assumes that the tracee mass and flux are constant, the equation above is derived with TTR in place of E:
| (Eq. 25) |
It is shown in Appendix 2 that, for a single pool for the precursor, it is possible to get an estimate of the error in FSR from TTR data:
| (Eq. 26) |
where c is the initial precursor enrichment. The error can be quite significant. As the magnitude of the bolus increases, the value of c increases and the integral ratio gets smaller, so the error is worse. For a small bolus, c may be 0.1, the integral ratio is 0.95, which means a small error from using TTR modeling. For a larger bolus, c may be 0.5 (TTR of 1), which is quite common (17, 18, 74), the integral ratio is 0.72, which means TTR modeling will underestimate the true FSR of a slowly turning-over apolipoprotein by >25%.
The underestimation error with TTR modeling appears to be larger in a bolus study than in a primed constant-infusion study. The reason is that the precursor TTR is generally <10% during a constant-infusion study, so the error in considering it as enrichment is <10% as well; on the other hand, in the early part of a bolus study, the precursor TTR can exceed 100%, which means an error of >100% if TTR is used as the forcing function.
ERRORS IN RATE CONSTANTS IN A MULTICOMPARTMENTAL MODEL
With more complex models, a theoretical error analysis appears impossible. There is no simple formula for the errors that arise from TTR modeling. The data from an individual study have to be refitted by modeling enrichments and the new model parameters compared with the earlier results from TTR modeling.
One published study (75), from the author’s group, was available for reanalysis. This was a paired study in eight subjects of VLDL triglyceride (TG), plasma apoC-III, and VLDL/intermediate density lipoprotein (IDL)/LDL apoB turnover using a bolus of radiolabeled glycerol, a primed constant infusion of isotopic leucine, and a bolus of isotopic phenylalanine. The reanalysis by fitting enrichments instead of TTR resulted in slightly higher fractional catabolic rates (FCRs), as expected: 46 of 48 apoB FCRs were higher, the difference ranging from −3% to +11%. The mean pretreatment and posttreatment apoB FCRs increased from 3.92 to 3.95 and from 4.53 to 4.69 pools/ day, respectively, for VLDL; from 4.06 to 4.27 and from 3.1 to 3.23 pools/day, respectively, for IDL; and from 0.36 to 0.367 and from 0.366 to 0.371 pool/day, respectively, for LDL. Changes in VLDL TG FCRs were similar to those in VLDL apoB FCR, since a combined model for apoB and TG was used to fit apoB enrichment and TG specific radioactivity data simultaneously. Plasma apoC-III FSRs, calculated from straight-line fits (equations 20 and 21 above), increased in every case, the differences ranging from 2.4% to 6.1% and averaging 4.2%, quite close to the prediction from equation 22 for a mean plateau enrichment (P) of 5.9% and peak apoC-III enrichment (g) of 1–2%. The mean pretreatment and posttreatment apoC-III FSRs increased from 0.397 to 0.413 and from 0.294 to 0.308 pool/day, respectively. Treatment effects were essentially unaltered by reanalyzing the data with enrichments. The most significant kinetic parameter P values changed from 0.015 to 0.012 for VLDL TG FCR, changed from 0.052 to 0.027 for VLDL apoB FCR, and stayed at 0.06 for plasma apoC-III FSR.
If one were to extrapolate from the theoretical results developed above, since precursor enrichment is overestimated by using TTR in place of enrichment, rate constants are underestimated by TTR modeling, and the errors are larger in bolus studies. Also, in bolus studies, as was shown theoretically in equation 13 and exemplified in Fig. 6, precursor TTR declines much faster than does precursor enrichment. Thus, using precursor TTR as the forcing function will lead to underestimation of apolipoprotein FSR in fitting protein enrichment data.
TRANSFORMING THE DATA OR THE MODEL
The primary mass spectrometry data are in the form of TTR, whereas the model is in terms of enrichment. From a statistical point of view, it is best if the fitting program can transform model-generated values to TTR and fit to the data. But many programs do not have such a facility. In that case, the primary data, after background correction (16), need to be converted to enrichment before fitting by the model.
DISCUSSION
Most modeling of mass isotope tracer data to study apolipoprotein kinetics is based on two original papers by Cobelli, Toffolo, and Foster (10) and Foster et al. (11). These papers were extremely influential. Nearly all lipoprotein studies with mass isotopes since then, including by this author’s group (75), have modeled TTR. Research groups that modeled enrichments (14, 76–81) switched to TTR modeling (56, 59, 82–87). Only a few groups have continued to model enrichments (88–94); however, one group that modeled TTR (95) has switched recently to modeling enrichments (96, 97).
Although the studies by Cobelli, Toffolo, and Foster (10) and Foster et al. (11) both deal with the nonnegligible mass of mass isotope tracers, they fail to recognize the crucial distinction, illustrated in Fig. 5, between the unsteady state of a precursor and the steady state of the product. Those authors develop their models as if the tracer introduced is the same molecule as the molecule of interest. In fact, the molecule of interest is synthesized from multiple precursor molecules, usually not limited by precursor availability (e.g., cholesterol or a macromolecule such as an apolipoprotein). So the unsteady state of a precursor, caused by the introduction of the tracer, does not alter the steady state of the product. Although Cobelli, Toffolo, and Foster (10) consider multicompartmental models without explicitly considering distinct precursor and product, Foster et al. (11) apply Cobelli’s theory to a precursor-product system, in which the product is an apolipoprotein, but assume incorrectly that the masses and fluxes of the unlabeled tracee, whether as precursor or as product, remain constant during the study. Their stated first assumption is that “The tracee system remains in a steady state during the experiment.” This assumption is clearly stated in their Fig. 2 as well as in the constant tracee masses and fluxes in all of their equations. We have shown here that this assumption leads to a contradiction, seen in Fig. 2B, C. The apolipoprotein steady state is for the total of tracer and tracee.
Parhofer et al. (17) and Demant et al. (18) show the equivalence of bolus and primed constant-infusion studies. Demant et al. (18) also studied three different boluses in a single subject and found that the TTR data, both in plasma and in apolipoproteins, were nearly identical for boluses differing by a factor of 10, after suitable normalization. Their plasma data provide strong support to tracee constancy in the precursor state, as has been assumed in amino acid kinetics and whole body protein turnover (16, 98). Their apoB data are consistent with total apoB or just tracee apoB being constant; the low TTR values cannot distinguish between the two. To establish tracee constancy in an apolipoprotein, it would be necessary to measure the apolipoprotein mass during a constant-infusion study and show that the mass increases along with TTR.
Most lipoprotein turnover studies with mass isotopes have used primed constant infusions (27, 29, 41, 50, 68, 70, 99–103). Our results suggest that the reported FSRs and production rates are underestimates, with the percent error roughly equal to the plateau enrichment percent. In paired studies, it is likely that this underestimation is equal in two studies in the same subject, so conclusions from paired studies are likely to be unchanged when the data are analyzed correctly by modeling enrichments. In studies in which each subject is studied only once and two or more groups are compared, if different subjects’ plateaus are different, the corrections to be made will be different, thus changing the group standard deviations and possibly group differences as well. The effects are expected to be modest.
Bolus studies are popular for the good reason that kinetics are more clearly delineated compared with a constant-infusion study (17, 18, 43, 95). Our results suggest that the errors from using TTR are likely to be greater in bolus studies, since the area under the precursor forcing function can be overestimated considerably, as shown in equation A13 below. For a single pool precursor, an initial precursor TTR of 1.0 can mean an overestimation of the area by 39%. As a second example, Fig. 6B shows the precursor TTR data from Parhofer et al. (17) and also the precursor enrichment data calculated from their TTR data. Each set of data was fitted by a sum of three exponentials and the area calculated to 1 h. The area under the TTR curve was 35% higher than the area under the E curve.
The relatively large errors in the forcing function derived here (equations A10 to A12 below) are for the case in which the plasma amino acid is treated as the immediate precursor of apolipoproteins. After the early publications (17, 104), bolus studies generally invoke an intermediate pool between plasma and liver synthesis (pool 1 in Refs. 9, 18, 43, pool 2 in Ref. 95). It is likely that the error from using precursor TTR is diminished considerably by the very presence of the intermediate pool and/or by making the intermediate pool turn over more slowly than it actually does; the intermediate pool is only a mathematical construct and is not observed. The investigators may find their models simplified considerably with amino acid enrichment.
Some researchers have modeled apolipoprotein enrichment and also used α-ketoisocaproic acid instead of plasma leucine as the precursor (28, 105–107), which should approximate the liver tRNA pool better than does plasma leucine (91, 93). However, they use the precursor TTR and not enrichment as the forcing function. We have shown here that the major source of error when using TTR is from precursor TTR.
Although some of the formulation here is general, the steady state of the product was most clearly demonstrated when the product was an apolipoprotein, as in Fig. 2. For other product molecules, a careful analysis is necessary for each product.
Patterson and coworkers have studied TG kinetics in a wide range of human subjects (31, 108–112) and found that plasma TG levels remain unchanged after a bolus injection of isotopic glycerol, leading them to propose a nonlinear function for the incorporation of glycerol in VLDL TG synthesis, which “ensures that the amount rather than fraction of plasma glycerol or palmitate used for VLDL-TG synthesis remains constant over time” (113). Thus, the VLDL TG system is in a steady state after a glycerol tracer injection, making the results of this paper applicable.
More generally, if the precursor whose tracer is introduced is not rate-limiting for the product of interest, then the results of this paper would be valid: that the precursor is in an unsteady state but the product is in a steady state.
CONCLUSION
The correct method of analyzing lipoprotein turnover data from mass isotope infusions is to express the data as tracer enrichments or moles percent excess and fit by compartmental models for apolipoprotein enrichments, with precursor enrichment as the forcing function. Modeling TTRs results in a consistent underestimate of FSRs. The error is a function of the precursor enrichment: the higher the precursor enrichment, the larger the error. Determining the extent to which this error may have affected results in previous publications that modeled TTR requires a reanalysis of the data.
Acknowledgments
This work was supported by Grants HL-69190 and HL-62705 from the National Heart, Lung, and Blood Institute. The author acknowledges discussions with Henry Ginsberg and William Blaner and a chance conversation with Benoit Lamarche this year at the American Heart Association’s 7th Annual Conference on Arteriosclerosis, Thrombosis and Vasuclar Biology, which made him think about this problem. The author thanks Janak Ramakrishnan for verifying the mathematical results, Steve Holleran for help with the figures, and an anonymous reviewer for insightful comments that helped strengthen the presentation.
Abbreviations
- apoB
apolipoprotein B
- E
enrichment
- FCR
fractional catabolic rate
- FSR
fractional synthetic rate
- M
total (tracer and tracee) mass
- m
tracer mass
- P
amount or plateau level of precursor
- R
total (tracer and tracee) flux
- S
product synthetic rate
- t
time
- TG
triglyceride
- TTR
tracer-to-tracee ratio
- U
unlabeled or tracee mass
APPENDIX 1
We derive here the error in calculating FSR from TTR data for a slowly turning-over apolipoprotein in a primed constant-infusion study. We assume that enrichment is available at all times until time T and that the data are linear over this time range:
| (Eq. A1) |
TTR is then given by:
| (Eq. A2) |
Fitting TTR(t) by a linear function, ct, by linear regression requires the minimization of the integrated squared bt deviation between and ct, a generalization of the usual least squares:
| (Eq. A3) |
At the minimum, the partial with respect to c is zero:
| (Eq. A4) |
Solving for c, we get for the ratio of the TTR slope to the enrichment slope:
| (Eq. A5) |
The integrals can be evaluated analytically (114) to yield:
| (Eq. A6) |
where g equals bt, the enrichment at the upper end of the linear portion.
The formula for the ratio of the two slopes is complex. By applying the infinite series expansion for the logarithm, it can be shown that
| (Eq. A7) |
or, to an approximation,
| (Eq. A8) |
Thus, the TTR slope is very slightly larger than that of the enrichment, since g seldom exceeds 0.02 (2%) for slow pools. Combining the result shown above with equations 20 and 21, and noting that TTR = E/(1 − E), it is possible to derive an approximate expression for the error in FSR from TTR:
| (Eq. A9) |
where P is the precursor enrichment plateau.
APPENDIX 2
We derive here the error in calculating FSR from TTR data for a slowly turning-over apolipoprotein in a bolus study. Dividing equation 25 by equation 24, we get
| (Eq. A10) |
where T is the duration of the study. The first factor on the right side is clearly >1, but since E(T) seldom exceeds 0.01 or 0.02 for a slow pool, it is a small effect. The two integrals, on the other hand, can be quite different. Since TTR is always larger than enrichment (equation 14), the integrand is larger in the denominator, so the integral in the denominator is also larger than that in the numerator. Examples are seen in Fig. 6: the numerator is the area under the enrichment curve, and the denominator is the area under the TTR curve. The TTR curve is always above the enrichment curve; therefore, its area is always larger.
There is no simple formula for the magnitude of the error in general. It is possible, however, to derive it for the case of a single pool for the precursor, illustrated in Fig. 6A:
| (Eq. A11) |
where c is the initial precursor enrichment. Solving (114),
| (Eq. A12) |
It can be shown that the integral ratio comes closest to unity, which is best for TTR modeling to have the smallest error, when T is very large; this can also be seen in Fig. 6, where the biggest difference between TTR and E is at early times. At very large T values, equation 31 simplifies to:
| (Eq. A13) |
References
- 1.Langer T, Strober W, Levy RI. The metabolism of low density lipoprotein in familial type II hyperlipoproteinemia. J Clin Invest. 1972;51:1528–1536. doi: 10.1172/JCI106949. [DOI] [PMC free article] [PubMed] [Google Scholar]
- 2.Phair RD, Hammond MG, Bowden JA, Fried M, Fisher WR, Berman M. Preliminary model for human lipoprotein metabolism in hyperlipoproteinemia. Fed Proc. 1975;34:2263–2270. [PubMed] [Google Scholar]
- 3.Kissebah AH, Alfarsi S, Adams PW, Wynn V. The metabolic fate of plasma lipoproteins in normal subjects and in patients with insulin resistance and endogenous hypertriglyceridaemia. Diabetologia. 1976;12:501–509. doi: 10.1007/BF01219515. [DOI] [PubMed] [Google Scholar]
- 4.Packard CJ, Third JL, Shepherd J, Lorimer AR, Morgan HG, Lawrie TD. Low density lipoprotein metabolism in a family of familial hypercholesterolemic patients. Metabolism. 1976;25:995–1006. doi: 10.1016/0026-0495(76)90129-3. [DOI] [PubMed] [Google Scholar]
- 5.Kekki M, Miettinen TA, Wahlstrom B. Measurement of cholesterol synthesis in kinetically defined pools using fecal steroid analysis and double labeling technique in man. J Lipid Res. 1977;18:99–114. [PubMed] [Google Scholar]
- 6.Beltz WF, Kesaniemi YA, Miller NH, Grundy SM, Zech LA. Studies on the metabolism of apolipoprotein B in hypertriglyceridemic subjects using simultaneous administration of tritiated leucine and radioiodinated very low density lipoprotein. J Lipid Res. 1990;31:361–374. [PubMed] [Google Scholar]
- 7.Stacpoole PW, von Bermann K, Kilgore LL, Zech LA, Fisher WR. Nutritional regulation of cholesterol synthesis and apolipoprotein B kinetics: studies in patients with familial hypercholesterolemia and normal subjects treated with a high carbohydrate, low fat diet. J Lipid Res. 1991;32:1837–1848. [PubMed] [Google Scholar]
- 8.Fisher WR, Venkatakrishnan V, Fisher ES, Stacpoole PW, Zech LA. The 3H-leucine tracer: its use in kinetic studies of plasma lipoproteins. Metabolism. 1997;46:333–342. doi: 10.1016/s0026-0495(97)90262-6. [DOI] [PubMed] [Google Scholar]
- 9.Barrett PH, Chan DC, Watts GF. Design and analysis of lipoprotein tracer kinetics studies in humans. J Lipid Res. 2006;47:1607–1619. doi: 10.1194/jlr.R600017-JLR200. [DOI] [PubMed] [Google Scholar]
- 10.Cobelli C, Toffolo G, Foster DM. Tracer-to-tracee ratio for analysis of stable isotope tracer data—link with radioactive kinetic formalism. Am J Physiol Endocrinol Metab. 1992;262:E968–E975. doi: 10.1152/ajpendo.1992.262.6.E968. [DOI] [PubMed] [Google Scholar]
- 11.Foster DM, Barrett PHR, Toffolo G, Beltz WF, Cobelli C. Estimating the fractional synthetic rate of plasma apolipoproteins and lipids from stable-isotope data. J Lipid Res. 1993;34:2193–2205. [PubMed] [Google Scholar]
- 12.Cryer DR, Matsushima T, Marsh JB, Yudkoff M, Coates PM, Cortner JA. Direct measurement of apolipoprotein B synthesis in human very low density lipoprotein using stable isotopes and mass spectrometry. J Lipid Res. 1986;27:508–516. [PubMed] [Google Scholar]
- 13.Schauder P, Arends J, Schafer G, Langer K, Bier DM. Incorporation of N-15-glycine into VLDL and LDL—in vivo synthesis of apolipoprotein-B in post-absorptive and fasting individuals [in German] Klin Wochenschr. 1989;67:280–285. doi: 10.1007/BF01892895. [DOI] [PubMed] [Google Scholar]
- 14.Cohn JS, Wagner DA, Cohn SD, Miller JS, Schaefer EJ. Measurement of very low density and low density lipoprotein apolipoprotein (apo) B-100 and high density lipoprotein apo A-I production in human subjects using deuterated leucine. Effect of fasting and feeding. J Clin Invest. 1990;85:804–811. doi: 10.1172/JCI114507. [DOI] [PMC free article] [PubMed] [Google Scholar]
- 15.Cortner JA, Le NA, Coates PM, Bennett MJ, Cryer DR. Determinants of fasting plasma triglyceride levels: metabolism of hepatic and intestinal lipoproteins. Eur J Clin Invest. 1992;22:158–165. doi: 10.1111/j.1365-2362.1992.tb01821.x. [DOI] [PubMed] [Google Scholar]
- 16.Matthews DE, Motil KJ, Rohrbaugh DK, Burke JF, Young VR, Bier DM. Measurement of leucine metabolism in man from a primed, continuous infusion of L-[1-3C]leucine. Am J Physiol Endocrinol Metab. 1980;238:E473–E479. doi: 10.1152/ajpendo.1980.238.5.E473. [DOI] [PubMed] [Google Scholar]
- 17.Parhofer KG, Barrett PHR, Bier DM, Schonfeld G. Determination of kinetic parameters of apolipoprotein B metabolism using amino acids labeled with stable isotopes. J Lipid Res. 1991;32:1311–1323. [PubMed] [Google Scholar]
- 18.Demant T, Packard CJ, Demmelmair H, Stewart P, Bedynek A, Bedford D, Seidel D, Shepherd J. Sensitive methods to study human apolipoprotein B metabolism using stable isotope-labeled amino acids. Am J Physiol Endocrinol Metab. 1996;270:E1022–E1036. doi: 10.1152/ajpendo.1996.270.6.E1022. [DOI] [PubMed] [Google Scholar]
- 19.Lichtenstein AH, Cohn JS, Hachey D, Millar JS, Ordovas JM, Schaefer EJ. Comparison of deuterated leucine, valine, and lysine in the measurement of human apolipoprotein A-I and B-100 kinetics. J Lipid Res. 1990;31:1693–1701. [PubMed] [Google Scholar]
- 20.Lichtenstein AH, Hachey D, Millar JS, Jenner LJ, Booth L, Ordovas JM, Schaefer EJ. Measurement of human apolipoprotein B-48 and B-100 kinetics in triglyceride-rich lipoproteins using [5,5,5-2H3]leucine. J Lipid Res. 1992;33:907–914. [PubMed] [Google Scholar]
- 21.Welty FK, Lichtenstein AH, Barrett PHR, Dolnikowski GG, Ordovas JM, Schaefer EJ. Decreased production and increased catabolism of apolipoprotein B-100 in apolipoprotein B-67/B-100 heterozygotes. Arterioscler Thromb Vasc Biol. 1997;17:881–888. doi: 10.1161/01.atv.17.5.881. [DOI] [PubMed] [Google Scholar]
- 22.Welty FK, Lichtenstein AH, Barrett PHR, Dolnikowski GG, Schaefer EJ. Human apolipoprotein (apo) B-48 and apoB-100 kinetics with stable isotopes. Arterioscler Thromb Vasc Biol. 1999;19:2966–2974. doi: 10.1161/01.atv.19.12.2966. [DOI] [PubMed] [Google Scholar]
- 23.Welty FK, Lichtenstein AH, Barrett PHR, Dolnikowski GG, Schaefer EJ. Interrelationships between human apolipoprotein A-I and apolipoproteins B-48 and B-100 kinetics using stable isotopes. Arterioscler Thromb Vasc Biol. 2004;24:1703–1707. doi: 10.1161/01.ATV.0000137975.14996.df. [DOI] [PubMed] [Google Scholar]
- 24.Ikewaki K, Nishiwaki M, Sakamoto T, Ishikawa T, Fairwell T, Zech LA, Nagano M, Nakamura H, Brewer HB, Rader DJ. Increased catabolic rate of low-density lipoproteins in humans with cholesteryl ester transfer protein-deficiency. J Clin Invest. 1995;96:1573–1581. doi: 10.1172/JCI118196. [DOI] [PMC free article] [PubMed] [Google Scholar]
- 25.Pietzsch J, Wiedemann B, Julius U, Nitzsche S, Gehrisch S, Bergmann S, Leonhardt W, Jaross W, Hanefeld M. Increased clearance of low density lipoprotein precursors in patients with heterozygous familial defective apolipoprotein B-100: a stable isotope approach. J Lipid Res. 1996;37:2074–2087. [PubMed] [Google Scholar]
- 26.Latour MA, Patterson BW, Pulai J, Chen ZJ, Schonfeld G. Metabolism of apolipoprotein B-100 in a kindred with familial hypobetalipoproteinemia without a truncated form of apoB. J Lipid Res. 1997;38:592–599. [PubMed] [Google Scholar]
- 27.Elias N, Patterson BW, Schonfeld G. Decreased production rates of VLDL triglycerides and apoB-100 in subjects heterozygous for familial hypobetalipoproteinemia. Arterioscler Thromb Vasc Biol. 1999;19:2714–2721. doi: 10.1161/01.atv.19.11.2714. [DOI] [PubMed] [Google Scholar]
- 28.Christ ER, Cummings MH, Albany E, Umpleby AM, Lumb PJ, Wierzbicki AS, Naoumova RP, Boroujerdi MA, Sonksen PH, Russell-Jones DL. Effects of growth hormone (GH) replacement therapy on very low density lipoprotein apolipoprotein B100 kinetics in patients with adult GH deficiency: a stable isotope study. J Clin Endocrinol Metab. 1999;84:307–316. doi: 10.1210/jcem.84.1.5365. [DOI] [PubMed] [Google Scholar]
- 29.Batista MC, Welty FK, Diffenderfer MR, Sarnak MJ, Schaefer EJ, Lamon-Fava S, Asztalos BF, Dolnikowski GG, Brousseau ME, Marsh JB. Apolipoprotein A-1, B-100, and B-48 metabolism in subjects with chronic kidney disease, obesity, and the metabolic syndrome. Metabolism. 2004;53:1255–1261. doi: 10.1016/j.metabol.2004.05.001. [DOI] [PubMed] [Google Scholar]
- 30.Tremblay AJ, Lamarche B, Ruel I, Hogue JC, Bergeron J, Gagne C, Couture P. Lack of evidence for reduced plasma apo B48 catabolism in patients with heterozygous familial hypercholesterolemia carrying the same null LDL receptor gene mutation. Atherosclerosis. 2004;172:367–373. doi: 10.1016/j.atherosclerosis.2003.11.011. [DOI] [PubMed] [Google Scholar]
- 31.Magkos F, Wright DC, Patterson BW, Mohammed BS, Mittendorfer B. Lipid metabolism response to a single, prolonged bout of endurance exercise in healthy young men. Am J Physiol Endocrinol Metab. 2006;290:E355–E362. doi: 10.1152/ajpendo.00259.2005. [DOI] [PubMed] [Google Scholar]
- 32.Davis TA, Fiorotto ML, Burrin DG, Reeds PJ, Nguyen HV, Beckett PR, Vann RC, O’Connor PMJ. Stimulation of protein synthesis by both insulin and amino acids is unique to skeletal muscle in neonatal pigs. Am J Physiol Endocrinol Metab. 2002;282:E880–E890. doi: 10.1152/ajpendo.00517.2001. [DOI] [PubMed] [Google Scholar]
- 33.Mosoni L, Houlier ML, Mirand PP, Bayle G, Grizard J. Effect of amino acids alone or with insulin on muscle and liver protein synthesis in adult and old rats. Am J Physiol Endocrinol Metab. 1993;264:E614–E620. doi: 10.1152/ajpendo.1993.264.4.E614. [DOI] [PubMed] [Google Scholar]
- 34.Anthony TG, Anthony JC, Yoshizawa F, Kimball SR, Jefferson LS. Oral administration of leucine stimulates ribosomal protein mRNA translation but not global rates of protein synthesis in the liver of rats. J Nutr. 2001;131:1171–1176. doi: 10.1093/jn/131.4.1171. [DOI] [PubMed] [Google Scholar]
- 35.Motil KJ, Opekun AR, Montandon CM, Berthold HK, Davis TA, Klein PD, Reeds PJ. Leucine oxidation changes rapidly after dietary protein intake is altered in adult women but lysine flux is unchanged as is lysine incorporation into VLDL-apolipoprotein B-100. J Nutr. 1994;124:41–51. doi: 10.1093/jn/124.1.41. [DOI] [PubMed] [Google Scholar]
- 36.Fisher EA, Ginsberg HN. Complexity in the secretory pathway: the assembly and secretion of apolipoprotein B-containing lipoproteins. J Biol Chem. 2002;277:17377–17380. doi: 10.1074/jbc.R100068200. [DOI] [PubMed] [Google Scholar]
- 37.Wilcox LJ, Barrett PH, Huff MW. Differential regulation of apolipoprotein B secretion from HepG2 cells by two HMG-CoA reductase inhibitors, atorvastatin and simvastatin. J Lipid Res. 1999;40:1078–1089. [PubMed] [Google Scholar]
- 38.Wilcox LJ, Barrett PH, Newton RS, Huff MW. ApoB100 secretion from HepG2 cells is decreased by the ACAT inhibitor CI-1011: an effect associated with enhanced intracellular degradation of apoB. Arterioscler Thromb Vasc Biol. 1999;19:939–949. doi: 10.1161/01.atv.19.4.939. [DOI] [PubMed] [Google Scholar]
- 39.Twisk J, Gillian-Daniel DL, Tebon A, Wang L, Barrett PH, Attie AD. The role of the LDL receptor in apolipoprotein B secretion. J Clin Invest. 2000;105:521–532. doi: 10.1172/JCI8623. [DOI] [PMC free article] [PubMed] [Google Scholar]
- 40.Cobelli C, Toffolo G, Bier DM, Nosadini R. Models to interpret kinetic data in stable isotope tracer studies. Am J Physiol Endocrinol Metab. 1987;253:E551–E564. doi: 10.1152/ajpendo.1987.253.5.E551. [DOI] [PubMed] [Google Scholar]
- 41.Demant T, Seeberg K, Bedynek A, Seidel D. The metabolism of lipoprotein(a) and other apolipoprotein B-containing lipoproteins: a kinetic study in humans. Atherosclerosis. 2001;157:325–339. doi: 10.1016/s0021-9150(00)00732-2. [DOI] [PubMed] [Google Scholar]
- 42.Chan DC, Watts GF, Redgrave TG, Mori TA, Barrett PH. Apolipoprotein B-100 kinetics in visceral obesity: associations with plasma apolipoprotein C-III concentration. Metabolism. 2002;51:1041–1046. doi: 10.1053/meta.2002.33339. [DOI] [PubMed] [Google Scholar]
- 43.Chan DC, Watts GF, Barrett PH, Beilin LJ, Redgrave TG, Mori TA. Regulatory effects of HMG CoA reductase inhibitor and fish oils on apolipoprotein B-100 kinetics in insulin-resistant obese male subjects with dyslipidemia. Diabetes. 2002;51:2377–2386. doi: 10.2337/diabetes.51.8.2377. [DOI] [PubMed] [Google Scholar]
- 44.Parhofer KG, Barrett PH. What we have learned about VLDL and LDL metabolism from human kinetics studies. J Lipid Res. 2006;47:1620–1630. doi: 10.1194/jlr.R600013-JLR200. [DOI] [PubMed] [Google Scholar]
- 45.Berman M, Schoenfeld R. Invariants in experimental data on linear kinetics and the formulation of models. J Appl Phys. 1956;27:1361–1370. [Google Scholar]
- 46.Rescigno A, Segre G. Drug and Tracer Kinetics. Blaisdell; Waltham, MA: 1966. [Google Scholar]
- 47.Himmelblau DM, Bischoff KB. Process Analysis and Simulation—Deterministic Systems. Wiley; New York: 1968. [Google Scholar]
- 48.Ramakrishnan R. An application of Berman’s work on pool-model invariants in analyzing indistinguishable models for whole-body cholesterol metabolism. Math Biosci. 1984;72:373–385. doi: 10.1016/0025-5564(84)90119-6. [DOI] [PMC free article] [PubMed] [Google Scholar]
- 49.Cobelli C, Foster DM. Compartmental models: theory and practice using the SAAM II software system. Adv Exp Med Biol. 1998;445:79–101. doi: 10.1007/978-1-4899-1959-5_5. [DOI] [PubMed] [Google Scholar]
- 50.de Sain-van der Velden M, Reijngoud DJ, Kaysen GA, Gadellaa MM, Voorbij H, Stellaard F, Koomans HA, Rabelink TJ. Evidence for increased synthesis of lipoprotein(a) in the nephrotic syndrome. J Am Soc Nephrol. 1998;9:1474–1481. doi: 10.1681/ASN.V981474. [DOI] [PubMed] [Google Scholar]
- 51.Batal R, Tremblay AJ, Barrett PHR, Jacques H, Fredenrich A, Mamer O, Davignon J, Cohn JS. Plasma kinetics of apoC-III and apoE in normolipidemic and hypertriglyceridemic subjects. J Lipid Res. 2000;41:706–718. [PubMed] [Google Scholar]
- 52.Arad Y, Ramakrishnan R, Ginsberg HN. Lovastatin therapy reduces low density lipoprotein apoB levels in subjects with combined hyperlipidemia by reducing the production of apoB-containing lipoproteins: implications for the pathophysiology of apoB production. J Lipid Res. 1990;31:567–582. [PubMed] [Google Scholar]
- 53.Barrett PH, Bell BM, Cobelli C, Golde H, Schumutzky A, Vincini P, Foster DM. SAAM II: Simulation, Analysis, and Modeling software for tracer and pharmacokinetic studies. Metabolism. 1998;47:484–492. doi: 10.1016/s0026-0495(98)90064-6. [DOI] [PubMed] [Google Scholar]
- 54.Ikewaki K, Rader DJ, Schaefer JR, Fairwell T, Zech LA, Brewer HB. Evaluation of apoA-I kinetics in humans using simultaneous stable isotope and exogenous radiotracer methods. J Lipid Res. 1993;34:2207–2215. [PubMed] [Google Scholar]
- 55.Rader DJ, Ikewaki K, Duverger N, Schmidt H, Pritchard H, Frohlich J, Clerc M, Dumon MF, Fairwell T, Zech L, et al. Markedly accelerated catabolism of apolipoprotein A-II (apoA-II) and high-density-lipoproteins containing apoA-II in classic lecithin-cholesterol acyltransferase deficiency and fish-eye disease. J Clin Invest. 1994;93:321–330. doi: 10.1172/JCI116962. [DOI] [PMC free article] [PubMed] [Google Scholar]
- 56.Cummings MH, Watts GF, Umpleby AM, Hennessy TR, Kelly JM, Jackson NC, Sonksen PH. Acute hyperinsulinemia decreases the hepatic secretion of very-low-density lipoprotein apolipoprotein B-100 in NIDDM. Diabetes. 1995;44:1059–1065. doi: 10.2337/diab.44.9.1059. [DOI] [PubMed] [Google Scholar]
- 57.Schaefer JR, Scharnagl H, Baumstark MW, Schweer H, Zech LA, Seyberth H, Winkler K, Steinmetz A, Marz W. Homozygous familial defective apolipoprotein B-100-enhanced removal of apolipoprotein E-containing VLDLs and decreased production of LDLs. Arterioscler Thromb Vasc Biol. 1997;17:348–353. doi: 10.1161/01.atv.17.2.348. [DOI] [PubMed] [Google Scholar]
- 58.Batal R, Tremblay M, Krimbou L, Mamer O, Davignon J, Genest J, Cohn JS. Familial HDL deficiency characterized by hypercatabolism of mature apoA-I but not proapoA-I. Arterioscler Thromb Vasc Biol. 1998;18:655–664. doi: 10.1161/01.atv.18.4.655. [DOI] [PubMed] [Google Scholar]
- 59.Su W, Campos H, Judge H, Walsh BW, Sacks FM. Metabolism of apo(a) and apoB100 of lipoprotein(a) in women: effect of postmenopausal estrogen replacement. J Clin Endocrinol Metab. 1998;83:3267–3276. doi: 10.1210/jcem.83.9.5116. [DOI] [PubMed] [Google Scholar]
- 60.Bordin P, Bodamer OAF, Venkatesan S, Gray RM, Bannister PA, Halliday D. Effects of fish oil supplementation on apolipoprotein B100 production and lipoprotein metabolism in normolipidaemic males. Eur J Clin Nutr. 1998;52:104–109. doi: 10.1038/sj.ejcn.1600522. [DOI] [PubMed] [Google Scholar]
- 61.Frenais R, Ouguerram K, Maugeais C, Marchini JS, Benlian P, Bard JM, Magot T, Krempf M. Apolipoprotein A-I kinetics in heterozygous familial hypercholesterolemia: a stable isotope study. J Lipid Res. 1999;40:1506–1511. [PubMed] [Google Scholar]
- 62.Schaefer JR, Schweer H, Ikewaki K, Stracke H, Seyberth HJ, Kaffarnik H, Maisch B, Steinmetz A. Metabolic basis of high density lipoproteins and apolipoprotein A-I increase by HMG-CoA reductase inhibition in healthy subjects and a patient with coronary artery disease. Atherosclerosis. 1999;144:177–184. doi: 10.1016/s0021-9150(99)00053-2. [DOI] [PubMed] [Google Scholar]
- 63.Winkler K, Schaefer JR, Klima B, Nuber C, Friedrich I, Koster W, Gierens H, Scharnagl H, Soufi M, Wieland H, et al. HDL steady state levels are not affected, but HDL apoA-I turnover is enhanced by Lifibrol in patients with hypercholesterolemia and mixed hyperlipidemia. Atherosclerosis. 2000;150:113–120. doi: 10.1016/s0021-9150(99)00351-2. [DOI] [PubMed] [Google Scholar]
- 64.Perez-Mendez O, Bruckert E, Franceschini G, Duhal N, Lacroix B, Bonte JP, Sirtori C, Fruchart JC, Turpin G, Luc G. Metabolism of apolipoproteins AI and AII in subjects carrying similar apoAI mutations, apoAI Milano and apoAI Paris. Atherosclerosis. 2000;148:317–326. doi: 10.1016/s0021-9150(99)00279-8. [DOI] [PubMed] [Google Scholar]
- 65.Duvillard L, Pont F, Florentin E, Gambert P, Verges B. Inefficiency of insulin therapy to correct apolipoprotein A-I metabolic abnormalities in non-insulin-dependent diabetes mellitus. Atherosclerosis. 2000;152:229–237. doi: 10.1016/s0021-9150(99)00473-6. [DOI] [PubMed] [Google Scholar]
- 66.Recalde D, Velez-Carrasco W, Civeira F, Cenarro A, Gomez-Coronado D, Ordovas JM, Pocovi M. Enhanced fractional catabolic rate of apo A-I and apo A-II in heterozygous subjects for apo A-I-Zaragoza (L144R) Atherosclerosis. 2001;154:613–623. doi: 10.1016/s0021-9150(00)00555-4. [DOI] [PubMed] [Google Scholar]
- 67.Pont F, Duvillard L, Florentin E, Gambert P, Verges B. High-density lipoprotein apolipoprotein A-I kinetics in obese insulin resistant patients. An in vivo stable isotope study. Int J Obes. 2002;26:1151–1158. doi: 10.1038/sj.ijo.0802070. [DOI] [PubMed] [Google Scholar]
- 68.Desroches S, Paradis ME, Perusse M, Archer WR, Bergeron J, Couture P, Bergeron N, Lamarche B. Apolipoprotein A-I, A-II, and VLDL-B-100 metabolism in men: comparison of a low-fat diet and a high-monounsaturated fatty acid diet. J Lipid Res. 2004;45:2331–2338. doi: 10.1194/jlr.M400287-JLR200. [DOI] [PubMed] [Google Scholar]
- 69.Ruel IL, Couture P, Cohn JS, Bensadoun A, Marcil M, Lamarche B. Evidence that hepatic lipase deficiency in humans is not associated with proatherogenic changes in HDL composition and metabolism. J Lipid Res. 2004;45:1528–1537. doi: 10.1194/jlr.M400090-JLR200. [DOI] [PubMed] [Google Scholar]
- 70.Bach-Ngohou K, Ouguerram K, Frenais R, Maugere P, Piquer BR, Zair Y, Krempf M, Bard JM. Influence of atorvastatin on apolipoprotein E and Al kinetics in patients with type 2 diabetes. J Pharmacol Exp Ther. 2005;315:363–369. doi: 10.1124/jpet.105.085522. [DOI] [PubMed] [Google Scholar]
- 71.Verges B, Rader D, Schaefer J, Zech L, Kindt M, Fairwell T, Gambert P, Brewer HB. In vivo metabolism of apolipoprotein A-IV in severe hypertriglyceridemia—a combined radiotracer and stable-isotope kinetic study. J Lipid Res. 1994;35:2280–2291. [PubMed] [Google Scholar]
- 72.Tilly-Kiesi M, Lichtenstein AH, Ordovas JM, Dolnikowski GG, Malmstrom R, Taskinen MR, Schaefer EJ. Subjects with apoA-I(Lys107→0) exhibit enhanced fractional catabolic rate of apoA-I in Lp(AI) and apoA-II in Lp(AI with AII) Arterioscler Thromb Vasc Biol. 1997;17:873–880. doi: 10.1161/01.atv.17.5.873. [DOI] [PubMed] [Google Scholar]
- 73.Tilly-Kiesi M, Schaefer EJ, Knudsen P, Welty FK, Dolnikowski GG, Taskinen MR, Lichtenstein AH. Lipoprotein metabolism in subjects with hepatic lipase deficiency. Metabolism. 2004;53:520–525. doi: 10.1016/j.metabol.2003.10.020. [DOI] [PubMed] [Google Scholar]
- 74.Patterson BW, Hachey D, Cook GL, Amann JM, Klein PD. Incorporation of a stable isotopically labeled amino acid into multiple human apolipoproteins. J Lipid Res. 1991;32:1063–1072. [PubMed] [Google Scholar]
- 75.Nagashima K, Lopez C, Donovan D, Ngai C, Fontanez N, Bensadoun A, Fruchart-Najib J, Holleran S, Cohn JS, Ramakrishnan R, Ginsberg HN. Effects of the PPARgamma agonist pioglitazone on lipoprotein metabolism in patients with type 2 diabetes mellitus. J Clin Invest. 2005;115:1323–1332. doi: 10.1172/JCI23219. [DOI] [PMC free article] [PubMed] [Google Scholar]
- 76.Walsh BW, Sacks FM. Effects of low dose oral contraceptives on very low density and low density lipoprotein metabolism. J Clin Invest. 1993;91:2126–2132. doi: 10.1172/JCI116437. [DOI] [PMC free article] [PubMed] [Google Scholar]
- 77.Walsh BW, Li H, Sacks FM. Effects of post-menopausal hormone replacement with oral and transdermal estrogen on high density lipoprotein metabolism. J Lipid Res. 1994;35:2083–2093. [PubMed] [Google Scholar]
- 78.Pacy PJH, Mitropoulos KA, Venkatesan S, Watts GF, Reeves BEA, Halliday D. Metabolism of apolipoprotein B-100 and of triglyceride-rich lipoprotein particles in the absence of functional lipoprotein lipase. Atherosclerosis. 1993;103:231–243. doi: 10.1016/0021-9150(93)90266-w. [DOI] [PubMed] [Google Scholar]
- 79.Cummings MH, Watts GF, Umpleby M, Hennessy TR, Quiney JR, Sonksen PH. Increased hepatic secretion of very-low-density-lipoprotein apolipoprotein B-100 in heterozygous familial hypercholesterolemia—a stable-isotope study. Atherosclerosis. 1995;113:79–89. doi: 10.1016/0021-9150(94)05430-q. [DOI] [PubMed] [Google Scholar]
- 80.Watts GF, Cummings MH, Umpleby M, Quiney JR, Naoumova R, Thompson GR, Sonksen PH. Simvastatin decreases the hepatic secretion of very-low-density lipoprotein apolipoprotein B-100 in heterozygous familial hypercholesterolemia—pathophysiological and therapeutic implications. Eur J Clin Invest. 1995;25:559–567. doi: 10.1111/j.1365-2362.1995.tb01746.x. [DOI] [PubMed] [Google Scholar]
- 81.Watts GF, Naoumova R, Cummings MH, Umpleby AM, Slavin BM, Sonksen PH. Direct correlation between cholesterol-synthesis and hepatic secretion of apolipoprotein B-100 in normolipidemic subjects. Metabolism. 1995;44:1052–1057. doi: 10.1016/0026-0495(95)90104-3. [DOI] [PubMed] [Google Scholar]
- 82.Velez-Carrasco W, Lichtenstein AH, Welty FK, Li ZL, Lamon-Fava S, Dolnikowski GG, Schaefer EJ. Dietary restriction of saturated fat and cholesterol decreases HDL apoA-I secretion. Arterioscler Thromb Vasc Biol. 1999;19:918–924. doi: 10.1161/01.atv.19.4.918. [DOI] [PubMed] [Google Scholar]
- 83.Velez-Carrasco W, Lichtenstein AH, Barrett PHR, Sun ZY, Dolnikowski GG, Welty FK, Schaefer EJ. Human apolipoprotein A-I kinetics within triglyceride-rich lipoproteins and high density lipoproteins. J Lipid Res. 1999;40:1695–1700. [PubMed] [Google Scholar]
- 84.Velez-Carrasco W, Lichtenstein AH, Li ZL, Dolnikowski GG, Lamon-Fava S, Welty FK, Schaefer EJ. Apolipoprotein A-I and A-II kinetic parameters as assessed by endogenous labeling with [H-2(3)] leucine in middle-aged and elderly men and women. Arterioscler Thromb Vasc Biol. 2000;20:801–806. doi: 10.1161/01.atv.20.3.801. [DOI] [PubMed] [Google Scholar]
- 85.Watts GF, Naoumova RP, Kelly JM, Riches FM, Croft KD, Thompson GR. Inhibition of cholesterogenesis decreases hepatic secretion of apoB-100 in normolipidemic subjects. Am J Physiol Endocrinol Metab. 1997;273:E462–E470. doi: 10.1152/ajpendo.1997.273.3.E462. [DOI] [PubMed] [Google Scholar]
- 86.Riches FM, Watts GF, Naoumova RP, Kelly JM, Croft KD, Thompson GR. Direct association between the hepatic secretion of very-low-density lipoprotein apolipoprotein B-100 and plasma mevalonic acid and lathosterol concentrations in man. Atherosclerosis. 1997;135:83–91. doi: 10.1016/s0021-9150(97)00153-6. [DOI] [PubMed] [Google Scholar]
- 87.Riches FM, Watts GF, van Bockxmeer FM, Hua J, Song S, Humphries SE, Talmud PJ. Apolipoprotein B signal peptide and apolipoprotein E genotypes as determinants of the hepatic secretion of VLDL apoB in obese men. J Lipid Res. 1998;39:1752–1758. [PubMed] [Google Scholar]
- 88.Venkatesan S, Cullen P, Pacy P, Halliday D, Scott J. Stable isotopes show a direct relation between VLDL apo-B overproduction and serum triglyceride levels and indicate a metabolically and biochemically coherent basis for familial combined hyperlipidemia. Arterioscler Thromb. 1993;13:1110–1118. doi: 10.1161/01.atv.13.7.1110. [DOI] [PubMed] [Google Scholar]
- 89.Arends J, Bier DM, Schafer G, Armstrong VW, Thiery J, Seidel D, Schauder P. No evidence for feedback inhibition of hepatic apolipoprotein-B (apo-B) production after extracorporeal low-density-lipoprotein precipitation as determined by [1-C-13]leucine infusion in normal volunteers. Eur J Clin Invest. 1993;23:602–614. doi: 10.1111/j.1365-2362.1993.tb00721.x. [DOI] [PubMed] [Google Scholar]
- 90.Arends J, Schafer G, Schauder P, Bircher J, Bier DM. Comparison of serine and hippurate as precursor equivalents during infusion of [N-15]glycine for measurement of fractional synthetic rates of apolipoprotein-B of very-low-density lipoprotein. Metabolism. 1995;44:1253–1258. doi: 10.1016/0026-0495(95)90025-x. [DOI] [PubMed] [Google Scholar]
- 91.Chrisoulidou A, Kousta E, Venkatesan S, Gray R, Bannister PA, Gallagher JJ, Johnston DG. Very-low-density lipoprotein apolipoprotein B100 kinetics in adult hypopituitarism. Metabolism. 1999;48:1057–1062. doi: 10.1016/s0026-0495(99)90206-8. [DOI] [PubMed] [Google Scholar]
- 92.Kearney T, de Gallegos CN, Chrisoulidou A, Gray R, Bannister P, Venkatesan S, Johnston DG. Hypopituitarsim is associated with triglyceride enrichment of very low-density lipoprotein. J Clin Endocrinol Metab. 2001;86:3900–3906. doi: 10.1210/jcem.86.8.7774. [DOI] [PubMed] [Google Scholar]
- 93.Robinson ACJ, Jeffs JAR, Gray RG, Bannister PA, Mather H, Gallagher JJ, Robinson S, Nattrass M, Venkatesan S, Halliday D, Johnston DG. Metabolic effects of troglitazone in patients with diet-controlled type 2 diabetes. Eur J Clin Invest. 2004;34:29–36. doi: 10.1111/j.1365-2362.2004.01274.x. [DOI] [PubMed] [Google Scholar]
- 94.Previs SF, Fatica R, Chandramouli V, Alexander JC, Brunengraber H, Landau BR. Quantifying rates of protein synthesis in humans by use of (H2O)-H-2: application to patients with end-stage renal disease. Am J Physiol Endocrinol Metab. 2004;286:E665–E672. doi: 10.1152/ajpendo.00271.2003. [DOI] [PubMed] [Google Scholar]
- 95.Malmstrom R, Packard CJ, Watson TDG, Rannikko S, Caslake M, Bedford D, Stewart P, Yki-Jarvinen H, Shepherd J, Taskinen MR. Metabolic basis of hypotriglyceridemic effects of insulin in normal men. Arterioscler Thromb Vasc Biol. 1997;17:1454–1464. doi: 10.1161/01.atv.17.7.1454. [DOI] [PubMed] [Google Scholar]
- 96.Adiels M, Packard CJ, Caslake MJ, Stewart P, Soro A, Westerbacka J, Wennberg B, Olofsson SO, Taskinen MR, Boren J. A new combined multicompartmental model for apolipoprotein B-100 and triglyceride metabolism in VLDL sub-fractions. J Lipid Res. 2005;46:58–67. doi: 10.1194/jlr.M400108-JLR200. [DOI] [PubMed] [Google Scholar]
- 97.Adiels M, Boren J, Caslake MJ, Stewart P, Soro A, Westerbacka J, Wennberg B, Olofsson SO, Packard CJ, Taskinen MR. Overproduction of VLDL1 driven by hyperglycemia is a dominant feature of diabetic dyslipidemia. Arterioscler Thromb Vasc Biol. 2005;25:1697–1703. doi: 10.1161/01.ATV.0000172689.53992.25. [DOI] [PubMed] [Google Scholar]
- 98.Reeds PJ, Hachey D, Patterson BW, Motil KJ, Klein PD. VLDL apolipoprotein B-100, a potential indicator of the isotopic labeling of the hepatic protein synthetic precursor pool in humans: studies with multiple stable isotopically labeled amino acids. J Nutr. 1992;122:457–466. doi: 10.1093/jn/122.3.457. [DOI] [PubMed] [Google Scholar]
- 99.AguilarSalinas CA, Barrett PHR, Parhofer KG, Young SG, Tessereau D, Bateman J, Quinn C, Schonfeld G. Apoprotein-B-100 production is decreased in subjects heterozygous for truncations of apoprotein-B. Arterioscler Thromb Vasc Biol. 1995;15:71–80. doi: 10.1161/01.atv.15.1.71. [DOI] [PubMed] [Google Scholar]
- 100.AguilarSalinas CA, Barrett PHR, Kelber J, Delmez J, Schonfeld G. Physiological mechanisms of action of lovastatin in nephrotic syndrome. J Lipid Res. 1995;36:188–199. [PubMed] [Google Scholar]
- 101.AguilarSalinas CA, Barrett PHR, Pulai J, Zhu XL, Schonfeld G. A familial combined hyperlipidemic kindred with impaired apolipoprotein B catabolism—kinetics of apolipoprotein B during placebo and pravastatin therapy. Arterioscler Thromb Vasc Biol. 1997;17:72–82. doi: 10.1161/01.atv.17.1.72. [DOI] [PubMed] [Google Scholar]
- 102.Bach-Ngohou K, Ouguerram K, Nazih H, Maugere P, Ripolles-Piquer B, Zair Y, Frenais R, Krempf M, Bard JM. Apolipoprotein E kinetics: influence of insulin resistance and type 2 diabetes. Int J Obes. 2002;26:1451–1458. doi: 10.1038/sj.ijo.0802149. [DOI] [PubMed] [Google Scholar]
- 103.Duvillard L, Pont F, Florentin E, Galland-Jos C, Gambert P, Verges B. Metabolic abnormalities of apolipoprotein B-containing lipoproteins in non-insulin-dependent diabetes: a stable isotope kinetic study. Eur J Clin Invest. 2000;30:685–694. [PubMed] [Google Scholar]
- 104.Burnett JR, Barrett PHR. Apolipoprotein B metabolism: tracer kinetics, models, and metabolic studies. Crit Rev Clin Lab Sci. 2002;39:89–137. doi: 10.1080/10408360208951113. [DOI] [PubMed] [Google Scholar]
- 105.Christ ER, Carroll PV, Albany E, Umpleby AM, Lumb PJ, Wierzbicki AS, Simpson HL, Sonksen PH, Russell-Jones DL. Normal VLDL metabolism despite altered lipoprotein composition in type 1 diabetes mellitus. Clin Endocrinol (Oxf) 2001;55:777–787. doi: 10.1046/j.1365-2265.2001.01407.x. [DOI] [PubMed] [Google Scholar]
- 106.Christ ER, Carroll PV, Albany E, Umpleby AM, Lumb PJ, Wierzbicki AS, Sonksen PH, Russell-Jones DL. Effect of IGF-I therapy on VLDL apolipoprotein B100 metabolism in type 1 diabetes mellitus. Am J Physiol Endocrinol Metab. 2002;282:E1154–E1162. doi: 10.1152/ajpendo.00470.2001. [DOI] [PubMed] [Google Scholar]
- 107.Christ ER, Cummings MH, Stolinski M, Jackson N, Lumb PJ, Wierzbicki AS, Sonksen PH, Russell-Jones DL, Umpleby AM. Low-density lipoprotein apolipoprotein B100 turnover in hypopituitary patients with GH deficiency: a stable isotope study. Eur J Endocrinol. 2006;154:459–466. doi: 10.1530/eje.1.02105. [DOI] [PubMed] [Google Scholar]
- 108.Lemieux S, Patterson BW, Carpentier A, Lewis GF, Steiner G. A stable isotope method using a [(2)H(5)]glycerol bolus to measure very low density lipoprotein triglyceride kinetics in humans. J Lipid Res. 1999;40:2111–2117. [PubMed] [Google Scholar]
- 109.Elias N, Patterson BW, Schonfeld G. In vivo metabolism of apoB, apoA-I, and VLDL triglycerides in a form of hypobetalipoproteinemia not linked to the apoB gene. Arterioscler Thromb Vasc Biol. 2000;20:1309–1315. doi: 10.1161/01.atv.20.5.1309. [DOI] [PubMed] [Google Scholar]
- 110.Reeds DN, Mittendorfer B, Patterson BW, Powderly WG, Yarasheski KE, Klein S. Alterations in lipid kinetics in men with HIV-dyslipidemia. Am J Physiol Endocrinol Metab. 2003;285:E490–E497. doi: 10.1152/ajpendo.00118.2003. [DOI] [PubMed] [Google Scholar]
- 111.Mittendorfer B, Patterson BW, Klein S. Effect of sex and obesity on basal VLDL-triacylglycerol kinetics. Am J Clin Nutr. 2003;77:573–579. doi: 10.1093/ajcn/77.3.573. [DOI] [PubMed] [Google Scholar]
- 112.Isley WL, Miles JM, Patterson BW, Harris WS. The effect of high-dose simvastatin on triglyceride-rich lipoprotein metabolism in patients with type 2 diabetes mellitus. J Lipid Res. 2006;47:193–200. doi: 10.1194/jlr.M500387-JLR200. [DOI] [PubMed] [Google Scholar]
- 113.Patterson BW, Mittendorfer B, Elias N, Satyanarayana R, Klein S. Use of stable isotopically labeled tracers to measure very low density lipoprotein-triglyceride turnover. J Lipid Res. 2002;43:223–233. [PubMed] [Google Scholar]
- 114.Wolfram Research. The Wolfram Integrator, powered by Web Mathematica. 2006 Available at http://integrals.wolfram.com/index.jsp.