Abstract
Computer-aided drug design is a mature field by some measures, and it has produced notable successes that underpin the study of interactions between small molecules and living systems. However, unlike a truly mature field, fallacies of logic lie at the heart of the arguments in support of major lines of research on methodology and validation thereof. Two particularly pernicious ones are cum hoc ergo propter hoc (with this, therefore because of this) and confirmation bias (seeking evidence that is confirmatory of the hypothesis at hand). These fallacies will be discussed in the context of off-target predictive modeling, QSAR, molecular similarity computations, and docking. Examples will be shown that avoid these problems.
Introduction
Computer-aided drug design has achieved wide use, judging by the penetrance of molecular modeling software within the pharmaceutical industry. A common observation, however, is that the performance of methods in practice, on real projects involving design and testing of new molecules, falls far short of the expectations generated by initial reports of new methods and corresponding validation data. Each such report involves a hypothesis of the form that some method is good for some application, and data are supplied to bolster the assertion.
There are two logical fallacies of hypothesis formation and testing, which, while not exclusive to molecular modeling, form especially frequent traps within this field. The first is known in Latin as cum hoc ergo propter hoc, meaning “with this, therefore because of this.” This will be referred to in what follows as the correlation fallacy because the error lies in conflation of mere correlation with causation. The second encompasses a large variety of human behaviors and is called confirmation bias [1]. This logical fallacy takes the form of seeking confirmatory evidence of a hypothesis in favor of or to the exclusion of evidence that may tend against the hypothesis.
The correlation fallacy was notably highlighted with respect to QSAR by Stephen Johnson [2]. Johnson illustrated the issue with the high correlation between the quantity of fresh lemons imported into the USA over time and the reduction in the US highway fatality rate. There are, of course, many possible reasons why the fatality rate dropped, but selection of a reason purely by virtue of its correlation with the outcome and independent of any physical reality is not enough evidence to support the selection. But, this is how much of QSAR has been practiced over many years: selection of a particular model from among many based on which has the best correlation or fitness score of some type (irrespective of relationship to underlying physical reality). Such models are then typically tested against some set of data that has been withheld, often by random partitioning. Random partitioning of a set of strongly related molecules will typically yield a test set where, for each molecule, there exists a highly similar training molecule. In general, the models will exhibit adequate performance on such tests, but will tend to perform poorly in the presence of many “activity cliffs” (relatively infrequent cases where small changes in structure produce large changes in activity). This is an example of a confirmation bias masked by what might seem to be a reasonable validation procedure.
There is a famous scene in “Monty Python and the Holy Grail” beginning with an accusation of witchcraft. Through serial application of the correlation fallacy, the crowd reasons that because witches are to be burned, the accused is a witch if she weighs the same as a duck. A suitable balancing scale and duck were produced, showing that the accused did, in fact, weigh the same as a duck. Therefore went the reasoning, she was a witch! Confirmation bias was ubiquitous in historical witch hunts [1]. In 17th century France, a legal authority was quoted as follows:
“He who is accused of sorcery should never be acquitted, unless the malice of the prosecutor be clearer than the sun; for it is so difficult to bring full proof of this secret crime, that out of a million witches not one would be convicted if the usual course were followed!”
Thus, confirmation of witchcraft was essentially guaranteed, making use of special rules of evidence in such trials in order to achieve the desired outcome.
For modeling, this amounts to rejecting a model or method by impugning the motives of the proponent, but not through the use of data and analysis to test the method itself. Far too large a fraction of research in computer-aided drug-design is the logical equivalent of witch hunting. Modeling methods are built upon faulty reasoning rife with correlation fallacies and then are “tried” with validation procedures that embed confirmation bias either by design or through ignorance. A model or method is thus produced with magical predictive powers. As a field, we should strive to do better.
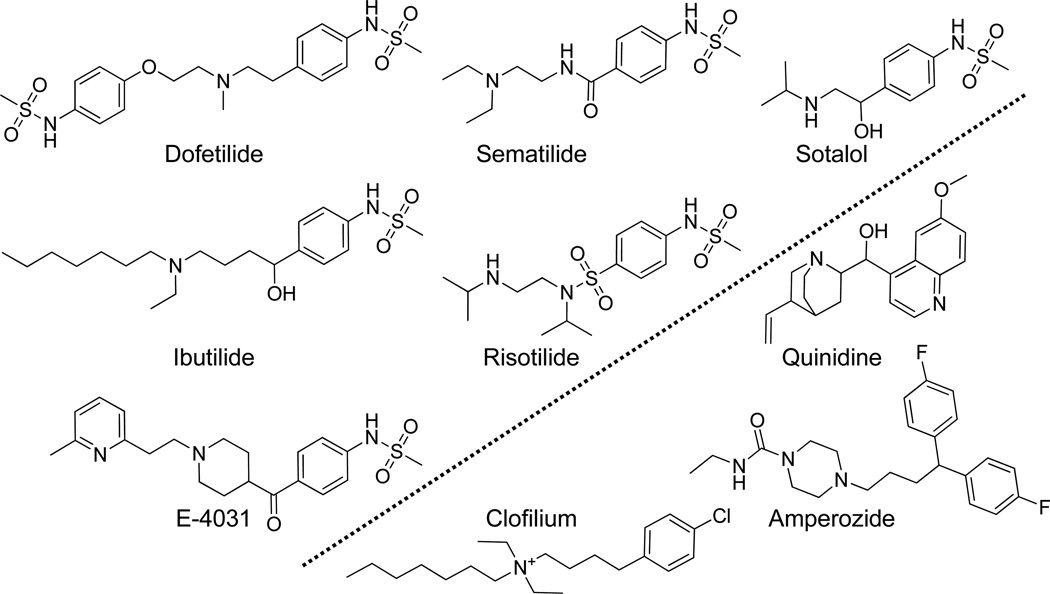
But doing better is not without challenges. One reason that molecular modeling is particularly badly afflicted by these two fallacies is that the data themselves suffer from the afflictions, since small molecules are made by people that, in their own reasoning, exhibit both the correlation fallacy and confirmation bias. Figure 1 shows nine molecules to illustrate this point, all of whose modulatory effects on cardiac potassium channel current were published by 1992 (later understood to be primarily governed by hERG [3]). The six molecules covering the upper left are all phenyl-methane-sulfonamides with a large para substituent containing a tertiary amine. The preponderance of this exact substructure shows an adherence to a correlative assumption: that the particular right-hand-side of these molecules is related to favorable activity. It also shows a tendency toward confirmation bias: many more molecules were probably made with the common core of dofetilide/ibutilide than with something else.
Figure 1.
Structures of nine molecules known to modulate cardiac potassium channel current (one major responsible gene product was later found to be HERG) as of 1992.
We have previously quantified this effect in molecular design [4], describing it as an artifact of a human inductive bias toward 2D topological similarity in reasoning about and predicting molecular activity. We showed that the 2D similarity among molecule pairs designed intentionally to hit a particular target was much higher than between molecule pairs where one hit the target of the other as a side-effect. Recently, we showed that such a design bias limits the potential therapeutic novelty of new small molecules [5]. The important point here is that the logical fallacies of correlation and confirmation drive the production of medicinal molecules themselves.
Given that the very production of molecules on which to make predictions of biological activity is linked with these two logical fallacies, it is easy to see how methodological development and validation can be lead astray. For example, in developing a theory of the movement of celestial bodies, one might choose to make observations that will tend to confirm the theory. However, such a choice does not actually prevent contrary observations from existing. Others are free to make the other observations, and the theory can be invalidated. In contrast, in molecular modeling, molecules exhibiting a contrary hypothesis about biological activity often are never made. So, the space of observables in molecular modeling is shaped by the correlation fallacy and confirmation bias, and even a benign selection of data will tend to be favorably confirmatory of methods whose underpinnings parallel the biases of medicinal chemical production.
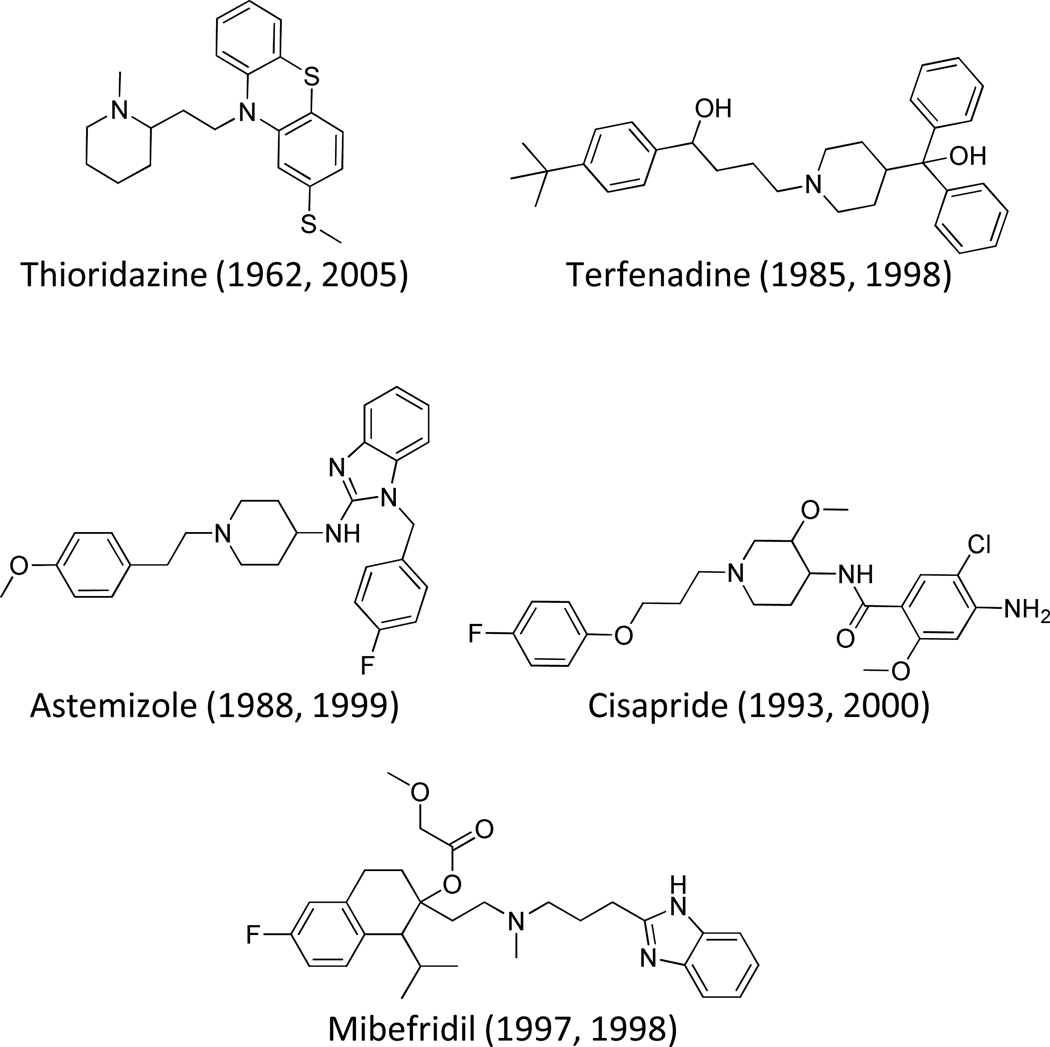
Why does this matter? First, as evident from the molecules on the lower right of Figure 1, excessive bias in design would miss the fact that neither the methyl-sulfonamide, nor the phenyl, nor the tertiary amine are necessary for activity against the hERG potassium channel. Second, it is not the nominal cost of a successful drug discovery and development project that dominates pharmaceutical innovation. It is the amortized cost of the much more frequent failures that is the chief problem, stemming from failure rates from Phase 1 onward of about nine in ten clinical candidates [6]. A particularly expensive form of failure can arise from post-marketing withdrawal due to unwanted side effects. Figure 2 shows the structures of five molecules, all withdrawn for hERG-related toxicity after the molecules in Figure 1 and their activity in corresponding potassium channel assays were well-known. Terfenadine and astemizole were developed as antihistamines, mibefradil as a calcium channel blocker for hypertension, cisapride as an agonist of 5HT4 for heartburn, and thioridazine as an antipsychotic which derived its therapeutic effect primarily from dopamine receptor antagonism. None of these molecules exhibits such obvious structural similarity to those molecules in Figure 1 that a reasonable medicinal chemist or modeler would made a confident guess that they would have HERG activity sufficient to cause therapeutically disastrous side-effects.
Figure 2.
Structures of five drugs withdrawn from the US market due to inappropriate modulation of HERG (dates shown are FDA approval and withdrawal from market).
In order to help address the most serious challenges of the pharmaceutical industry, the question should not be the moral equivalent of “Does your model weigh the same as a duck?” The ability to identify data that provide favorable evidence about the performance of a method is not sufficient, just as finding a suitable scale and duck ought not to have been sufficient in the case of the witch in the “Holy Grail.” Those involved in methodological development and validation must take special care to avoid reasoning involving correlation fallacy and confirmation bias. The data we have available make these traps natural and ubiquitous, but difficult problems such as those highlighted by Figures 1 and 2 are unlikely to be solved using methods that do not get at the underlying physical phenomena that drive biological activity of small medicinal molecules. In what follows, we will touch on these issues as they relate to off-target predictive modeling, QSAR, molecular similarity computation, and docking.
Off-Target Predictive Modeling
As just outlined above, one of the most significant challenges of drug discovery involves the avoidance of side-effects that are revealed only after clinical trials begin or after marketing has commenced. As can be seen by the substantial structural differences between the molecules in Figures 1 and 2, prediction of such effects would be difficult if not impossible on the basis of 2D structural similarity. We have recently published a new method for relating the structures of a set of molecules with a shared biologial effect to another molecule, where the molecule of interest may may share little 2D similarity with the molecules with known activity [5]. The method works by converting the raw molecular similarities of one molecule to many others into corresponding probabilities. The set of probabilities is then combined into a single log-odds score using the multinomial distribution. A score of 2.0, for example, indicates that a molecule is 100 times more likely to share activity with the set of molecules than not share activity. A score of 3.0 would indicate 1000-fold likelihood in favor, whereas negative scores provide evidence against the molecule sharing activity with the annotated set.
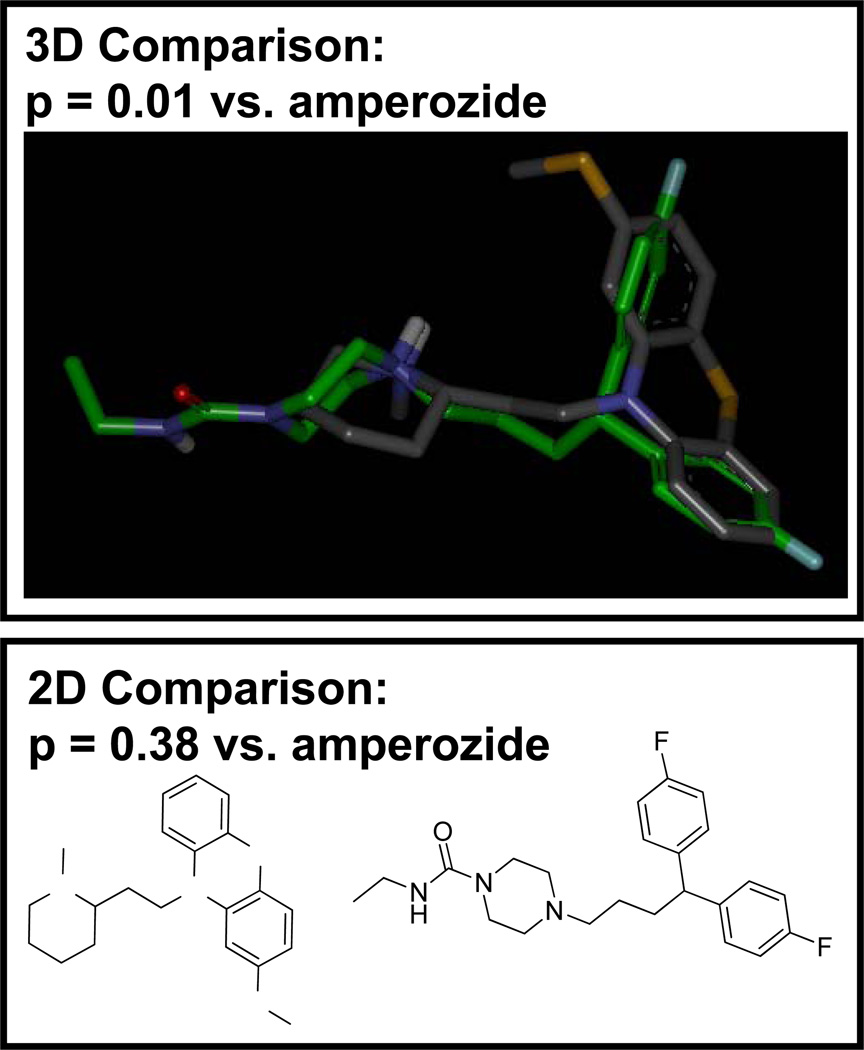
We made use of the nine molecules from Figure 1 as a set of known hERG ligands and computed the combined logs odds (using the 3D Surflex-Sim molecular similarity approach and the GSIM-2D approach [4; 5; 7; 8; 9]) for 987 small molecule drugs, all of which have been marketed in the US. Figure 3 shows thioridazine (a test molecule) compared with amperozide (known hERG ligand). The 3D comparison produced a sufficiently high score to yield a p-value of 0.01 (illustrated by the corresponding molecular alignment). The 2D comparison produced a p-value of 0.38, reflecting the lack of topological similarity between thioridazine and amperozide. Overall, the combined 2D+3D log-odds for thioridazine was 2.2, which would raise concern for cardiac potassium channel activity shared with the molecules from Figure 1. Of the 987 drugs tested, 12% had a combined log-odds score of 2.0 or greater. Of these, 15% are listed as either definitely or probably being involved in drug-induced long-QT [10], with a still larger fraction exhibiting dose-dependent hERG blockade at concentrations that are not frequently clinically significant [11]. Less than 4% with log-odds less than −2.0 appear on the list.
Figure 3.
Of nearly 1000 drugs, 15% of those scoring a combined log-odds of greater than 2.0 are implicated as either definite or probable causes of drug-induced long-QT. For thioridazine, 3D similarity from Surflex-Sim generated the preponderance of evidence (the overall 3D log odds using all 9 molecules from Figure 1 was 2.9, with 2D comparisons slightly diluting the information to yield a combined score of 2.2).
In particular, both terfenadine and thioridazine had log-odds scores greater than 2.0. However, the remaining three drugs from Figure 2 had scores between −0.2 and 1.2, low enough that a large fraction of drugs share similar scores. The structural diversity of the 9 drugs from Figure 1 was not sufficient to paint an accurate picture of the breadth of structures that modulate hERG at relevant potencies. If we imagine an iterative process where computational predictions are followed by confirmatory assays, we can see how additional knowledge affects the breadth of coverage of similarity-based off-target prediction. In addition to terfenadine and thioridazine, the following 10 drugs with hERG related long-QT effects were all patented in 1992 or earlier and produced log-odds scores of 2.0 or greater: bepridil, chlorpromazine, disopyramide, droperidol, haloperidol, mesoridazine, methadone, pimozide, procainamide, and venlafaxine. All but one were also marketed prior to 1992 (venlaflaxine was patented in 1984 and approved in 1993). Using all 21 molecules (9 from Figure 1 and the 12 just listed), we repeated the log-odds computation. Log-odds scores computed using the larger and more structurally diverse list revealed more cognate ligands. The combined log-odds scores were 3.7 for astemizole, 2.3 for mibefradil, and 0.2 for cisapride. With this simple iteration, four of the five drugs from Figure 2 were identified with log-odds > 2 (note also that the 3D-only log-odds for cisapride was 2.5, and it exhibited a convincing alignment against droperidol).
Summary and Perspective
This demonstration illustrates two key points. First, in cases of suprising biological activity, there is little reason to believe that 2D molecular analysis will reveal the effects. For the molecules from Figure 2, only one (terfenadine) received significant positive information from consideration of its 2D similarity. Of the twelve drugs that were revealed by the combination of 3D and 2D log-odds, only four had 2D log-odds > 2.0.
This is consistent with our previous work [4; 5], but it is important to emphasize the basic point. The range of intentional molecular design is generally quite narrow compared with what can actually bind a particular pocket. Consider the case of Molecule A designed to hit Target X but with an unknown and clinically relevant liability against Target Y. It is very unlikely that someone else will have made and assayed and published the structure of Molecule B and its activity against Target Y where Molecule B is also highly 2D similar to Molecule A. Our recent paper discusses this point in additional detail, highlighting the fact that what can be discovered through 2D approaches often consitutes a re-discovery of what someone else already knew [5].
The second point is that off-target identification at the binary level, without some ability to address potency, will have limited utility, especially for promiscuous targets such as hERG. At a log-odds threshold of 2.0, just 15% of the identified drugs are likely to have clinically relevant cardiac side-effects. In our previous work [5], 85% of drugs with log-odds greater than 2.0 against a panel of known muscarinic antagonists showed clinically relevant muscarinic side-effects such as dry-mouth. A great many drugs can be shown to have dose-dependent pore-competitive binding to hERG, but many fewer have such effects at concentrations that will lead to clinically catastrophic effects. In the particular case of hERG, since the health risks are so dramatic, sensible development will generally involve detailed cardiac asssessment for any potential development candidate that has a tertiary amine. But this cannot be done for any and all targets that might cause clinically important side-effects, at least not routinely in early lead optimization. We believe that most targets will require more detailed modeling and predictions of the concentrations at which significant effects will arise.
We envision an extensive computational screening platform that will combine first-line similarity-based approaches such as those described in this section with binding affinity prediction, which will be discussed next. The goal is a system of computational modeling for many targets in which accurate predictions on broadly varying molecular scaffolds are possible. This will require explicit estimation of confidence, so that routine application during lead optimization will help avoid unwanted biological effects without predicting so many potential problems that wet follow-up is impractical.
Binding Affinity Prediction and QSAR
The field of QSAR, as discussed in the Introduction, is one where the problems of the correlation fallacy have been clearly exposed [2], and given the focus of most of the QSAR field on congeneric molecular series, the issue of confirmation bias is readily apparent. The hERG example provides a very challenging and realistic case where methods that are restricted to narrow series of molecules will not provide accurate predictions in the important cases. As reported by Ekins et al. [11], this has not prevented many groups from constructing QSAR models for hERG, some with reasonable nominal statistical performance (including the models reported in that study). But what can be done if one takes pains to limit confirmation bias effects and construct a predictive model that can be clearly seen to be related to physical reality?
For a training set, we used the 42 molecules from the Ekins study that were patented in 1992 or earlier (all such molecules from Supplementary Table I). We excluded the drugs in Figure 2 to provide a particularly interesting test and because they were all withdrawn later than 1992. We identified a test set that included all drugs (from the 987 screened) for which our computed combined log-odds score (see above) was greater than 0.0 and had hERG assay data available from the full Ekins data set. This set contained 27 molecules (including the 5 from Figure 2). All of the training molecules had compositions of matter available as of 1992, and all could have been assessed for cardiac potassium channel activity at that time. Given the sharp temporal restriction on the training set, there was very little obvious structural similarity between the training and test sets (discussed in more detail later).
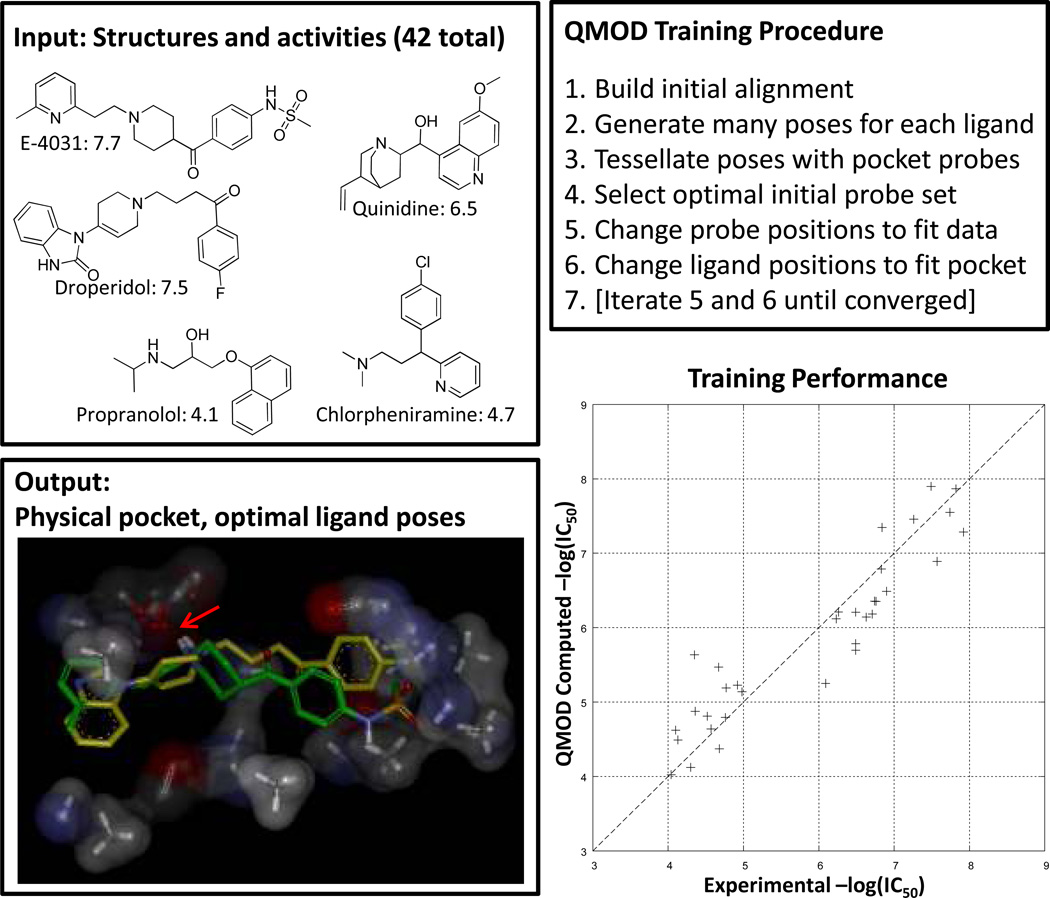
To construct a physical model of the hERG binding pocket, we employed the Surflex-QMOD procedure [12; 13] using standard procedures, without a single human choice-point. Figure 4 illustrates the procedure and the resulting “pocketmol” which is used as a virtual protein pocket against which new molecules are docked and scored. The QMOD algorithm itself is complex, requiring an approach to deriving a binding pocket where the scores of training molecules in their optimal poses according to their fit to the pocket match the experimental data. Because the optimal pose for each training molecule changes as the pocket evolves, multiple-instance machine-learning is required (additional details on multiple-instance learning for activity prediction and for scoring function development are available [12; 13; 14; 15; 16; 17; 18; 19; 20]). The procedure yielded three models under default settings, and the one that was quantitatively most parsimonious was chosen for testing (again, the default procedure). This is a departure from other QSAR methods, which often employ internal cross-validation procedures for model selection and make the selection based upon observed correlation. In the QMOD approach, the parsimony of a model is computed based on a real-valued measure of the degree of 3D surface shape and electrostatic similarity among pairs of training molecules whose activity is similar. In Figure 4, the optimal poses of E-4031 and droperidol are shown. Both bind the pocket in similar ways, making similar interactions (and have similar activity). The position highlighted by the arrow shows a set of multiple carbonyl “probes” that together form an electronegative surface against which the basic amines of the training ligands reliably align (thought to be a pi-cation effect in the actual ion channel). There is a hydrophobic pocket at right, with some opportunities for polar interactions. At left, the pocket opens up, offering little constraint on the overall size of ligands that can bind. However, in order to receive high scores, both the primary polar interaction often involving a protonated tertiary amine and the right-hand envelope must be occupied in precise geometries.
Figure 4.
Surflex-QMOD takes structures and activities as input and produces a physical model of a binding pocket. Training ligands in their optimal poses (according to the pocket’s preferences) produce scores close to those experimentally measured. The resulting model, by construction, yields a strong correlation with experimental activity (Kendall’s Tau = 0.80 (p << 0.001), r2 = 0.86). The final pocket along with the optimal poses of E-4031 (green) and droperidol (yellow) are shown at bottom left. The critical interaction with the ligands’ protonated amine is highlighted with a red arrow. The pocketmol has multiple carbonyl probes, which together approximate the effect of a negative charge of a particular magnitude, with some degree of mobility.
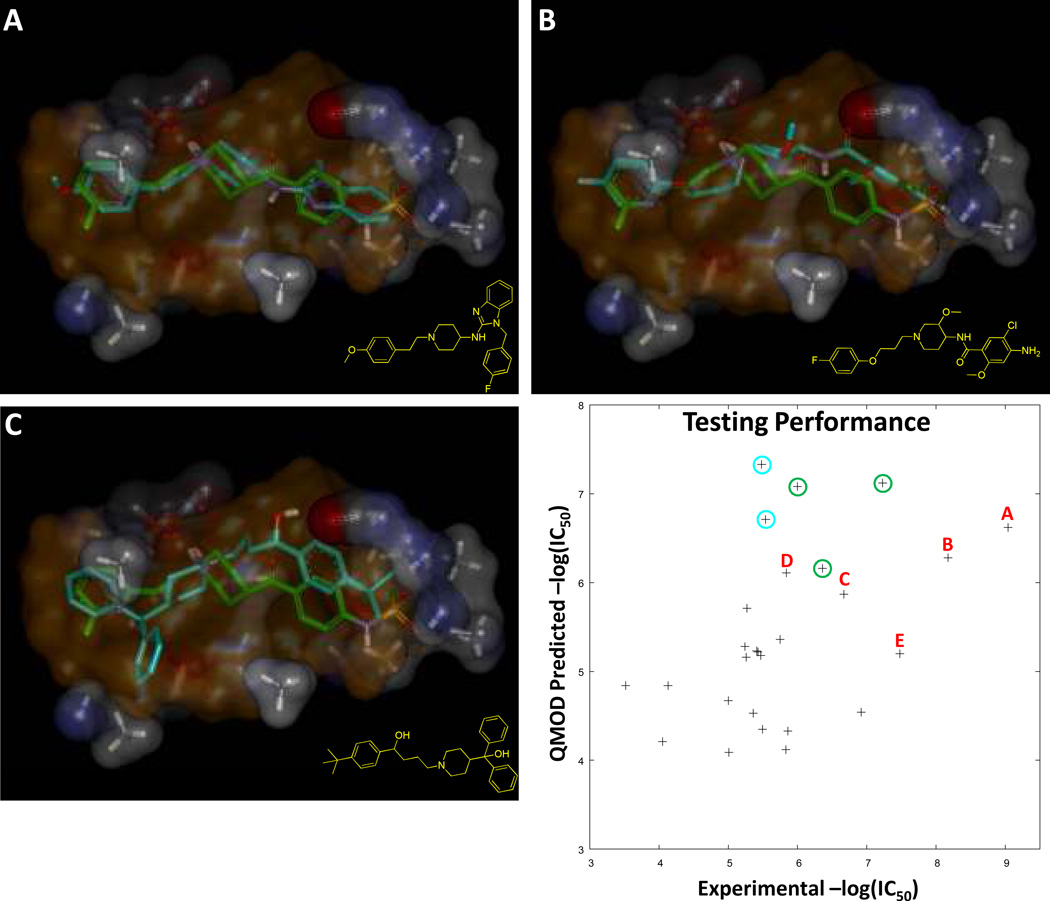
Figure 5 shows results for the 27 test molecules. Rank correlation was highly statistically significant (Kendall’s Tau of 0.45, p < 0.01 [ties called for molecules whose experimental activity differed by less than one-half log-unit]), with average absolute error of 0.9 log units. More important, perhaps, than statistics is that the model itself offers a physical basis from which observations can be made about the relevance of the predictions. All of the molecules from Figure 2 exhibited convincing alignments within the pocket; three are shown in Figure 5. Of the five molecules from Figure 2, four scored with a pIC50 of at least 5.9, and these four were among the top scoring six compounds tested whose desired effects are not directed toward cardiac arrhythmias. The other two (circled in blue) were sildenafil and trazodone, which scored higher than all of the five withdrawn compounds. Both of these drugs exhibit dose-dependent hERG blockade, and both have been reported to be involved in causing long-QT, but neither has been shown to produce effects so frequently that either drug has either been withdrawn or received a boxed warning regarding QT prolongation [21; 22]. Issues such as the relative potency of the hERG effects relative to the physiological concentrations of the drugs, effects on other cardiac channels, plasma protein binding, and so forth also come into play.
Figure 5.
Predictive performance of the QMOD pocketmol was assessed on the molecules for which log odds was non-negative, resulting in 27 molecules with measured hERG activity. Rank correlation was highly statistically significant (see text for details). The points in the plot labeled with letters correspond to the molecules from Figure 2, all withdrawn from the market due to cardiac issues involving long-QT: astemizole (A), cisapride (B), terfenadine (C), mibefradil (D), and thioridazine (E), the first three of which are shown in poses from fit into the pocketmol (test molecules in cyan, E-4031 in green, and the volume swept by the majority of training molecules in transparent orange). The points in the blue circles correspond to sildenafil and trazodone, both of which have clinical reports of cardiac side effects and dose-dependent hERG blockade. The points in the green circles correspond to amiodarone, dronedarone, and propafenone, all of which are cardiac anti-arrhythmics and which modulate hERG.
Summary and Perspective
The foregoing example is not intended to be a definitive account of hERG activity prediction for diverse ligands. It is meant to illustrate the challenge of meaningful modeling of non-obvious effects and to offer some positive evidence that the problem is within the realm of possibility.
These results were statistically similar to those presented by Ekins (Kendall’s Tau = 0.51, mean absolute error = 0.8), who trained a model on 99 molecules, using a recursive partitioning algorithm that considered hundreds of descriptors, which was then tested on 35 molecules. However, those results were strongly dependent on the presence of 18 test molecules that had high Tanimoto similarity (≥ 0.77) to at least one of the training molecules. For example, sildenafil was in the training set, and vardenafil, which differs by only a few atoms, was in the test set. The hERG activity of the pair differs by only 0.6 log units. If we eliminate the test molecules that had high similarity from the results presented by Ekins, Kendall’s Tau for the remaining 17 drops to 0.20 (p = 0.18), indistinguishable from a random correlation.
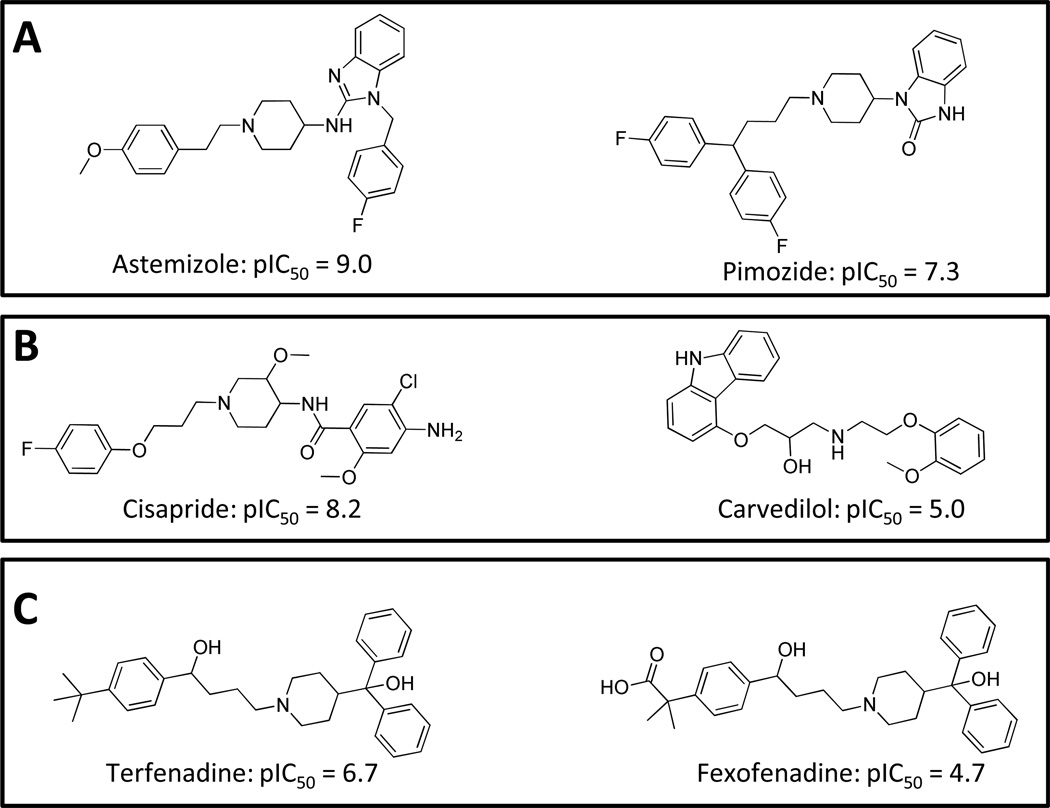
By contrast, Figure 6 shows the nearest 2D training set neighbor for each of the three drugs highlighted in Figure 5 for the QMOD example. In the first two cases, the nearest neighbors were of very different scaffolds, as well as having large activity differences (1.7 and 3.2 log units). The case of terfenadine was interesting, since a close analog, fexofenadine, was contained in the training set. Fexofenadine is a metabolite of terfenadine, differing only by two heavy atoms. However, that difference is sufficiently large to yield a 2.0 log unit difference in activity against hERG, which is enough to account for terfenadine being withdrawn, but fexofenadine being marketed as an antihistamine under the brand name Allegra. Note also that this was the single case of such extreme 2D similarity between any train/test molecule pair within the QMOD example (and only arose because of the explicit exclusion of the Figure 2 molecules from the training set).
Figure 6.
Structures of the three drugs from Figure 6 correctly predicted to have unexpected and high hERG activity (left), along with the corresponding nearest neighbor by 2D similarity from the training set. In each case, the nearest topological neighbor was at least 1.7 log units weaker in IC50.
QSAR models generally have some domain of applicability within which their predictive ability reaches levels that become practically useful. QSAR models with narrow applicability domains can be useful, especially in lead-optimization where, for example, maintenance of potency is required during engineering of other desirable properties. However, the biggest challenges within the drug discovery arena involve cases where broad applicability is a genuine requirement. In these cases, modeling methods whose success stems from the correlation fallacy and confirmation bias (either in model construction or in model validation) will begin to fail.
Our research approach will continue to focus on minimizing correlation fallacy problems by pursuing methods grounded in physical reality, where model selection is not driven primarily by correlation, and where validation is carefully designed (e.g. by temporal partitioning) to minimize the inherent confirmation bias that leaks into molecular data sets.
Molecular Similarity: Circular Conformation Bias Writ Large
As should be clear from the foregoing discussion, the existence of a convenient pile of molecules that someone else has made that share extremely high 2D similarity to a molecule that is found to have a particular activity at a particular time should not be expected. Generally, it is the discovery of the biological activity of a particular molecule that leads to the synthesis of close analogs that share the activity. Considering Figure 3, molecular similarity methods that can quantitatively relate molecules like thioridazine with molecules that are as structurally different as amperozide have true utility in drug discovery, for virtual screening, relative pose prediction, molecular diversity computation, and for uncovering surprising off-target effects. This is not a controversial point, and it has been demonstrated by multiple groups over many years [4; 7; 8; 17; 23; 24; 25; 26; 27; 28; 29].
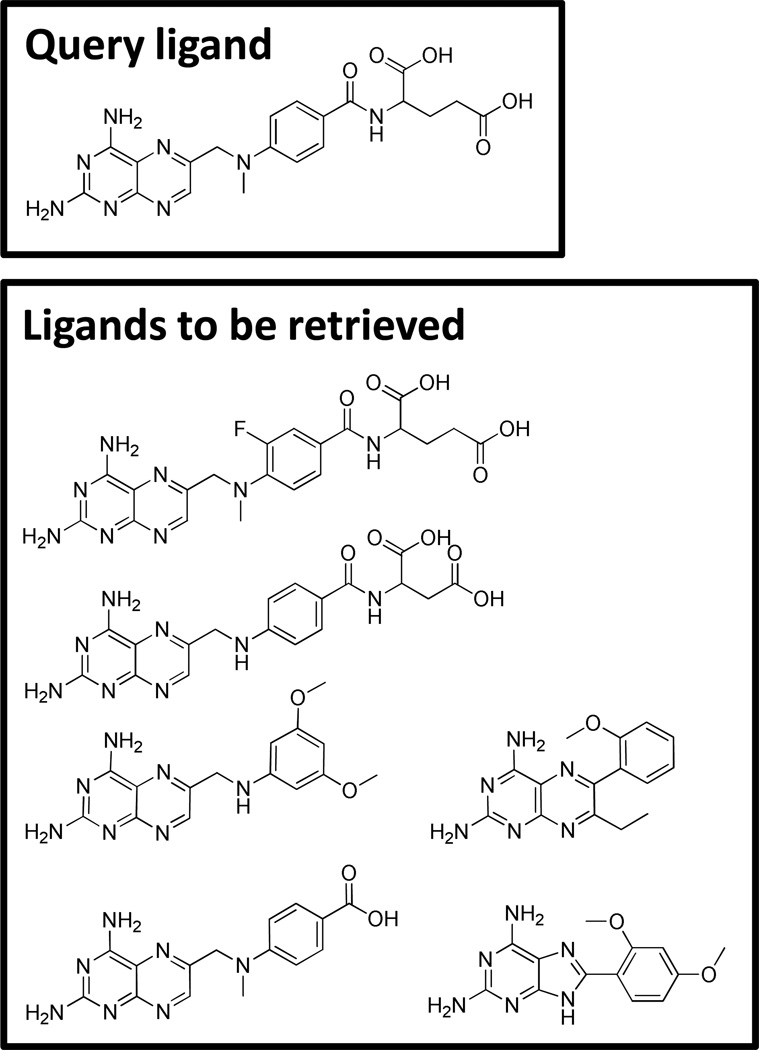
Despite this, many researchers persist in making use of testing systems such as those depicted in Figure 7 for assessing the performance of molecular similarity for virtual screening. The example was drawn from the DUD docking benchmark [30]. Given a single protein structure, it is well-known that docking multiple known ligands with high scores and in the correct geometry can be challenging, in part due to induced-fit effects. So, benchmarks with a high fraction of structural analogs may be appropriate for docking (both for virtual screening and binding pose prediction), and even there do not form the most challenging cases. For ligand-based virtual screening, the cognate ligand of the protein structure is usually used as the query ligand (here, methotrexate). The extreme 2D structural similarity of the ligands to be retrieved makes this totally inappropriate for assessment of the performance of molecular similarity methods. Worse, such performance is often directly compared with the performance of docking systems! Retrieval of such obvious structural analogs has been a solved problem for over 20 years [31].
Figure 7.
Data sets such as the one depicted here have been used to demonstrate the performance of ligand-based similarity. The crystallographic ligand of the DUD target for DHFR (boxed) is used as a “query” and the other ligands are typical of those that serve as known true positive ligand examples.
Summary and Perspective
We have discussed this issue in general, and use of the DUD benchmark for assessing molecular similarity performance in particular, at great length previously [4] and shall not belabor the point here. We find it shocking, however, that researchers continue to make use of tests that are so clearly compromised by confirmation bias. What is an appropriate test then?
We have found that two strategies help to identify challenging tests that reduce confirmation bias problems [4; 9]. The first is temporal partitioning, where the molecules used as “knowns” had been identified before the molecules to be used as “unknowns” as was done in some respects above with the hERG example. The second can be called “intellectual” partitioning. The molecules used as “knowns” will have been designed intentionally to have a particular activity, and the “unknowns” will have had the activity discovered serendipitously.
Docking Ligands for Screening and Pose Predictions
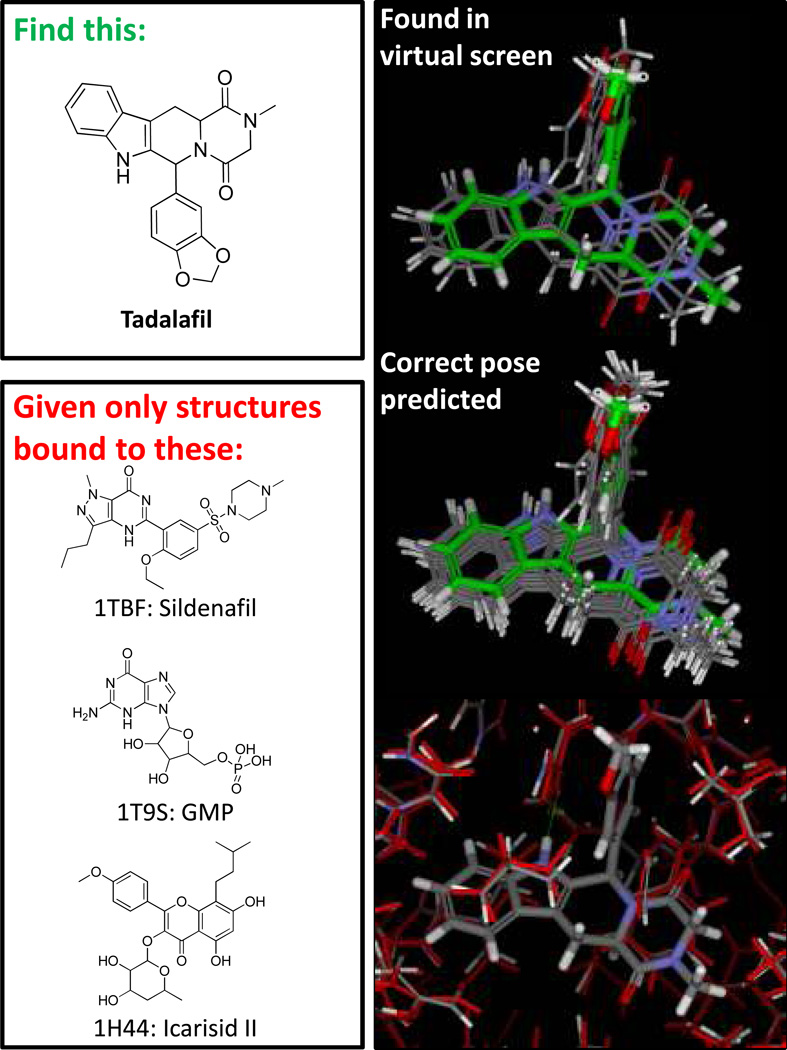
Figure 8 depicts a challenging and relevant problem for molecular docking. Given a small number of structural variants of a protein of established clinical relevance (PDE5 bound to three different ligands), is it possible to identify an extremely different molecule from a large screen and to predict its bound configuration correctly? Here, molecular similarity (even sophisticated 3D methods) are not up to the task, human molecular intuition likely argues against tadalafil, and it happens to be the case that PDE5 undergoes some significant rearrangements on binding different inhibitors.
Figure 8.
The problem of identifying a molecule such as tadalafil through docking, when given only PDE5 structures bound to dissimilar ligands, is challenging. By using multiple protein structures and a generalized approach to ligand ring search, Surflex-Dock finds solutions (top right) that are ranked very high among random screening compounds. Further refinement through protein pocket adaptation and pose family clustering produces a high-confidence pose prediction (middle right) that clearly matches the correct bound configuration of tadalafil. Movements within the protein pocket as part of the docking process are typically not large (bottom right), but they can be crucial for correct pose ranking.
The Surflex-Dock multi-structure docking protocol [32] identified tadalafil at a sufficiently high score to easily identify it in a virtual screen (top-scoring poses shown at top right in Figure 8 along with the experimentally determined pose). In this case, the correct binding configuration was identified without the requirement for local pocket adaptation, but in many cases additional refinement of the protein pocket as part of the docking process allows for more accurate ranking of binding predictions. The middle panel shows the top-scoring pose family, computed to cover 85% of the expected bound configurations of tadalafil, and this set of poses clearly covers the correct solution. The bottom panel shows the typical degree of protein pocket movement that occurs during the refinement phase of the full protocol. On a very challenging cross-docking benchmark from Sutherland et al. [33], this protocol was able to identify the correct bound pose within the top two pose families across eight targets 75% of the time on average. We are in the process of establishing the degree to which use of multiple protein structures improves the performance of virtual screening.
Summary and Perspective
We believe that docking offers the chance for truly unique contributions to drug discovery because the information present in protein structures is unique. All ligand-based methods are limited by what has been discovered through a necessarily limited and often biased exploration of what might bind a particular pocket. Methods that make use of protein structures should be developed in order to address problems that cannot be easily solved using other means: virtual screening to identify very novel lead compounds, pose prediction on ligands whose bound configuration is not easily guessed by analogy, and binding affinity prediction both for close analogs and for novel ligands.
One might imagine that the problems of the correlation fallacy and confirmation bias are not significant here, since docking is so physical in its nature. Confirmation bias is exhibited most egregiously in pose prediction tests involve cognate docking. This case is already artificial because the protein is known to be in a receptive configuration for the ligand to be re-docked. Additional bias can be enforced by jointly optimizing the complex of ligand and protein, thereby making the protein configuration yet more receptive and explicitly creating a local energy minimum in the correct place for the scoring function to be used in the re-docking. Yet more bias can be added by measuring the deviation from “correct” using the coordinates of the optimized ligand in place of the coordinates from the crystallographically determined ones. We have discussed and quantified this effect previously [34; 35; 36]. It is possible to achieve arbitrary gains in nominal performance through this type of coordinate optimization, which was introduced in the performance evaluation of a new docking method in 2004 [37].
This type of confirmation bias is not particularly subtle, but the impact of the correlation fallacy on docking studies can be more difficult to see. Consider again the ligands from Figure 7, all of which bind DHFR and all of which place the heterocycle in almost exactly the same geometry. These ligands are relatively easy to dock in close to correct binding geometries. Consider a set of decoy molecules also docked into DHFR, the scores of which may be somewhat confusable with those of the bona fide ligands. One can construct interaction maps that characterize which protein atoms interact with the docked ligands, and these will reflect an extremely high incidence of correlated contacts for the set of atoms that contact the diaminopteridine ring system of the true active ligands. One can make use of a statistical technique to “learn” the interaction features that are important for specific DHFR inhibition by partitioning the actives and decoys into training and test sets. That such a method will be able to improve one’s ability to distinguish between the test actives and decoys owes more to the correlation fallacy and to confirmation bias than to having learned anything. It is only because such a high proportion of the training and test molecules share so much structural similarity that the learned “features” will appear to be so significant. Yet more subtle than this would be an unsupervised learning procedure that automatically “discovered” the presence of a cluster of highly cross-correlated contacts. The presence of such a cluster was guaranteed in the construction of the test case.
Docking method development and evaluation are not at all immune from the problems of confirmation bias and the correlation fallacy. The situation is perhaps more dangerous than for other modeling arenas where such problems are much easier to spot.
Conclusions
Provision of a rigged scale and a small duck to prove witchcraft pales in comparison to the enormous creativity displayed in the field of molecular modeling by way of confirmation bias. Presuming witchcraft on the basis of a large nose and a pointy hat is also pedestrian when compared with the Herculean efforts made over decades to prove the relevance of modeling methods whose primary reasoning is underpinned by the correlation fallacy.
In striving to do better, it must be understood that the effects of these two fallacies on the existing population of molecules and associated biological activity data make even a benign data set selection very likely to provide confirmatory evidence for methods that share the fallacies. Therefore, it is incumbent on serious researchers attempting to address challenging problems in the field to take great care in designing strategies for method evaluation.
One might imagine that the two fallacies we have discussed here apply exclusively to those engaged in empirical parameter estimation through some computational procedure. At the physics-based end of the spectrum, one can see the same problems. Some such researchers make adjustments to values (shunning the term “parameters”) on which a model depends in a fashion that matches a favored theory of some sort. They continue to try new values and combinations until the model produces favorable results on a data set. At its worst, this process is just as problematic as QSAR with its abundant sins. Also, because the physicist may believe that parameter adjustment is not actually happening, they may see no need for even a nominally blind test of the model. Here, even though the model may be physically realistic and sensibly constructed, its predictions may be very poor, having resulted from a walk in parameter space whose only virtue was that of feeling virtuous. The problem, of course, is that the space of virtuous parameter combinations is actually very large, and no procedure may have been employed to ensure that overfitting did not occur. This being said, the result of such explorations might actually produce a very good model. Intuition and good sense might identify parameters for a physically realistic model that, when combined, generalizes well.
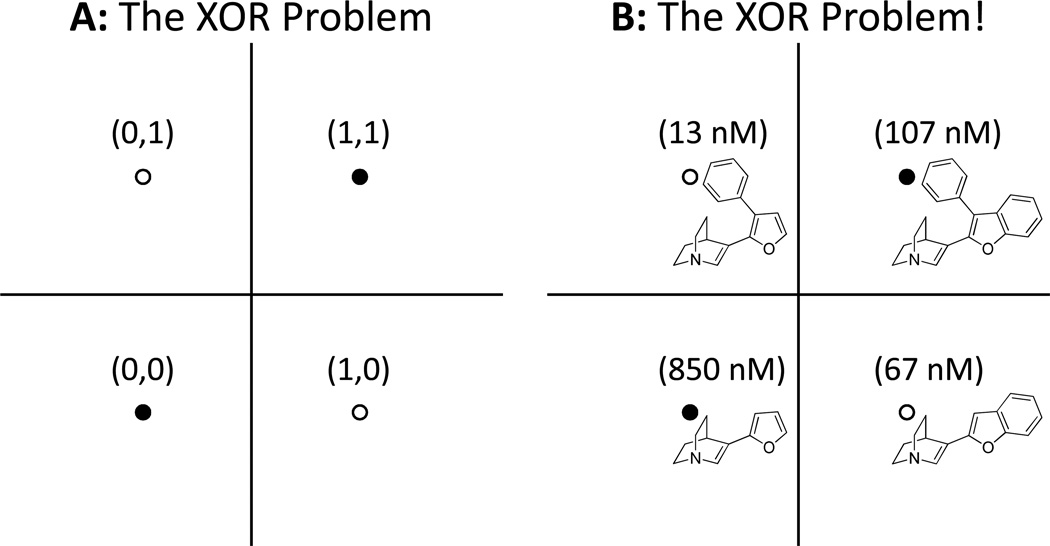
We believe that this issue of physical reality is central to improvements in molecular modeling, even in addition to the cautions discussed here at length about the correlation fallacy and confirmation bias. We will conclude with a contrast between molecular modeling and the older field of machine-learning. By the early 1960’s, linear models (called perceptrons) had been developed and explored as a means to develop machine intelligence [38]. In 1969, Marvin Minsky and Seymour Papert [39] published a monograph in which they observed that the perceptron approach could not learn the logical function of exclusive-or (XOR). The XOR function maps (0,0) and (1,1) to 0 and (0,1) and (1,0) to 1 (see Figure 9 for a graphical depiction). This observation was the principle factor in the decline of research on network learning models such as perceptrons. It was not until twenty years later that non-linear models (and corresponding parameter estimation regimes) were shown to be able to address the XOR problem [40], at which point research in the area was again pursued with great vigor. Figure 9 also shows an example of four muscarinic inhibitors that exhibit non-additive behavior with respect to the effects of substituents on activity [12]. This example is exactly isomorphic to the XOR problem, and it cannot be solved by any linear modeling approach. As we have discussed previously [12], this type of non-additivity can arise when two substituents on a scaffold make the resulting molecule too big to fit into a binding site without strain. Non-additivity is a natural physical consequence of the interplay between ligand variations and a binding pocket. Despite this, much of the QSAR field persists in building models and developing methods that assume linear additivity of the effects of substituents or descriptors.
Figure 9.
In panel A, we see the logical XOR problem depicted on a 2D plane. It is not possible to draw a line (equivalent to a perceptron) that separates the filled circles (false logical value) from the open circles (true logical value). A common occurrence in molecular modeling is depicted in panel B with four muscarinic antagonists, where each of two single substitutions on a central scaffold improves potency, but their combination is worse than either of the single substitutions. Using an activity threshold of 100nM (less than 100nM maps to 1, else 0), the activity prediction problem is seen to be isomorphic to the XOR problem.
For molecular modeling to see an acceleration in the utility of the tools that we produce, more research groups will need to focus their attention on approaches that, at the very least, do not make assumptions that violate fundamental physical principles. Research groups must also be more sensitive to the especially pernicious problems in molecular modeling that stem from the correlation fallacy and confirmation bias, as expressed in the data that exist, the modeling methods we create, and the means by which we test them.
We recommend moving beyond the hunting of witches and the weighing of ducks.
Acknowledgements
The authors gratefully acknowledge NIH for partial funding of the work (grant GM070481). Dr. Jain has a financial interest in BioPharmics LLC, a biotechnology company whose main focus is in the development of methods for computational modeling in drug discovery. Tripos Inc. has exclusive commercial distribution rights for Surflex-Dock and Surflex-Sim, licensed from BioPharmics LLC.
References
- 1.Nickerson RS. Review of General Psychology. 1998;2:175. [Google Scholar]
- 2.Johnson SR. J Chem Inf Model. 2008;48:25. doi: 10.1021/ci700332k. [DOI] [PubMed] [Google Scholar]
- 3.Kannankeril P, Roden DM, Darbar D. Pharmacol Rev. 2010;62:760. doi: 10.1124/pr.110.003723. [DOI] [PMC free article] [PubMed] [Google Scholar]
- 4.Cleves AE, Jain AN. J Comput Aided Mol Des. 2008;22:147. doi: 10.1007/s10822-007-9150-y. [DOI] [PubMed] [Google Scholar]
- 5.Yera ER, Cleves AE, Jain AN. J Med Chem. 2011;54:6771. doi: 10.1021/jm200666a. [DOI] [PMC free article] [PubMed] [Google Scholar]
- 6.Kola I, Landis J. Nature Reviews Drug Discovery. 2004;3:711. doi: 10.1038/nrd1470. [DOI] [PubMed] [Google Scholar]
- 7.Cleves AE, Jain AN. J Med Chem. 2006;49:2921. doi: 10.1021/jm051139t. [DOI] [PubMed] [Google Scholar]
- 8.Jain AN. J Comput Aided Mol. 2000;14:199. doi: 10.1023/a:1008100132405. [DOI] [PubMed] [Google Scholar]
- 9.Jain AN. J Med Chem. 2004;47:947. doi: 10.1021/jm030520f. [DOI] [PubMed] [Google Scholar]
- 10.Romero K, Woosley RL. Pharmacoepidemiology and drug safety. 2009;18:423. doi: 10.1002/pds.1727. [DOI] [PubMed] [Google Scholar]
- 11.Ekins S, Balakin KV, Savchuk N, Ivanenkov Y. Journal of medicinal chemistry. 2006;49:5059. doi: 10.1021/jm060076r. [DOI] [PubMed] [Google Scholar]
- 12.Jain AN. J Comput Aided Mol Des. 2010;24:865. doi: 10.1007/s10822-010-9379-8. [DOI] [PMC free article] [PubMed] [Google Scholar]
- 13.Langham JJ, Cleves AE, Spitzer R, Kirshner D, Jain AN. J Med Chem. 2009;52:6107. doi: 10.1021/jm901096y. [DOI] [PMC free article] [PubMed] [Google Scholar]
- 14.Dietterich TG, Lathrop RH, Lozano-Perez T. Artif. Intell. 1997;89:31. [Google Scholar]
- 15.Jain AN, Dietterich TG, Lathrop RH, Chapman D, Critchlow RE, Jr, Bauer BE, Webster TA, Lozano-Perez T. J Comput Aided Mol Des. 1994;8:635. doi: 10.1007/BF00124012. [DOI] [PubMed] [Google Scholar]
- 16.Jain AN, Koile K, Chapman D. J Med Chem. 1994;37:2315. doi: 10.1021/jm00041a010. [DOI] [PubMed] [Google Scholar]
- 17.Jain AN, Harris NL, Park JY. J Med Chem. 1995;38:1295. doi: 10.1021/jm00008a008. [DOI] [PubMed] [Google Scholar]
- 18.Jain AN. J Comput Aided Mol Des. 1996;10:427. doi: 10.1007/BF00124474. [DOI] [PubMed] [Google Scholar]
- 19.Pham TA, Jain AN. J Med Chem. 2006;49:5856. doi: 10.1021/jm050040j. [DOI] [PubMed] [Google Scholar]
- 20.Pham TA, Jain AN. J Comput Aided Mol Des. 2008;22:269. doi: 10.1007/s10822-008-9174-y. [DOI] [PMC free article] [PubMed] [Google Scholar]
- 21.Dustan Sarazan R, Crumb WJ. European journal of pharmacology. 2004;502:163. doi: 10.1016/j.ejphar.2004.09.005. [DOI] [PubMed] [Google Scholar]
- 22.Tarantino P, Appleton N, Lansdell K. European journal of pharmacology. 2005;510:75. doi: 10.1016/j.ejphar.2005.01.009. [DOI] [PubMed] [Google Scholar]
- 23.Grant J, Gallardo M, Pickup B. Journal of Computational Chemistry. 1996;17:1653. [Google Scholar]
- 24.Masek BB, Merchant A, Matthew JB. Proteins. 1993;17:193. doi: 10.1002/prot.340170208. [DOI] [PubMed] [Google Scholar]
- 25.Masek BB, Merchant A, Matthew JB. J Med Chem. 1993;36:1230. doi: 10.1021/jm00061a014. [DOI] [PubMed] [Google Scholar]
- 26.Mount J, Ruppert J, Welch W, Jain AN. J Med Chem. 1999;42:60. doi: 10.1021/jm970775r. [DOI] [PubMed] [Google Scholar]
- 27.Nicholls A, McGaughey GB, Sheridan RP, Good AC, Warren G, Mathieu M, Muchmore SW, Brown SP, Grant JA, Haigh JA, Nevins N, Jain AN, Kelley B. J Med. Chem. 2010;53:3862. doi: 10.1021/jm900818s. [DOI] [PMC free article] [PubMed] [Google Scholar]
- 28.Perkins E, Sun D, Nguyen A, Tulac S, Francesco M, Tavana H, Nguyen H, Tugendreich S, Barthmaier P, Couto J, Yeh E, Thode S, Jarnagin K, Jain AN, Morgans D, Melese T. Cancer Res. 2001;61:4175. [PubMed] [Google Scholar]
- 29.Hawkins PC, Skillman AG, Nicholls A. J Med Chem. 2007;50:74. doi: 10.1021/jm0603365. [DOI] [PubMed] [Google Scholar]
- 30.Huang N, Shoichet BK, Irwin JJ. J Med Chem. 2006;49:6789. doi: 10.1021/jm0608356. [DOI] [PMC free article] [PubMed] [Google Scholar]
- 31.Willett J. Similarity and clustering in chemical information systems. John Wiley & Sons, Inc; 1987. [Google Scholar]
- 32.Jain AN. J Comput Aided Mol Des. 2009;23:355. doi: 10.1007/s10822-009-9266-3. [DOI] [PMC free article] [PubMed] [Google Scholar]
- 33.Sutherland JJ, Nandigam RK, Erickson JA, Vieth M. J Chem Inf Model. 2007;47:2293. doi: 10.1021/ci700253h. [DOI] [PubMed] [Google Scholar]
- 34.Jain AN. J Comput Aided Mol Des. 2007;21:281. doi: 10.1007/s10822-007-9114-2. [DOI] [PubMed] [Google Scholar]
- 35.Jain AN. J Comput Aided Mol Des. 2008;22:201. doi: 10.1007/s10822-007-9151-x. [DOI] [PubMed] [Google Scholar]
- 36.Jain AN, Nicholls A. J Comput Aided Mol Des. 2008;22:133. doi: 10.1007/s10822-008-9196-5. [DOI] [PMC free article] [PubMed] [Google Scholar]
- 37.Halgren TA, Murphy RB, Friesner RA, Beard HS, Frye LL, Pollard WT, Banks JL. J Med Chem. 2004;47:1750. doi: 10.1021/jm030644s. [DOI] [PubMed] [Google Scholar]
- 38.Rosenblatt F. Principles of Neurodynamics. Perceptrons and the Theory of Brain Mechanisms. DTIC Document; 1961. [Google Scholar]
- 39.Minsky M, Papert S. Perceptrons. MIT press; 1969. [Google Scholar]
- 40.Rumelhart DE, McClelland JL. Parallel distributed processing. MIT Press; 1988. [Google Scholar]


