Abstract
The objective was to evaluate the toxicity and feasibility of intraperitoneal (IP) infusion of tumor-specific cytotoxic T-lymphocytes (CTL) as therapy for recurrent ovarian cancer, and to determine if repetitive cycles of CTL generation and infusion measurably increases the host’s ovarian cancer immune response.
In this study, seven subjects with recurrent ovarian cancer confined to the peritoneal cavity underwent up to 4 cycles, each cycle beginning with a leukapheresis for collection of precursor lymphocytes, which were stimulated in vitro with MUC1, a tumor-specific antigen found commonly in ovarian cancer cells. The resulting new CTL for each cycle were re-introduced into the host via IP infusion. Immunological parameters (killer cells, cytokine production, memory T-lymphocytes and natural killer (NK) cells) were studied. Toxicity, CA-125, and survival data were also evaluated.
The tumor marker CA-125 was non statistically significantly reduced after the first month of immunotherapy. However, after that, it rose. Killer cells, cytokine production and memory T-lymphocytes increased after the first cycle of stimulation, but plateaued or reduced thereafter. The percent of NK cells inversely correlated with other immune parameters.
Median survival was 11.5 months. One subject is free of disease since December, 2000. Multiple cycles, beyond one cycle, of T-cell stimulation followed by adoptive T cell infusion, may not enhance the in vivo immune response.
Keywords: Adoptive immunotherapy, Stimulation, CTL, human, MUC1
Introduction
Subjects with recurrent ovarian cancer respond poorly to second line chemotherapy and virtually all will succumb to the disease, usually as a result of inanition due to extensive involvement of the peritoneal cavity and intestinal tract with tumor [1]. The evaluation of new therapeutic strategies is, therefore, needed. The peritoneal route of administration would seem desirable since the tumor is localized to this cavity. Intraperitoneal infusion of in vitro expanded tumor infiltrating lymphocytes (TIL) was shown to produce some clinical activity in subjects with ovarian cancer [2]. Another trial examined intraperitoneal infusion of autologous lymphocytes retargeted by a bispecific monoclonal antibody and IL-2. Clinical response was limited and toxicity, presumably due to the IL-2, was considered moderate [3]. An alternative approach is to stimulate T-lymphocytes with a specific tumor antigen in vitro.
The immune system recognizes tumors; however, the tumor microenvironment generates immunosuppressive cells leading to immune evasion of cancer [4]. An approach to overcome the immunosuppressive tumor microenvironment is to generate cells in vitro that will kill tumor cells. Cellular immunotherapy, in the form of cytotoxic T-lymphocytes (CTL), has been successful in treating viral-associated malignancies [5], some hematologic malignancies [6] and even certain solid tumors [7,8]. Antigen-specific CD8 T cell clones have also been shown to be effective for treatment of malignant disease [9], implying specificity to antigens on the tumor cells. Since CTL from ovarian cancer subjects recognize MUC1-expressing cancer cells [10,11], we used ex vivo stimulation of CTL with MUC1 to generate killer cells for adoptive immunotherapy. These CTL were used to attempt to augment the host immunologic response to tumor cells in subjects with recurrent ovarian cancer.
Materials and methods
Human Subjects Protection. The protocol was approved by the TTUHSC Investigational Review Board (IRB) and conducted under an IND of the Food and Drug Administration (FDA), which required subjects with relapsed cancer. Subjects were entered onto the protocol after obtaining consent. The goal was for 20 subjects, but was terminated because the FDA added a requirement for an endotoxin assay of cells in the infusion bag, which would have taken over two hours and reduced the cell number by half.
Trial Design
This was a study of subjects with recurrent epithelial ovarian cancer confined to the peritoneal cavity. Chemotherapy was completed within 4–6 weeks of protocol entry. Subjects underwent leukapheresis for collection of precursor lymphocytes on day 0, which were stimulated in vitro with MUC1. The resulting CTL were re-introduced into the host via intraperitoneal (IP) infusion, through an IP Infus-A-Port (Infusaid, Wysox, PA 18854), on days 9 – 11, for the first infusion, and on days 16 -- 18, for the second infusion, of each month. The cycle was repeated monthly up to 4 times. Subjects received no other intervention for the recurrent adenocarcinoma and no other therapy for the remainder of the cycle. Toxicity, CA-125, an ovarian cancer tumor antigen, and survival were compiled. Carcinoma cell cytotoxicity and cytokines, including G-IFN, GM-CSF and TNF-alpha, and immunophenotyping were also evaluated.
Apheresis and generation of CTL
Procedures were as detailed [12,13]. PBMC were collected from each subject by apheresis, without any stimulant to raise the PBMC count. The goal of each collection was a minimum of 1 x 10⁹ mononuclear cells. PBMC contain dendritic cells and the precursor-CTL that were later stimulated and expanded using the MUC 1 antigen. PBMC were cultured until tumor cell cytotoxicity or type 1 cytokines were statistically significantly elevated over day 0 unstimulated levels or for a maximum of one month. The infused cell number of 1–4 x 10⁸ CTL/m2 was based on an optimized study with non-specific stimulated PBMC [14], and was infused IP after one week (first infusion) or two weeks (second infusion) in culture. The process of apheresis for precursor-CTL collection, ex vivo stimulation and infusion was repeated every four weeks to complete four cycles or until recurrent disease was detected (whichever occurred first).
MUC1 Peptides
A single repeat of optimized context of MUC1-VNTR1 peptide GSTAPPAHGVTSAPDTRPAP [15] was synthesized by Peninsula Laboratories, Inc., Palo Alto, CA, USA.
Cell Culture Conditions
Procedures were as detailed [12,13]. MC were obtained from humans with ovarian adenocarcinomas by apheresis. Cells were cultured at 2 x 10⁶ cells/ml in AIM-V (Registered ) serum free lymphocyte medium (Life Technologies GIBCO-BRL, Grand Island, NY, 14072, USA) and maintained in a 37°C humidified 5% CO2 atmosphere. IL-2 (Cetus) was added twice per week at 100 IU/ml. Cells were stimulated with MUC1-VNTR1 peptide at 45 x 10−8 M (1ug/ml) on days 0, after freezing aliquots for assays with later aliquots, and 7. Cells were harvested on day eight, or on the indicated day, if either percent specific lysis of a mucin containing adenocarcinoma cell line, MCF-7, or G-IFN production was statistically significantly elevated over prestimulation, day 0, values. Cells were frozen for other assays.
Immunophenotyping
Procedures were as detailed [10,17]. Briefly, cells (5 x 10⁵ per aliquot) were obtained from ex vivo cultures on the indicated days, stained with fluorochrome-conjugated mAbs against the indicated CD markers (BD Pharmingen Inc., San Diego, CA, 14072, USA) and analyzed by flow cytometry using the Becton Dickinson FACScan/Lysis II (Registered ) or the BD Biosciences FACSCalibur (Registered ) system, per manufacturer’s instructions.
Cytotoxicity Assays
MCF-7, a HLA-A2 breast cancer cell line, was obtained from, and cultured as recommended, by the American Type Culture Collection (ATCC). MCF-7 expresses hypoglycosylated mucin [18]. This cell line was used as the CTL target cell line in a XTT assay (Registered ) (Roche Diagnostics Corp., Indianapolis, IN, 46250-0414, USA) [19], which was performed per manufacturer’s instructions. K562, a natural killer (NK)/lymphokine-activated killer (LAK) sensitive target [20] cell line, and RAJI, a NK-relatively resistant/(LAK) -sensitive target [21] cell line were used as target cell lines in an alamarBlue® assay (Biosource International Inc., Camarillo, CA, USA). K562 and RAJI were cultured in RPMI-1640 (Gibco-BRL, Life Technologies, Inc. Grand Island, NY, USA) supplemented with 10% FBS and 1% L-glutamine. All the cells were maintained in a 37°C humidified and 5% CO2 atmosphere. The effector cells were tested at the effector to target (E:T) cell ratio of 10:1.
Cytokine Assays
Levels of cytokines [G-IFN, GM-CSF, IL-10, and TNF-Alpha (BD Pharmingen Inc., San Diego, CA, 92121, USA)], were performed per manufacturer’s instructions from supernatants of MUC1-stimulated mononuclear cells (M1SMC).
Toxicity
Toxicity was evaluated by NCI Common Toxicity Criteria [22].
Statistical Analysis
The goal of this analysis was to determine if the distribution of each variable was changing over time (or month); preferably, we would like to see a monotonically increasing relationship. In order to test this assumption, the method of summary-statistics was used to analyze all data. Data from each subject was reduced to a single summary measure, in this case the Spearman’s rank correlation coefficient, rs, between the number of the month (t = 0, 1, 2, 3, 4 for pre-treatment, month 1, 2, 3 and 4, respectively. ) and the measured variable. Spearman’s correlation coefficient, a non-parametric correlation, was utilized as the small sample sizes and the boxplots (shown below) indicate that it cannot be assumed the variables were normally distributed. Due to the missing data from patient drop out, each rank correlation coefficient was weighted according to the square root of the number of measurements taken. The nonparametric sign test and Wilcoxon Signed Rank Test was then used to test the hypothesis that rs=0 versus rs>0. Student’s t test was used in paired comparisons. Mean (M) +/− standard error of the mean (SEM) are the values given in the text.
Results
Clinical
Seven subjects were enrolled in the protocol. Patient characteristics and clinical course summary are described in Table 1. All subjects had recurrent ovarian cancer, following resection and chemotherapy consisting of cisplatin or carboplatin and paclitaxel containing regiments. After recurrence of ovarian cancer, Patient 1 received topotecan, oral etoposide and intravenous liposomal doxorubicin. Subjects 2 and 3 had partial and complete, respectively, resection following recurrence. Chemotherapy was completed within 4–6 weeks of protocol entry. Their pre-study CA-125s varied from normal for Patient 2 to over a thousand. The number of 4 planned paired infusions was reduced due to disease progression in Subjects 3, 6 and 7. In addition, because of a port rupture, possibly due to a fall by Patient 3, or port occlusion in Subjects 4 and 5, the subjects refused another port. The latter two subjects received intraperitoneal chemotherapy prior to the cellular therapy trial. A fibrous sheath was found around each port. There was no toxicity except for grade 1 abdominal pain in Patient 2, at the time of infusion. Survival varied from two months to one patient (No. 2) being alive with no evidence of disease (NED) since December, 2000. This latter patient (No. 2), who had a rising CA-125 and increasing size of tumor, had resection of gross disease and concurrent cisplatin chemotherapy and radiation therapy after the completion of immunotherapy. Those with the highest pre-study CA-125s, Subjects 1 and 6, had the shortest survival of three and two months, respectively. The others survived from six months to one with NED (No. 2). There was no correlation between survival and the number of infusions of M1SMC. One of the shortest survivors of three months (No. 1) and the only long-term survivor (No. 2) both received the maximum planned number of four paired infusions.
Table 1.
Patient characteristics and clinical course summary
| Patient No. | Histology | Pre-study Therapy | Disease Status | Pre-study CA-125 | Number of Paired* infusions/month/4 maximum | Complications with intraperitoneal port | Toxicity NCI Common Toxicity Criteria [22] | Survival (months)** |
|---|---|---|---|---|---|---|---|---|
| 1 | Poorly differentiated/Epithelial papillary serous adenocarcinoma | Resection Chemotherapy*** | Recurrent | 1455 | 4 | None | None | 3 |
| 2 | Moderately differentiated/Epithelial not otherwise specified adenocarcinoma | Resection Chemotherapy Partial Resection | Recurrent | 22 | 4 | None | Grade 1 abdominal pain | NED**** since Dec, 2000 |
| 3 | Poorly differentiated/Epithelial papillary adenocarcinoma | Resection Chemotherapy Resection | Recurrent | 70 | 3 Progressive Disease | Ruptured | None | 6 |
| 4 | Poorly differentiated/Epithelial papillary serous adenocarcinoma | Resection Chemotherapy | Recurrent | 122 | 2.5 | Occluded | None | 18 |
| 5 | Poorly differentiated/Epithelial papillary serous adenocarcinoma | Resection Chemotherapy | Recurrent | 56 | 1 | Occluded | None | 6 |
| 6 | Well differentiated/Epithelial papillary serous adenocarcinoma | Resection Chemotherapy | Recurrent | 983 | 2 Progressive Disease | None | None | 2 |
| 7 | Poorly differentiated/Epithelial papillary serous adenocarcinoma | Resection Chemotherapy | Recurrent | 183 | 4 | None | None | 15 |
After one week (first infusion) or two weeks (second infusion) in culture
After completion of MUC1-stimulated mononuclear cells (M1SMC) therapy
Chemotherapy was cisplatin or carboplatin and paclitaxel containing regiments were completed within 4–6 weeks of protocol entry.
NED = no evidence of disease (after resection of gross disease and concurrent cisplatin chemotherapy and radiation therapy)
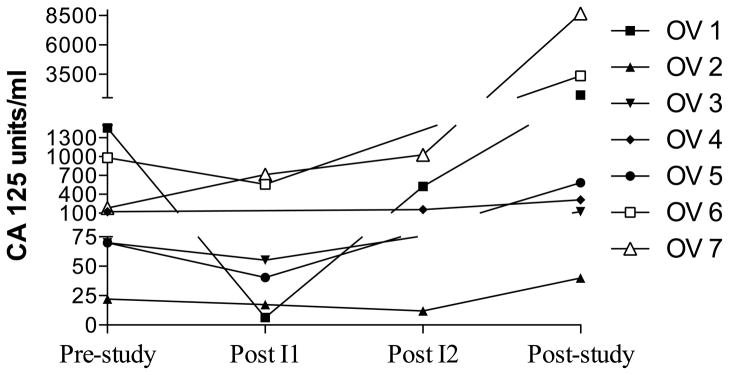
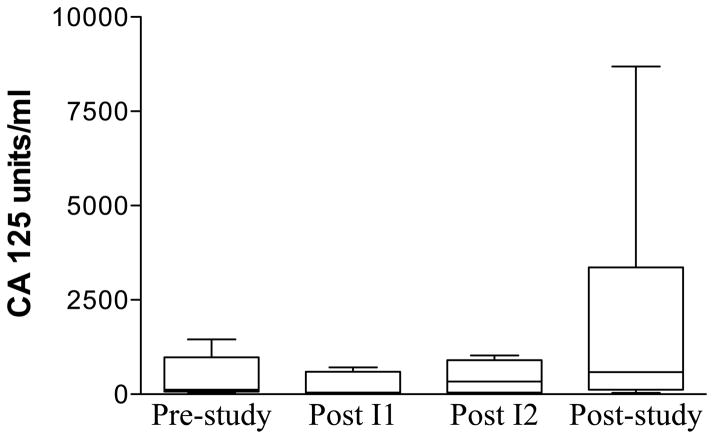
The principal objective of this study was to determine if adoptive immunotherapy using MUC1 VNTR1-stimulated CTL was effective in reducing the tumor marker of subjects with recurrent ovarian cancer. The therapy was well tolerated. The only clinical side effect was abdominal pain in one patient. Tumor marker CA- 125 dropped after the first month in four subjects (1, 3, 5, 6), stabilized in two subjects (2 (which was normal),4) and progressively increased in one subject (7) and another after the second infusion (1) (Figure 1) (mean values were: prestudy, 413; post month 1, 246; post month 2, 1395; post study, 3132). None of the differences between the time points studied were statistically significantly different.
Figure 1.
Tumor marker CA125 levels before, during and after treatment. Aphereses, followed by 9 – 11 days in culture, were separated by 28 days (month). Pre-study (0) was within 5 weeks of the first apheresis. Post month 1 and 2 infusions were at the second and third aphereses, respectively. Post study was after all 4 monthly treatment cycles. A. Each patient is represented by a line. B. Boxes are 10th–90th percentiles and bars are 5th – 95th percentiles of the mean of a single determination for each patient. Median is a line in the box.
Human leukocyte antigen (HLA) typing
MC were HLA typed, although we [10,16] and others [23] have found cytotoxicity by M1SMC may be non-MHC restricted. Subjects 4, 5 and 7 were HLA I matched with MCF-7 (Table 2). Subjects 5 and 7 were HLA I A2, the HLA I known to present a MUC1 peptide [24]. A region of MUC1, PG STAPPAHGV T, has been found to be class II MHC restricted.[25]. All subjects tested (1, 2, 3–5) were found to be HLA II matched with MCF-7, but not at DRB3, the HLA II known to present PG STAPPAHGV T [25] (Table 2). Whether other HLA I or II alleles present MUC1 peptides is unknown. There was no correlation between HLA restriction and survival.
Table 2.
HLA TYPING
| HLA/Subject | MCF-7 | #1 | #2 | #3 | #4 | #5 | #6 | #7 |
|---|---|---|---|---|---|---|---|---|
| A | 2/10 | 3/11 | 1/3 | 3/31 | 1/29 | 1/2 | 26/74 | 2/− |
| B | 18/44 | 7/35 | 8/51 | 14/40 | 7/44 | 14/57 | 15/53 | 27/40 |
| C | W4/W | W7/W | W3/W | W7/W | W4/W | W6/W1 | W01/W | |
| 7 | - | 8 | - | 6 | 4 | 03 | ||
| DRB1 | 3/15 | 13/14 | 13/16 | 1/15 | 15 | |||
| DRB3 | 2 | 52A/52B | 52C | |||||
| DRB5 | 1 | 51 | 51 | 51 | ||||
| DQB1 | 2/6 | 5/6 | 6/7 | 5/6 | 6 | |||
| MCF-7 HLA I match | no | no | no | yes | yes | no | yes | |
| MCF-7 HLA II match | yes | NA* | yes | yes | yes | NA | NA | |
NA = not available
Cytotoxicity
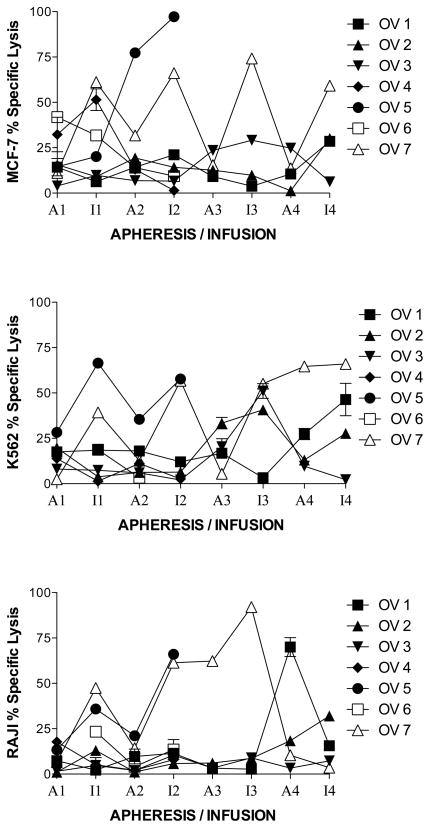
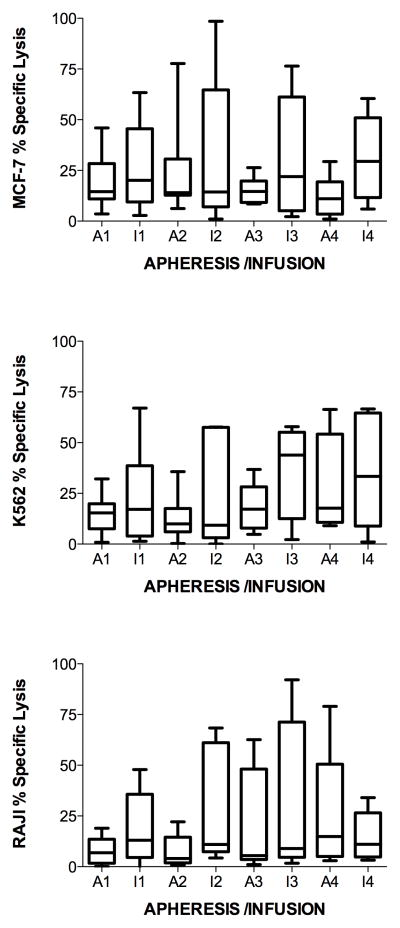
To determine if killer cells increased with each monthly cycle of stimulation of PBMC with MUC1, lysis of MUC1-expressing MCF-7 and nonspecific targets of NK (K562) and LAK (RAJI) activities, were analyzed after two simulations with MUC1 each month. The measurements for the lysis of the target cells initially (prestudy) at apheresis and after stimulation each month were taken in triplicate. The average of the 3 measurements was used for boxplot comparison and calculation of the mean and median value across subjects initially (prestudy) and after stimulation each month. At each apheresis, lysis remained stable or decreased, except for one or two subjects, for one or two apheresis (figure 2). The subjects and month of apheresis differed for lysis of MCF-7, K562 and RAJI (figure 2). Regarding lysis of MCF-7 (Figure 2, top panel), there were no statistically significant differences between prestudy (19 +/− 3%) to post stimulation in month 1 (29 +/− 4%), 2 (19 +/− 5%) or 3 (29 +/− 8%). However, in month 4 the lysis of MCF-7 was statistically significantly greater (39 +/− 5%, p = 0.001) than prestudy (due to subjects 1, 2 and 7). There were no statistical differences from one month to the next. Lysis of K562 also did not show a statistically significant increase from prestudy (16 +/− 2%) to month 1 (24 +/− 4%), from prestudy to month 2 (35 +/− 6%, p = 0.004), or from one month to the next (Figure 2, middle panel). However, in months 3 (42 +/− 6%, p = 10−6) (due to subjects 2, 3 and 7) and 4 (42 +/− 7%, p = 10−5) (due to subjects 1, 2 and 7) the lysis of K562 was statistically significantly greater than prestudy (Figure 2, middle panel). Similarly to lysis of MCF-7 and K562, lysis of RAJI did not show a statistically significant increase from prestudy (12 +/− 1%) to month 1 (22 +/− 4%) (p = 0.016), or month 2 (28 +/− 6%, p = 0.005) ; however, a statistically significant difference was noted between prestudy and month 3 (43 +/−11%, p = 0.0006) (due to subject 7). No such difference was found from month 1 to 2 or month 2 to 3 (Figure 2, lower panel). Also, as opposed to lysis of MCF-7 and K562, lysis of RAJI showed a nonstatistically significant decrease from prestudy (12 +/− 1%) to month 4 (8 +/− 1%) and from month 3 (43 +/− 11%) to 4 (8 +/− 1%) (Figure 2, lower panel). However, as opposed to others, subject 2 increased at month 4 infusion. There were no statistical differences between the lysis of MCF-7, K562 or RAJI at months 1, 2 or 3. Lysis of MCF-7 and K562 were statistically significantly greater than RAJI at month 4 (p = 10−6).
Figure 2.
MUC1-stimulated PBMC specific lysis of targets at effector to target cell ratio = 10:1. Aphereses were monthly. Infusions were at days 9 – 11 in culture. Apheresis (A) or infusion (I) and month (number) is indicated on the horizontal axis. A. Each patient is represented by a line. B. Boxes are 10th–90th percentiles and bars are 5th – 95th percentiles of the mean of 3 or 6 repetitions from each patient. Median is a line in the box.
Cytokines
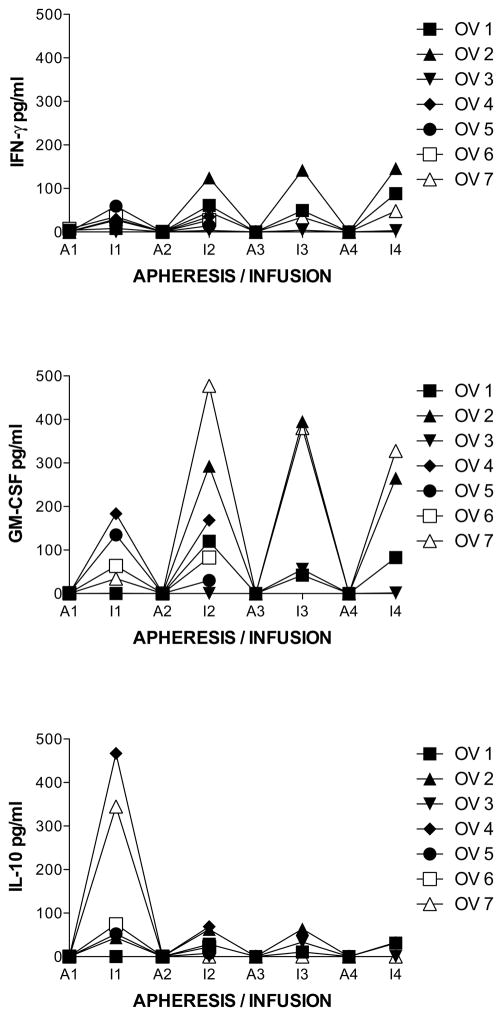
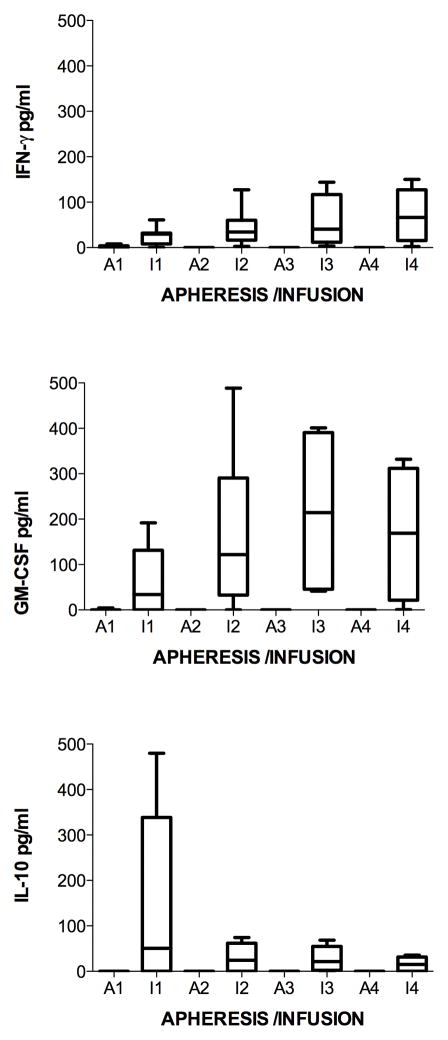
To determine if cytokine production was increased with each monthly cycle of stimulation of PBMC with MUC1, levels of cytokines (G-IFN, GM-CSF, IL-10, and TNF-Alpha) were analyzed from supernatants of M1SMC after two stimulations with MUC1 each month. The measurements for the cytokine production of M1SMC initially (prestudy) and after stimulation each month were taken in triplicate. The average of the 3 measurements was used for boxplot comparison and calculation of the mean and median value across subjects initially (prestudy) and after stimulation each month. Cytokines were undetectable at each apheresis. Regarding production of G-IFN, all measurements and the time (t = 0, 1, 2, 3, 4) in which they were taken were used in the calculation of the Spearman’s correlation coefficient. The boxplot comparison, mean and median measurements all show a detectable increase in the measured variable, G-IFN (Figure 3, top panel). The exact sign test and Wilcoxon signed rank test both indicate a difference over time in the distribution using Spearman’s correlation, although not statistically significant when multiple comparisons are considered using Bonferroni correction (combined α=0.05). The sign and Wilcoxon p-values for a 2-tailed test are p=0.036 and p=0.031, respectively. Evaluating the change between prestudy and month 1 and between each following month showed less increases with time. There was a statistically significant increase between prestudy (1.8 +/− 0.6 pg/ml) to post stimulation in month 1 (29 +/− 4 pg/ml, p = 10−7) (due to all subjects except 1 and 3). The difference was not significant, accounting for multiple comparisons between month 1 and 2 (50 +/− 9 pg/ml, p = 0.04), and not between 2 and 3 (57 +/−16 pg/ml) or 3 and 4 (96 +/− 14 pg/ml). There were no increases with subject 3 in any of the months, whereas that of subject 2 showed the greatest increase in months 2, 3 and 4. Production of GM-CSF also showed smaller increases in the increment with time (Figure 3, middle panel). There was a statistically significant increase between prestudy (0.5 +/− 0.2 pg/ml) to post stimulation in month 1 (60 +/− 15 pg/ml, p = 4x10⁻⁴) (due to subjects 4, 5, 6 and 7). The difference was not statistically significant between month 1 and 2 (167 +/− 35 pg/ml, p = 0.007) (due to subjects 1, 2, 4 and 7), and not between month 2 and 3 (218 +/− 51 pg/ml) or 3 and 4 (169 +/− 40 pg/ml), which decreased. There were no increases with subject 3 except slightly in month 3, whereas that of subjects 2 and 7 showed the greatest increase in months 2, 3 and 4. As opposed to production of G-IFN and GM-CSF, IL-10 only increased from prestudy (0.0 +/− 0.0 pg/ml) to month 1 (140 +/− 39 pg/ml, p = 8x10⁻⁴) (due to all subjects except 1 and 3) and then decreased in months 2 (27 +/− 6 pg/ml), 3 (27 +/− 7 pg/ml) and 4 (16 +/− 5 pg/ml) (Figure 3, lower panel). There were no increases with subject 3 except slightly in month 3, whereas that of subject 2 showed the greatest increase in months 2, 3 and 4. TNF-Alpha was not detected except in month 4 in patient 2, at 17 pg/ml.
Figure 3.
Cytokine levels from supernatants of MUC1-stimulated PBMC. Aphereses were monthly. Infusions were at days 9 – 11 in culture. Apheresis (A) or infusion (I) and month (number) is indicated on the horizontal axis. A. Each patient is represented by a line. B. Boxes are 10th–90th percentiles and bars are 5th – 95th percentiles of the mean of 3 or 6 repetitions from each patient. Median is a line in the box.
Immunophenotyping
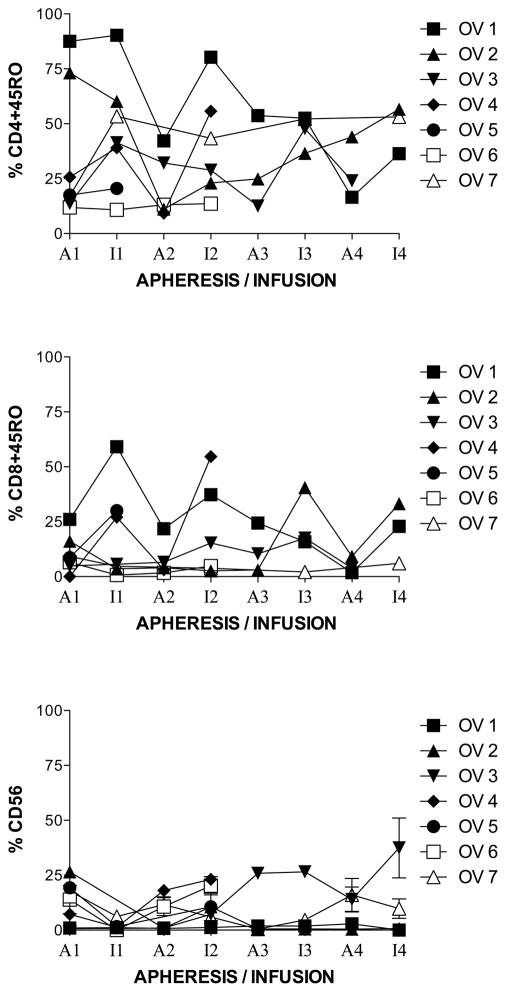
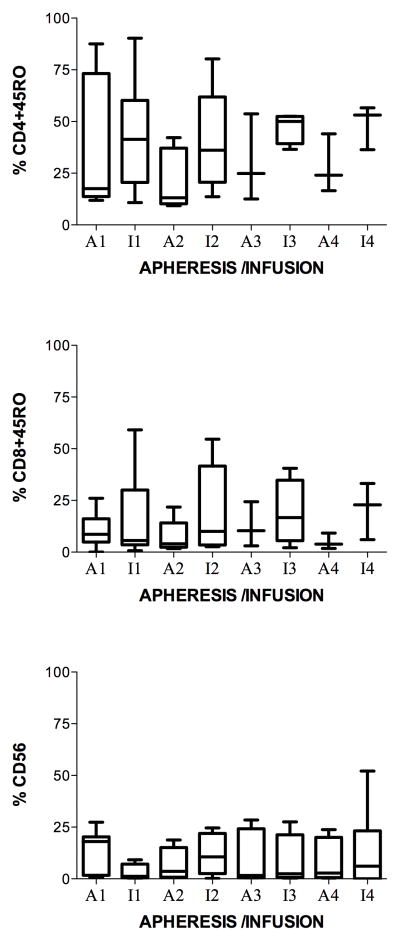
To determine if the % of memory T-lymphocytes or NK cells were changed with each monthly cycle of stimulation with MUC1, immunophenotypes for memory (CD45RO+) CD4+ (CD4+CD45RO+) (Figure 4, top panel) and CD8+ (CD8+CD45RO+) (Figure 4, middle panel) T-lymphocytes were analyzed after two simulations with MUC1 each month. At each apheresis, the percent of both remained stable or decreased except for one subject (number 2) at apheresis four. Although the mean showed a tendency for the CD4+CD45RO+ and CD8+ CD8+CD45RO+ to increase slightly from prestudy to month 1, the exact sign test and Wilcoxon signed rank test indicate no significant difference of rs from the prestudy values. CD4+CD45RO+ T-lymphocytes increased, non-significantly, from prestudy (35 +/− 12 %) to month 1 (45 +/− 10 %) and then decreased in months 2 (35 +/− 10 %), 3 (27 +/− 10 %) and 4 (21 +/− 10 %) (Figure 4, top panel). Subject 2 was the only one to show a gradual increase from apheresis 2 to infusion 4. CD8+CD45RO+ T-lymphocytes lymphocytes increased, non-significantly, from prestudy (10 +/− 3 %) to month 1 (18 +/− 8 %) but then remained stable in months 2 (20 +/− 9 %), 3 (19 +/− 8 %) and 4 (21 +/− 8 %) (Figure 4, middle panel). Subject 2 showed an increase at infusions 3 and 4, whereas subject 1 showed a gradual decrease until infusion 4 where they increased. The percent of natural killer (NK) cells (CD 56+ %) decreased from prestudy (14 +/− 2 %) to month one (3 +/− 1 %), rose at apheresis two (8 +/− 2 %), then remained stable or decreased except in a six-month survivor, subject 3, where it rose at apheresis 3 and remained elevated through infusion 4 (figure 4, lower panel). The NED survivor, subject 2, had one of the lowest percent of CD 56+ (NK) cells throughout the study, after apheresis one (prestudy).
Figure 4.
Immunophenotyping of MUC1-stimulated PBMC for memory T-lymphocytes and NK cells. Aphereses were monthly. Infusions were at days 9 – 11 in culture. Apheresis (A) or infusion (I) and month (number) is indicated on the horizontal axis. A. Each patient is represented by a line. B. Boxes are 10th–90th percentiles and bars are 5th – 95th percentiles of the mean of a single determination for each patient. Median is a line in the box.
Discussion
This study shows that M1SMC can be given safely intraperitoneally to subjects with recurrent ovarian cancer, after resection and chemotherapy. There were, however, complications with the intraperitoneal port in three of seven subjects which prevented further therapy. This route of delivery may thus be limited. Subjects who have received previous intraperitoneal chemotherapy may be at increased risk for a reactive process which causes occlusion of the port. Others have experienced similar problems and now recommend against the use of fenestrated type ports, but rather recommend use of single lumen ports designed for intravenous access [26]. There was no correlation between survival and the number of infusions of M1SMC. One patient was a long-term survivor, with no evidence of disease (NED). This patient had resection of gross disease with concurrent chemotherapy and radiation therapy after the completion of immunotherapy. Subjects with recurrent ovarian cancer are not cured with the other therapies she received [1]. A case-control group of 42 similar treated subjects with relapsed ovarian cancer at the Harrington Cancer Center showed no five year survivors. There is precedent for immunotherapy eliminating microscopic disease with Her2 – specific CTL, where clearance of bone marrow disease was observed in a breast cancer subject [27]. There was no correlation between HLA restriction and survival. This corroborates other studies which showed that MUC1 tumor cell killing may be non-MHC restricted [10,16,23]. The tumor marker CA 125 was reduced after the first month of immunotherapy. However, after that, the tumor marker rose.
M1SMC were evaluated for cytotoxicity, cytokine production and immunophenotype. Killer cells were increased in the first month. However, in the second month, killer cell activities, either decreased (lysis of MUC1-expressing MCF-7) or plateaued (NK and LAK). The percent of NK cells (CD 56+) inversely correlated with other immune parameters. Cytokine production was also increased in the first month. However, after the second month, the levels of the type I cytokines (G-IFN, GM-CSF) plateaued while the type II cytokine interleukin (IL)-10 decreased. Thus cytokine production followed the trend of the killer cell activities. The % of memory T-lymphocytes increased in the first month. However, in the second month, the % of memory T-lymphocytes, either decreased (CD4+CD45RO+) or plateaued (CD8+ CD8+CD45RO+). This implies that induction of immune activated T-cells with memory phenotype was produced in the initial month of stimulation, but was not increased with other cycles of immune stimulation and infusion of adoptive T cells. If this data is validated in a larger trial, it would imply that multiple cycles of immunotherapy may not be necessary.
Others [28] have found a lower in vivo survival of tumor-specific CTL at the third treatment. However, the same group reported a direct correlation with the number of treatment cycles and tumor response [29]. This implies that the function or survival of the CTL may not correlate with clinical response. Others have found the reverse, where the survival of the CTL is directly correlated with clinical response [30]. Procedures to develop more effective CTL from PBMC are under investigation. Dendritic cells may prolong the survival of T-cells, and have been shown to enhance the efficacy of T-cells therapy in preclinical studies (Wang, unpublished), as well as function alone in humans [31]. Other approaches include enhancers for immune stimulation, such as, co-stimulatory molecules [32,33,34], as well as modifying the host immune environment, depleting or inhibiting suppressor T cellsand myeloid-derived suppressor cells; in addition to disrupting inhibitors of activated immune cells [34]. In this regard, we found in a subset of four subjects that completed three cycles of immunotherapy that the systemic Fox P3/CTLA – 4 memory T cell ratio inversely correlated with disease-free survival [35]. Some of these elements may be added as chimeric antigen receptors in T-cell therapy, which has shown enhanced regression of cancer in preclinical models [36].
Acknowledgments
Support: Harrington Cancer RF, DVAMRP, IRP TTUHSC SOM, DODMRDC, NIH
The authors are grateful to those mentioned in the text for supplying materials, Coffee Memorial Blood Bank, Amarillo, TX, for apheresis, Khaliquzzaman A. Samad, Robin McWherter and Beth Vertin for technical assistance, the Clinical Trials Department of the Harrington Cancer Center, Amarillo, TX, for data collection and Zhenyao Wang for computer graphics. This work was supported by grants from the Harrington Cancer Research Foundation, Amarillo, TX, Department of Veterans Affairs Medical Research Program 0006, Institutional Research Program of the Texas Tech School of Medicine, Department of Defense Medical Research Development Command DAMD 17-01-1-0429, and the National Institutes of Health grant 1R21CA89883-01A1.
Abbreviations
- ATCC
American Type Culture Collection
- CTL
cytotoxic T-lymphocytes
- E:T
effector to target
- FDA
Food and Drug Administration
- HLA
Human leukocyte antigen
- IP
intraperitoneal
- IL
interleukin
- IRB
Investigational Review Board
- LAK
lymphokine-activated killer
- M1SMC
MUC1-stimulated mononuclear cells
- MUC 1
mucin 1
- NK
natural killer
- NED
no evidence of disease
- PBMC
peripheral blood mononuclear cells
- TIL
tumor infiltrating lymphocytes
- VNTR
variable number of tandem repeats
Footnotes
Financial Disclosures: The authors have declared there are no financial conflicts of interest in regards to this work.
References
- 1.Cannistra SA, Gershenson DM, Recht A. Ovarian Cancer, Fallopian Tube Carcinoma, and Pertoneal Carcinoma. In: DeVita VTJ, Lawrence TS, Rosenburg SA, editors. Cancer, Principles and Practice of Oncology. Philadelphia: Lippincott Williams & Wilkins; 2008. pp. 1568–94. [Google Scholar]
- 2.Freedman RS, Edwards CL, Kavanagh JJ, et al. Intraperitoneal adoptive immunotherapy of ovarian carcinoma with tumor-infiltrating lymphocytes and low-dose recombinant interleukin-2: a pilot trial. J Immunother Emphasis Tumor Immunol. 1994;16:198–210. doi: 10.1097/00002371-199410000-00004. [DOI] [PubMed] [Google Scholar]
- 3.Canevari S, Stoter G, Arienti F, et al. Regression of advanced ovarian carcinoma by intraperitoneal treatment with autologous T lymphocytes retargeted by a bispecific monoclonal antibody. J Natl Cancer Inst. 1995;87:1463–1469. doi: 10.1093/jnci/87.19.1463. [DOI] [PubMed] [Google Scholar]
- 4.Zou W. Immunosuppressive networks in the tumour environment and their therapeutic relevance. Nat Rev Cancer. 2005;5:263–274. doi: 10.1038/nrc1586. [DOI] [PubMed] [Google Scholar]
- 5.Straathof KCM, Bollard CM, Popat U, et al. Treatment of nasopharyngeal carcinoma with Epstein-Barr virus--specific T lymphocytes. Blood. 2005 Mar 1;105(5):1898–904. doi: 10.1182/blood-2004-07-2975. Epub 2004 Nov 12. [DOI] [PubMed] [Google Scholar]
- 6.Marijt E, Wafelman A, van der Hoorn M, et al. Phase I/II feasibility study evaluating the generation of leukemia-reactive cytotoxic T lymphocyte lines for treatment of patients with relapsed leukemia after allogeneic stem cell transplantation. Haematologica. 2007;92:72–80. doi: 10.3324/haematol.10433. [DOI] [PubMed] [Google Scholar]
- 7.Toh U, Yamana H, Sueyoshi S, et al. Locoregional cellular immunotherapy for patients with advanced esophageal cancer. Clin Cancer Res. 2000;6:4663–4673. [PubMed] [Google Scholar]
- 8.Dudley ME, Yang JC, Sherry R, et al. Adoptive cell therapy for patients with metastatic melanoma: evaluation of intensive myeloablative chemoradiation preparative regimens. J Clin Oncol. 2008 Nov 10;26(32):5233–9. doi: 10.1200/JCO.2008.16.5449. Epub 2008 Sep 22. [DOI] [PMC free article] [PubMed] [Google Scholar]
- 9.Yee C, Thompson JA, Byrd D, et al. Adoptive T cell therapy using antigen-specific CD8+ T cell clones for the treatment of patients with metastatic melanoma: in vivo persistence, migration, and antitumor effect of transferred T cells. Proc Natl Acad Sci U S A. 2002;99:16168–16173. doi: 10.1073/pnas.242600099. [DOI] [PMC free article] [PubMed] [Google Scholar]
- 10.Wright SE, Kilinski L, Talib S, et al. Cytotoxic T lymphocytes from humans with adenocarcinomas stimulated by native MUC1 mucin and a mucin peptide mutated at a glycosylation site. J Immunother. 2000;23:2–10. doi: 10.1097/00002371-200001000-00002. [DOI] [PubMed] [Google Scholar]
- 11.Ioannides CG, Fisk B, Jerome KR, et al. Cytotoxic T cells from ovarian malignant tumors can recognize polymorphic epithelial mucin core peptides. J Immunol (UNITED STATES) 1993;151:3693–3703. [PubMed] [Google Scholar]
- 12.Wright SE, Khaznadar R, Wang Z, et al. Generation of MUC1-stimulated mononuclear cells using optimized conditions. Scand J Immunol. 2008 Jan;67(1):24–29. doi: 10.1111/j.1365-3083.2007.02032.x. [DOI] [PubMed] [Google Scholar]
- 13.Wright SE, Rewers-Felkins KA, Quinlin IS, et al. Tumor burden influences cytotoxic T cell development in metastatic breast cancer patients--a phase I/II study. Immunol Invest. 2009;38:820–838. doi: 10.3109/08820130903278089. [DOI] [PubMed] [Google Scholar]
- 14.Ross S, Osband M. Treatment of metastatic renal cell carcinoma (RCC) with autloymphocyte therapy. Correlation between survival and the number of infused lymphocytes. FASEB J. 1989;3(3 Part 1):A825. (Abstr 3482) [Google Scholar]
- 15.Quinlin IS, Burnside JS, Dombrowski KE, et al. Context of MUC1 epitope: immunogenicity. Oncol Rep. 2007;17:453–456. doi: 10.3892/or.17.2.453. [DOI] [PubMed] [Google Scholar]
- 16.Wright SE, Rewers-Felkins KA, Quinlin IS, et al. MHC-unrestricted lysis of MUC1-expressing cells by human peripheral blood mononuclear cells. Immunol Invest. 2008;37:215–225. doi: 10.1080/08820130801967874. [DOI] [PubMed] [Google Scholar]
- 17.Dobrzanski MJ, Reome JB, Hylind JC, et al. CD8-mediated type 1 antitumor responses selectively modulate endogenous differentiated and nondifferentiated T cell localization, activation, and function in progressive breast cancer. J Immunol. 2006;177:8191–8201. doi: 10.4049/jimmunol.177.11.8191. [DOI] [PubMed] [Google Scholar]
- 18.Barnd DL, Lan MS, Metzgar RS, et al. Specific, major histocompatibility complex-unrestricted recognition of tumor-associated mucins by human cytotoxic T cells. Proc Natl Acad Sci U S A (UNITED STATES) 1989;86:7159–7163. doi: 10.1073/pnas.86.18.7159. [DOI] [PMC free article] [PubMed] [Google Scholar]
- 19.Roehm NW, Rodgers GH, Hatfield SM, et al. An improved colorimetric assay for cell proliferation and viability utilizing the tetrazolium salt XTT. J Immunol Methods. 1991;142:257–265. doi: 10.1016/0022-1759(91)90114-u. [DOI] [PubMed] [Google Scholar]
- 20.Kornbluth J, Flomenberg N, Dupont B. Cell surface phenotype of a cloned line of natural killer cells. J Immunol. 1982;129:2831–2837. [PubMed] [Google Scholar]
- 21.von Zons P, Crowley-Nowick P, Friberg D, et al. Comparison of europium and chromium release assays: cytotoxicity in healthy individuals and patients with cervical carcinoma. Clin Diagn Lab Immunol (UNITED STATES) 1997;4:202–207. doi: 10.1128/cdli.4.2.202-207.1997. [DOI] [PMC free article] [PubMed] [Google Scholar]
- 22.Cancer Therapy Evaluation Program, DCTD, NCI, NIH, DHHS. [Accessed April 30, 1999];Common Toxicity Criteria, Version 2.0 (CTC) 1998 March 23; Available at http://ctep.info.nih.gov/reporting/ctc.html.
- 23.Alajez NM, Schmielau J, Alter MD, et al. Therapeutic potential of a tumor-specific, MHC-unrestricted T-cell receptor expressed on effector cells of the innate and the adaptive immune system through bone marrow transduction and immune reconstitution. Blood. 2005;105:4583–4589. doi: 10.1182/blood-2004-10-3848. [DOI] [PMC free article] [PubMed] [Google Scholar]
- 24.Apostolopoulos V, Barnes N, Pietersz GA, et al. Ex vivo targeting of the macrophage mannose receptor generates anti-tumor CTL responses. Vaccine. 2000;18:3174–3184. doi: 10.1016/s0264-410x(00)00090-6. [DOI] [PubMed] [Google Scholar]
- 25.Hiltbold EM, Ciborowski P, Finn OJ. Naturally processed class II epitope from the tumor antigen MUC1 primes human CD4+ T cells. Cancer Res. 1998;58:5066–5070. [PubMed] [Google Scholar]
- 26.Walker JL, Armstrong DK, Huang HQ, et al. Intraperitoneal catheter outcomes in a phase III trial of intravenous versus intraperitoneal chemotherapy in optimal stage III ovarian and primary peritoneal cancer: a Gynecologic Oncology Group Study. Gynecol Oncol. 2006;100:27–32. doi: 10.1016/j.ygyno.2005.11.013. [DOI] [PubMed] [Google Scholar]
- 27.Bernhard H, Neudorfer J, Gebhard K, et al. Adoptive transfer of autologous, HER2-specific, cytotoxic T lymphocytes for the treatment of HER2-overexpressing breast cancer. Cancer Immunol Immunother. 2008;57:271–280. doi: 10.1007/s00262-007-0355-7. [DOI] [PMC free article] [PubMed] [Google Scholar]
- 28.Meidenbauer N, Marienhagen J, Laumer M, et al. Survival and tumor localization of adoptively transferred Melan-A-specific T cells in melanoma patients. J Immunol. 2003;170:2161–2169. doi: 10.4049/jimmunol.170.4.2161. [DOI] [PubMed] [Google Scholar]
- 29.Mackensen A, Meidenbauer N, Vogl S, et al. Phase I study of adoptive T-cell therapy using antigen-specific CD8+ T cells for the treatment of patients with metastatic melanoma. J Clin Oncol. 2006;24:5060–5069. doi: 10.1200/JCO.2006.07.1100. [DOI] [PubMed] [Google Scholar]
- 30.Zhou J, Shen X, Huang J, et al. Telomere length of transferred lymphocytes correlates with in vivo persistence and tumor regression in melanoma patients receiving cell transfer therapy. J Immunol. 2005;175:7046–7052. doi: 10.4049/jimmunol.175.10.7046. [DOI] [PMC free article] [PubMed] [Google Scholar]
- 31.Loveland BE, Zhao A, White S, et al. Mannan-MUC1-pulsed dendritic cell immunotherapy: a phase I trial in patients with adenocarcinoma. Clin Cancer Res. 2006;12:869–877. doi: 10.1158/1078-0432.CCR-05-1574. [DOI] [PubMed] [Google Scholar]
- 32.Habib-Agahi M, Phan TT, Searle PF. Co-stimulation with 4-1BB ligand allows extended T-cell proliferation, synergizes with CD80/CD86 and can reactivate anergic T cells. Int Immunol. 2007;19(12):1383–94. doi: 10.1093/intimm/dxm106. Epub 2007 Oct 31. [DOI] [PubMed] [Google Scholar]
- 33.Rudolf D, Silberzahn T, Walter S, et al. Potent costimulation of human CD8 T cells by anti-4-1BB and anti-CD28 on synthetic artificial antigen presenting cells. Cancer Immunol Immunother. 2008 Feb;57(2):175–83. doi: 10.1007/s00262-007-0360-x. Epub 2007 Jul 27. [DOI] [PMC free article] [PubMed] [Google Scholar]
- 34.Prenndergast GC, Jaffee EM, editors. Cancer immunotherapy: Immune suppression and tumor growth. Amsterdam: Academic Press/Elsevier; 2007. [Google Scholar]
- 35.Dobrzanski MJ, Rewers-Felkins KA, Quinlin IS, et al. Autologous MUC1-specific Th1 effector cell immunotherapy induces differential levels of systemic TReg cell subpopulations that result in increased ovarian cancer patient survival. Clin Immunol. 2009;133:333–352. doi: 10.1016/j.clim.2009.08.007. [DOI] [PMC free article] [PubMed] [Google Scholar]
- 36.Milone MC, Fish JD, Carpenito C, et al. Chimeric receptors containing CD137 signal transduction domains mediate enhanced survival of T cells and increased antileukemic efficacy in vivo. Mol Ther. 2009;17:1453–1464. doi: 10.1038/mt.2009.83. [DOI] [PMC free article] [PubMed] [Google Scholar]


